Copyright
©2012 Baishideng Publishing Group Co.
World J Gastroenterol. Jan 21, 2012; 18(3): 285-290
Published online Jan 21, 2012. doi: 10.3748/wjg.v18.i3.285
Published online Jan 21, 2012. doi: 10.3748/wjg.v18.i3.285
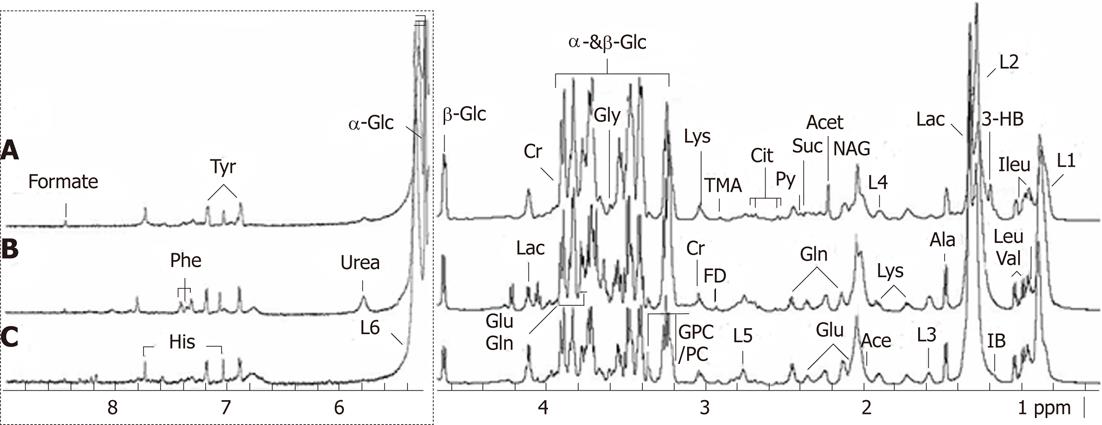
Figure 1 600 MHz 1H NMR spectra (δ0.
5-4.7 and δ5.2-9.0) of serum obtained from (C) control, (B) compensated liver cirrhosis and (A) decompensated liver cirrhosis patients. The region of δ5.2-9.0 (in the dashed box) is magnified 8 times compared to the corresponding region of δ0.5-4.7 for the purpose of clarity. 3-HB: 3-Hydroxybutyrate; Ace: Acetate; Acet: Acetone; Ala: Alanine; Cit: Citrate; Cr: Creatine; FD: Formaldehyde; Glu: Glutamate; Gln: Glutamine; Gly: Glycine; GPC: Glycerophosphocholine; His: Histidine; Ile: Isoleucine; IB: Isobutyrate; Lac: Lactate; Leu: Leucine; L1 Lipid: CH3-(CH2)n-(LDL&VLDL); L2 Lipid: CH3-(CH2)n-(LDL&VLDL); L3 Lipid: -CH2-CH2-C=O; L4 Lipid: -CH2-CH=CH-; L5 Lipid: =CH-CH2-CH=; L6 Lipid: -CH=CH-; Lys: Lysine; NAG: N-acetyl glycoprotein signals; PC: Phosphocholine; Phe: Phenylalanine; Py: Pyruvate; Suc: Succinate; TMA: Trimethylamine; Tyr: Tyrosine; Val: Valine; α-Glc: α-Glucose; β-Glc: β-Glucose.
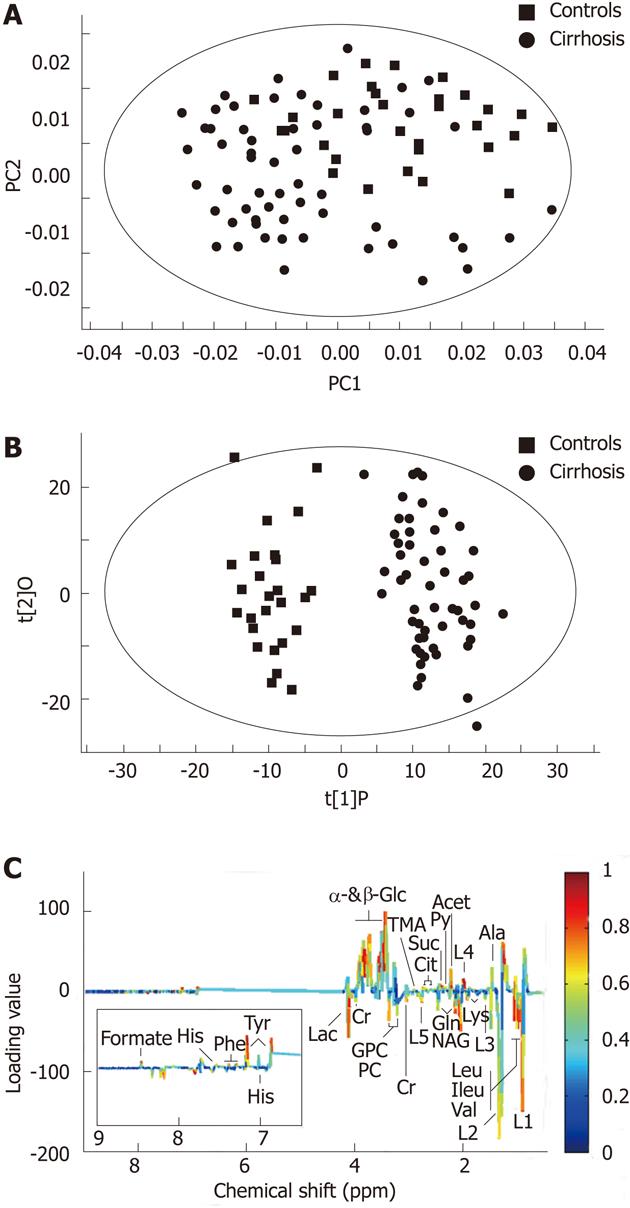
Figure 2 Multivariate modeling of control and cirrhotic subjects.
A: Principal component analysis score plot of the serum 1H nuclear magnetic resonance spectra from controls (squares) and cirrhotic patients (dots); B: Orthogonal partial least-squares discriminant analysis (OPLS-DA) score plot of controls (squares) and cirrhotic patients (dots); C: Corresponding coefficient loading plots for the discrimination of the OPLS-DA model.
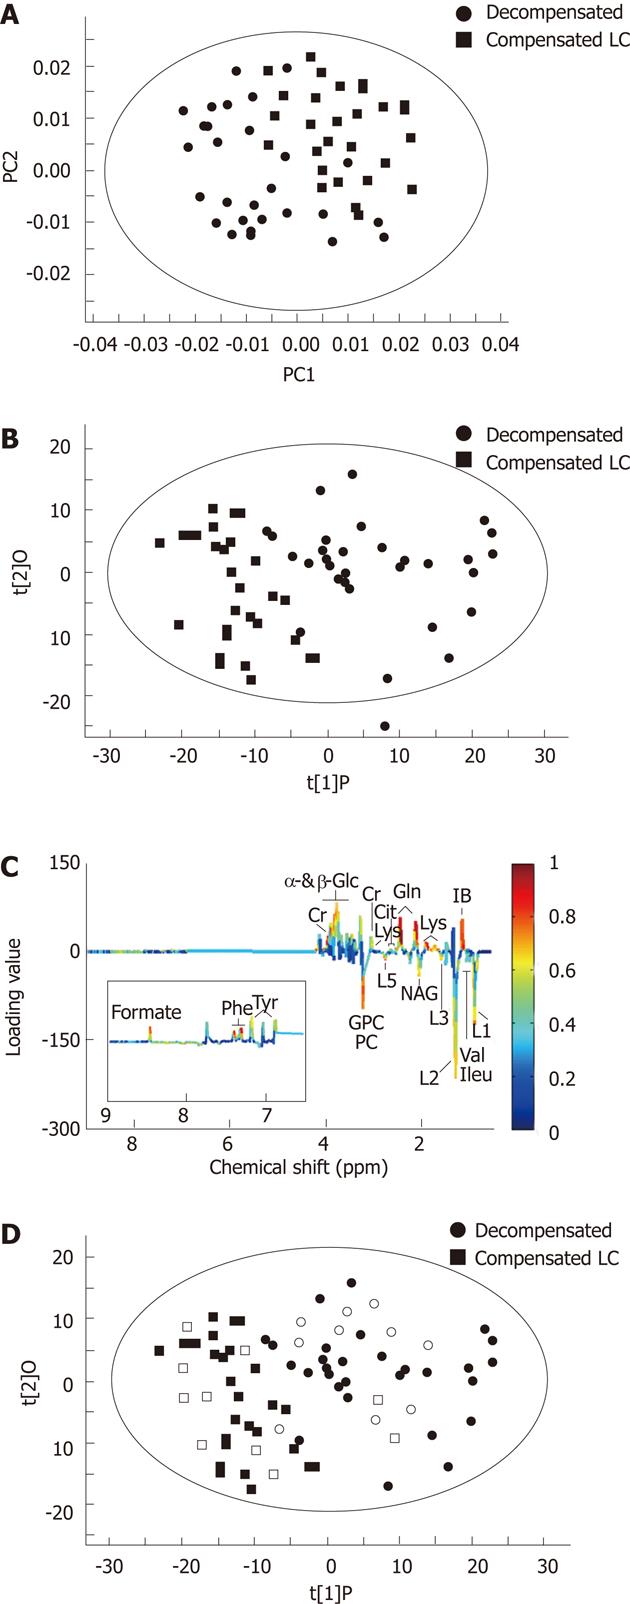
Figure 3 Multivariate modeling of compensated and decompensated liver cirrhosis patients.
A: Principal component analysis score plot of the serum 1H nuclear magnetic resonance spectra from compensated liver cirrhosis (LC) (squares) and decompensated LC (black dots) patients. B: Orthogonal partial least-squares discriminant analysis (OPLS-DA) score plot of compensated LC (squares) and decompensated LC (dots) patients; C: Corresponding coefficient loading plots for the discrimination of the OPLS-DA model; D: Validation tests of the discriminatory power using the OPLS-DA model. Twenty cirrhotic patients were selected randomly and included 10 compensated LC (empty squares) and 10 decompensated LC (empty dots) patients.
- Citation: Qi SW, Tu ZG, Peng WJ, Wang LX, Ou-Yang X, Cai AJ, Dai Y. 1H NMR-based serum metabolic profiling in compensated and decompensated cirrhosis. World J Gastroenterol 2012; 18(3): 285-290
- URL: https://www.wjgnet.com/1007-9327/full/v18/i3/285.htm
- DOI: https://dx.doi.org/10.3748/wjg.v18.i3.285


