Copyright
©2012 Baishideng Publishing Group Co.
World J Gastroenterol. Jun 7, 2012; 18(21): 2695-2703
Published online Jun 7, 2012. doi: 10.3748/wjg.v18.i21.2695
Published online Jun 7, 2012. doi: 10.3748/wjg.v18.i21.2695
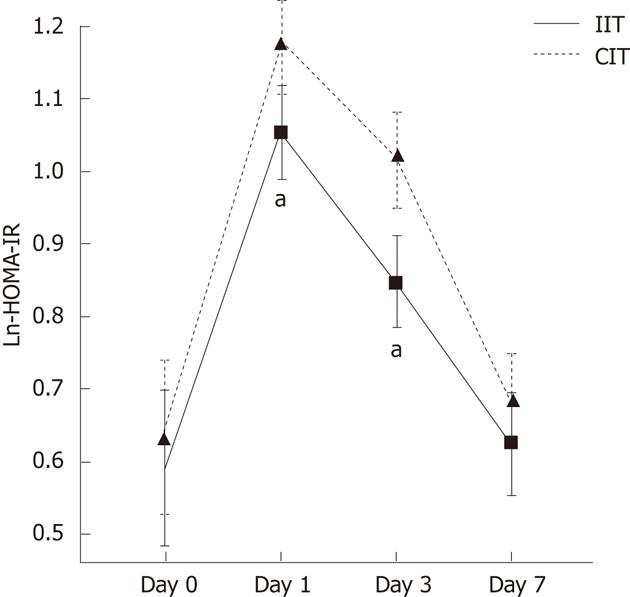
Figure 1 Homeostasis model assessment of insulin resistance.
aP < 0.05 vs conventional insulin therapy (CIT). IIT: Intensive insulin therapy group.
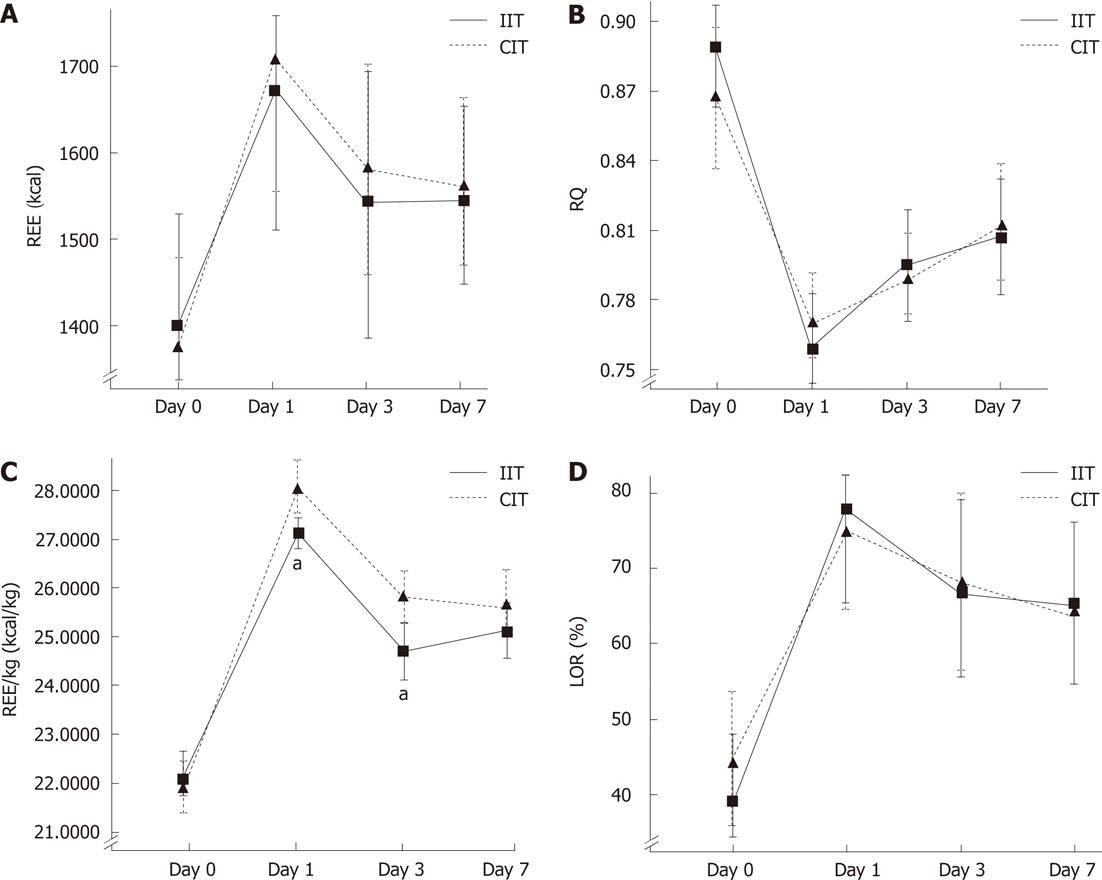
Figure 2 Energy metabolism.
REE: Resting energy expenditure; RQ: Respiratory quotient; REE/kg: Resting energy expenditure per kilogram; LOR: Lipid oxidation ratio; Solid-line curve represented intensive insulin therapy group. Dotted-line curve was conventional insulin therapy group. aP < 0.05 vs conventional insulin therapy (CIT). IIT: Intensive insulin therapy.
-
Citation: Liu HC, Zhou YB, Chen D, Niu ZJ, Yu Y. Effect of intensive
vs conventional insulin therapy on perioperative nutritional substrates metabolism in patients undergoing gastrectomy. World J Gastroenterol 2012; 18(21): 2695-2703 - URL: https://www.wjgnet.com/1007-9327/full/v18/i21/2695.htm
- DOI: https://dx.doi.org/10.3748/wjg.v18.i21.2695


