©2009 The WJG Press and Baishideng.
World J Gastroenterol. Dec 28, 2009; 15(48): 6068-6074
Published online Dec 28, 2009. doi: 10.3748/wjg.15.6068
Published online Dec 28, 2009. doi: 10.3748/wjg.15.6068
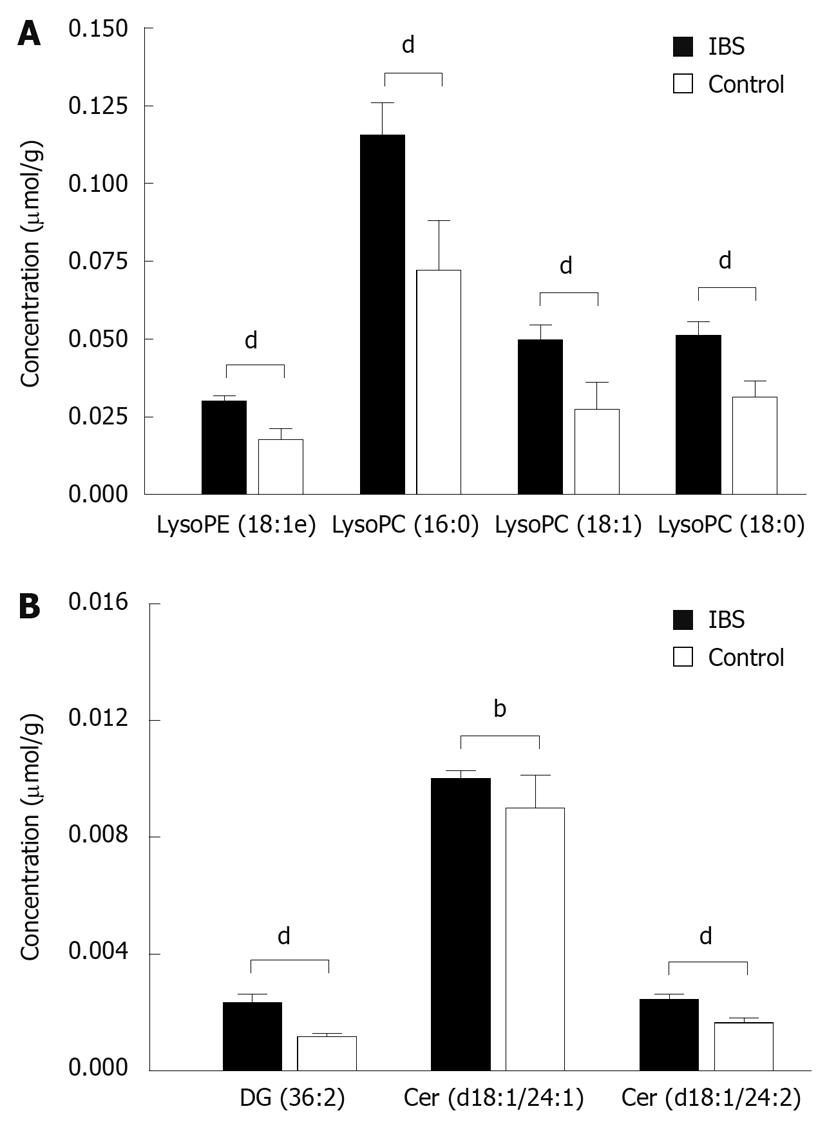
Figure 1 The concentrations (mean ± SE) of selected lysophospholipids in mucosal biopsies from irritable bowel syndrome (IBS) patients (n = 15) and healthy controls (n = 9) as measured by UPLC/MS.
(A) Patients and controls differ significantly from each other for all presented lysophospholipids, as well as for (B) diacylglycerol and ceramides. LysoPE: Lysophosphatidylethanolamine; LysoPC: Lysophosphatidylcholine. P values are based on Wilcoxon rank sum test with bP < 0.01 and dP < 0.001.
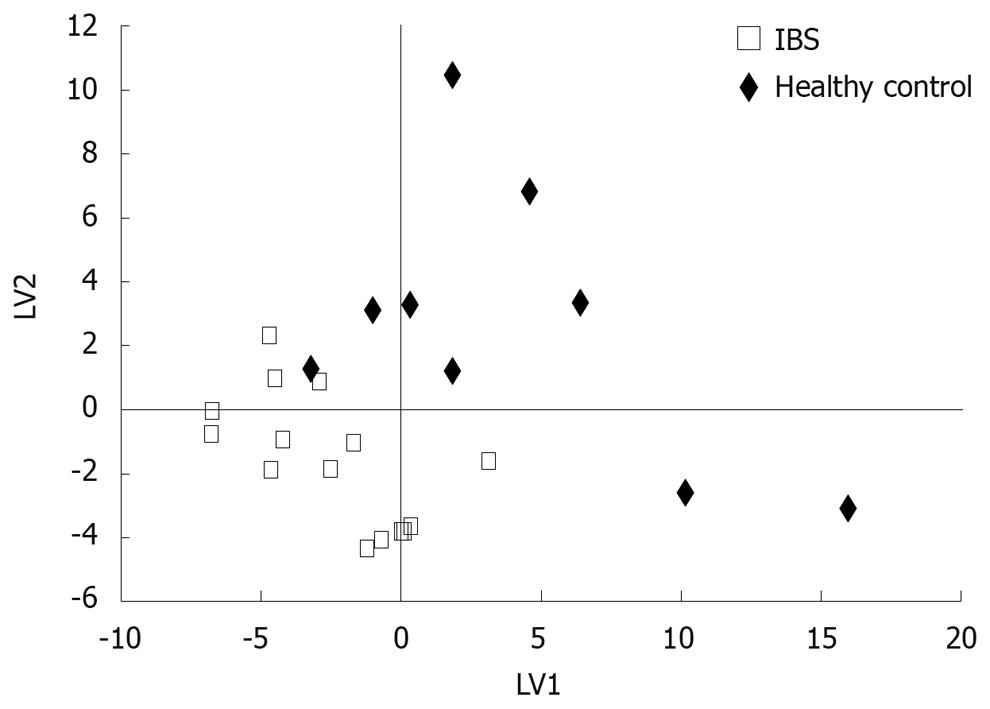
Figure 2 Partial least squares discriminant analysis (PLS/DA) of GC × GC-Tof-based metabolic profiles for IBS patients (n = 15) and healthy controls (n = 9).
Two latent variables (LVs) were used (Q2 = 61%).
- Citation: Kajander K, Myllyluoma E, Kyrönpalo S, Rasmussen M, Sipponen P, Mattila I, Seppänen-Laakso T, Vapaatalo H, Orešič M, Korpela R. Elevated pro-inflammatory and lipotoxic mucosal lipids characterise irritable bowel syndrome. World J Gastroenterol 2009; 15(48): 6068-6074
- URL: https://www.wjgnet.com/1007-9327/full/v15/i48/6068.htm
- DOI: https://dx.doi.org/10.3748/wjg.15.6068


