©2009 The WJG Press and Baishideng.
World J Gastroenterol. May 14, 2009; 15(18): 2270-2276
Published online May 14, 2009. doi: 10.3748/wjg.15.2270
Published online May 14, 2009. doi: 10.3748/wjg.15.2270
Figure 1 Analysis of TSPAN1 and β-actin mRNA expression in 20 cases of colorectal adenocarcinoma.
TSPAN1 and β-actin mRNA expressions were detected in 20 cases of colorectal adenocarcinoma tissues by semi-quantitative RT-PCR. The upper bands were TSPAN1 and the lower bands were β-actin. Lane M: 200 ng of 1 kb size ladder (New England BioLabs); Lanes 1-20: Colorectal adenocarcinoma tissues.
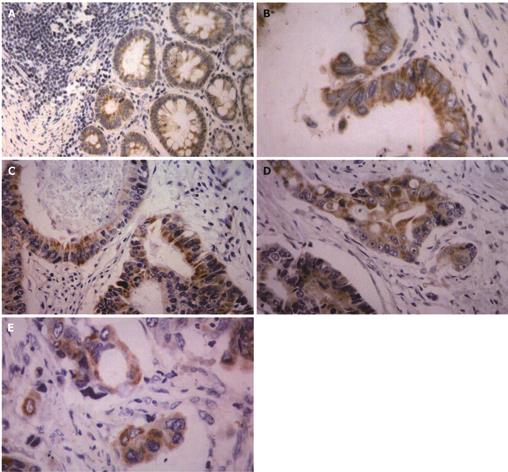
Figure 2 TSPAN1 expression in normal tissues (A), colon cancer tissues (B, C), rectal cancer tissues (D, E).
Paraffin section of human colorectal carcinoma tissues was stained with anti-TSPAN1 polyclonal antibody by immunohistochemistry. A: TSPAN1 weakly expressed in the cytoplasm. (× 100). B, C: TSPAN1 was located in the cytoplasm with yellow granulation. (× 200). D, E: Cancer nest showed positive TSPAN1 expression and vascular invasion. (× 200).
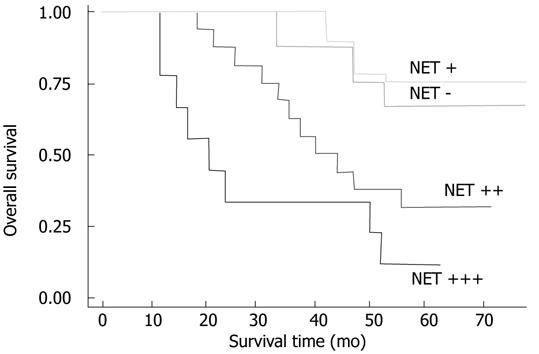
Figure 3 Overall 5-year survival curve of colorectal adenocarcinoma patients with TSPAN1 negative (-) and TSPAN1 positive (+, ++, +++) for the entire cohort (P = 0.
001) was estimated by Kaplan-Meier test. Survival rate in TSPAN1 expression groups (++, +++) were obviously lower than that of weak expression (+) or negative (-) group, respectively (P < 0.05). There was no significant difference of survival rates between TSPAN1 negative group (-) and TSPAN1 weak expression group (+).
- Citation: Chen L, Zhu YY, Zhang XJ, Wang GL, Li XY, He S, Zhang JB, Zhu JW. TSPAN1 protein expression: A significant prognostic indicator for patients with colorectal adenocarcinoma. World J Gastroenterol 2009; 15(18): 2270-2276
- URL: https://www.wjgnet.com/1007-9327/full/v15/i18/2270.htm
- DOI: https://dx.doi.org/10.3748/wjg.15.2270


