Copyright
©2008 The WJG Press and Baishideng.
World J Gastroenterol. Oct 28, 2008; 14(40): 6180-6187
Published online Oct 28, 2008. doi: 10.3748/wjg.14.6180
Published online Oct 28, 2008. doi: 10.3748/wjg.14.6180
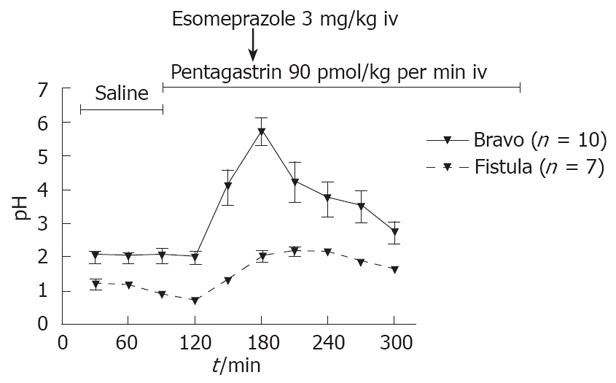
Figure 1 Change in pH ± SE in the Bravo system and gastric fistula model during fasting conditions after iv bolus of esomeprazole (3 mg/kg) and pentagastrin infusion (90 pmol/kg per min) for 2 h.
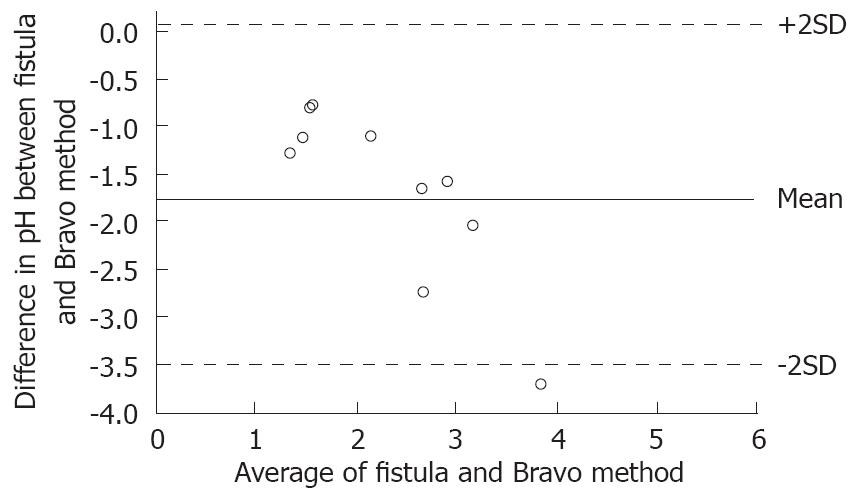
Figure 2 Bland-Altman analysis comparing the Bravo system with the fistula method.
Mean value -1.7 with 2SD from -3.5 to 0.12.
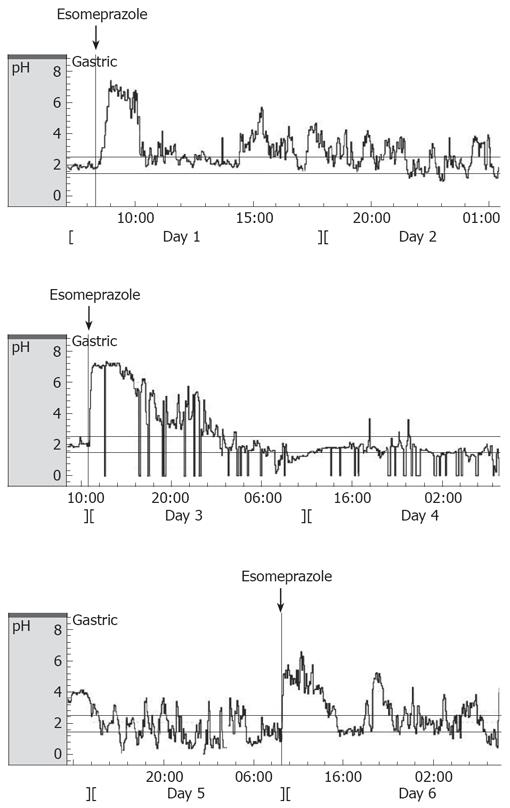
Figure 3 Standard recording with the Bravo system of intragastric pH in a rat during 6 d.
The solid line indicates bolus doses of esomeprazole (3 mg/kg) given iv during 3 min under fed conditions.
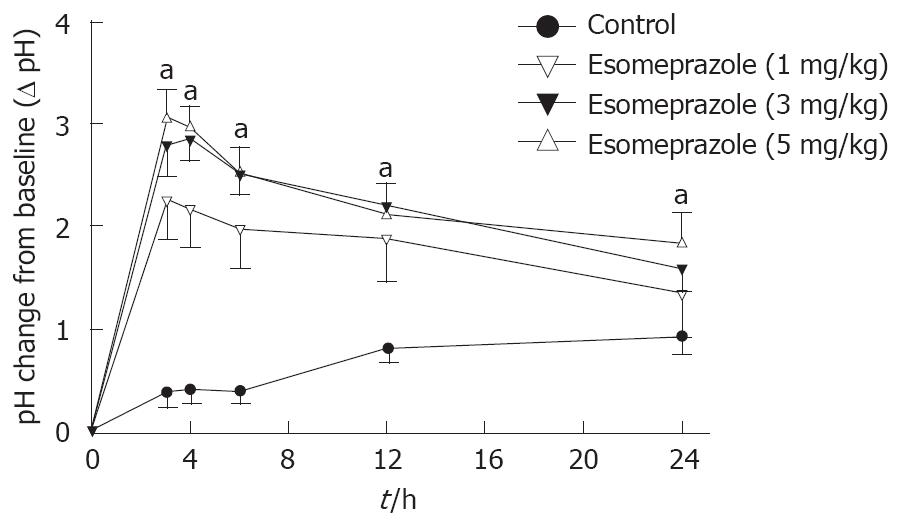
Figure 4 Change from baseline of intragastric pH ± SE after an iv bolus of esomeprazole in three different doses and saline studied for 24 h during fed conditions.
Mean for all doses vs control and for dose 1 mg/kg vs 5 mg/kg (aP < 0.05).
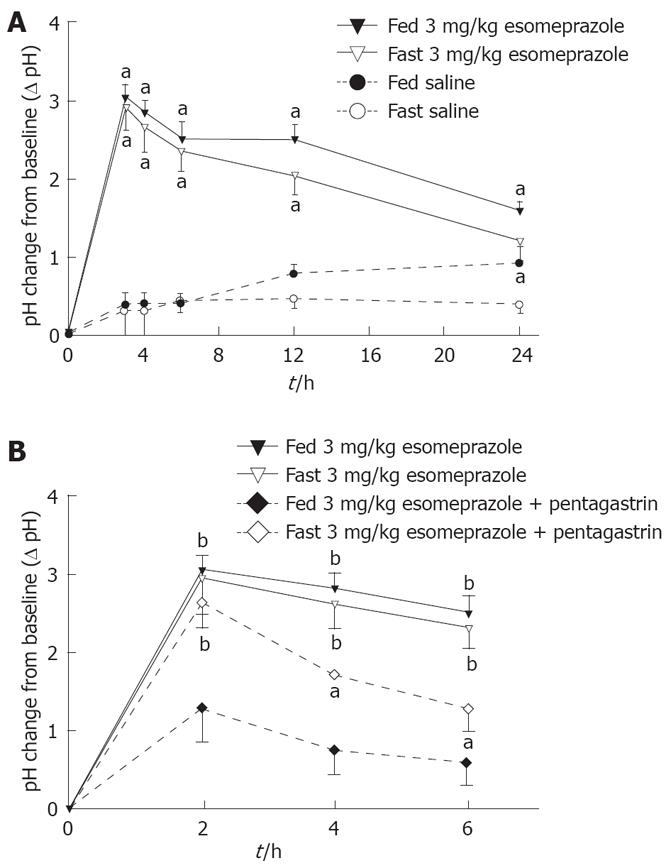
Figure 5 Changes of intragastric after an iv bolus of esomeprazole.
A: Change from baseline of intragastric pH ± SE after an iv bolus of esomeprazole (3 mg/kg) or saline during fed or fasting conditions for 24 h (aP < 0.05); B: Change form baseline of intragastric pH ± SE after an iv bolus of esomeprazole (3 mg/kg) or saline during pentagastrin (90 pmol/kg per min) infusion during fed or fasting conditions during 6 h. Mean esomeprazole vs esomeprazole and pentagastrin for fed (bP < 0.01). Mean esomeprazole fed vs fasting esomeprazole and pentagastrin (aP < 0.05). Mean esomeprazole fed vs fasting esomeprazole and pentagastrin (bP < 0.01).
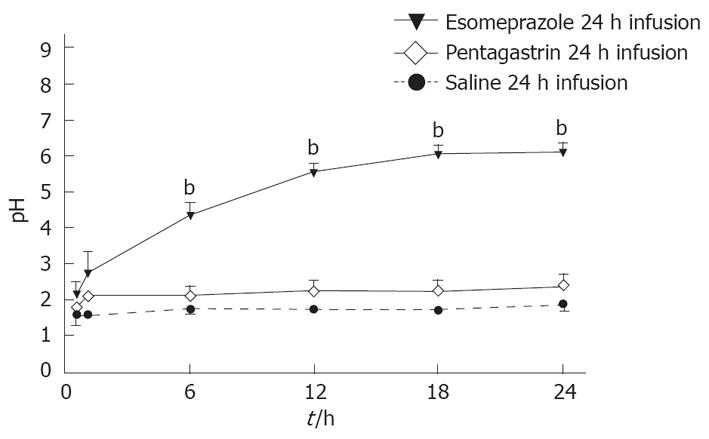
Figure 6 Change in mean pH ± SE over time.
Mean esomeprazole (9 pmol/kg per min) 24 h infusion and pentagastrin (90 pmol/kg per min) infusion. (bP < 0.01 vs control).
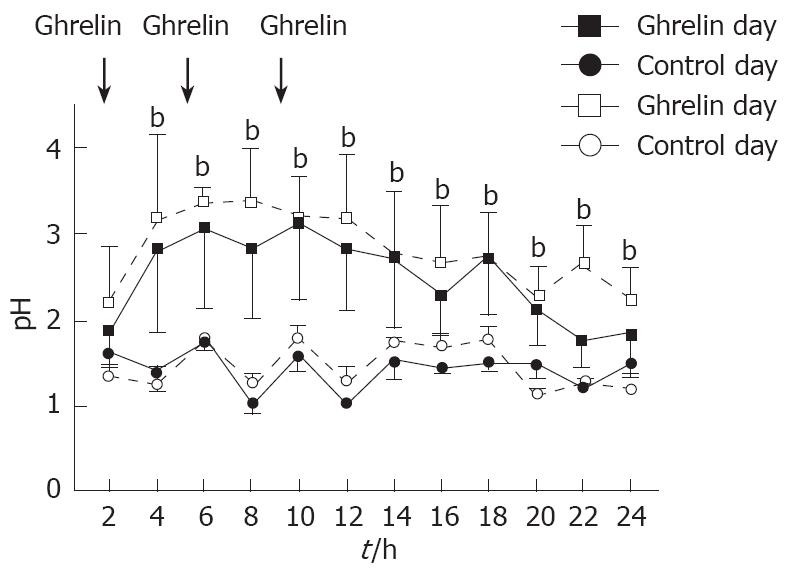
Figure 7 Change in mean pH ± SE during treatment with bolus dose ghrelin t.
i.d. (2400 pmol/kg, bP < 0.01 ghrelin vs control). There was no day-to-day difference in variation of the ghrelin response during the 5 d.
Figure 8 Gut peptide concentrations during treatment week 1 (W1) and week 2 (W2).
The two groups of animals (ntot = 10) were treated during one week with esomeprazole (3 mg/kg). After the first treatment week the first group (n = 5) were euthanaized and plasma were taken for peptide measurements. The other group (n = 5) went on for another week without any drug treatment and then euthanaized and plasma taken for analysis of peptides. aP < 0.05; bP < 0.01; cP < 0.001 vs control.
- Citation: Rudholm T, Hellström PM, Theodorsson E, Campbell CA, McLean PG, Näslund E. Bravo capsule system optimizes intragastric pH monitoring over prolonged time: Effects of ghrelin on gastric acid and hormone secretion in the rat. World J Gastroenterol 2008; 14(40): 6180-6187
- URL: https://www.wjgnet.com/1007-9327/full/v14/i40/6180.htm
- DOI: https://dx.doi.org/10.3748/wjg.14.6180


