Copyright
©2008 The WJG Press and Baishideng.
World J Gastroenterol. May 7, 2008; 14(17): 2748-2756
Published online May 7, 2008. doi: 10.3748/wjg.14.2748
Published online May 7, 2008. doi: 10.3748/wjg.14.2748
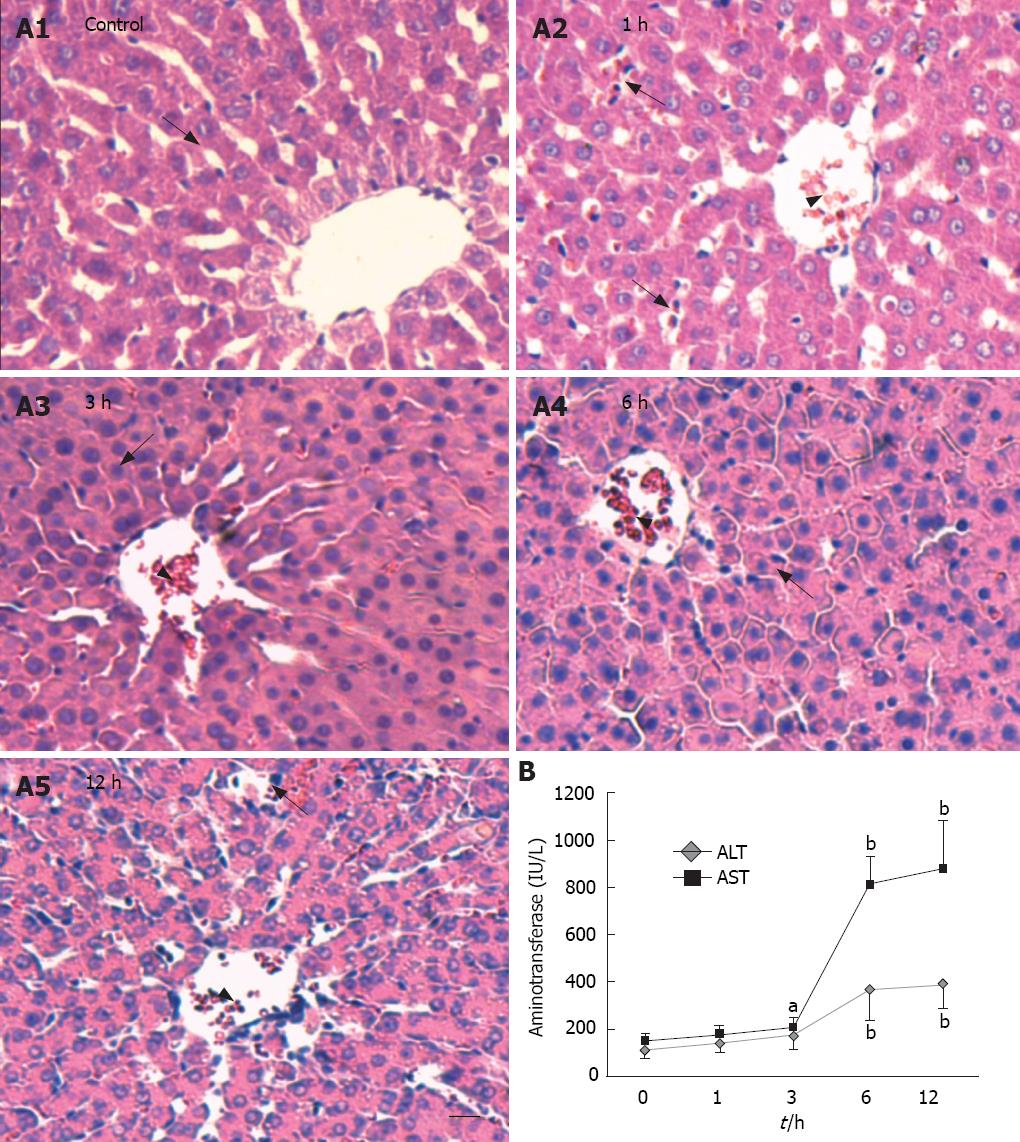
Figure 1 Histology and enzy-mology evaluation of rat livers treated with D-galactosamine/ lipopolysaccharide (D-GalN/LPS).
A: Histological examination of the liver at indicated times after GalN/LPS treatment (hematoxylin-eosin staining, bar = 100 &mgr;m). Arrow heads indicate congested central veins. The arrow in the control group A1 indicates cord-like arrangement of hepatocytes with clear nucleoli. The arrows in the 1 h group A2 indicate infiltrated inflammatory cells. The arrow in the 3 h group A3 indicates swollen hepatocytes. The arrow in the 6 h group A4 indicates disarranged hepatocytes. The arrow in the 12 h group A5 indicates massive necrosis and broken cytolemma; B: Time course of serum ALT and AST in rats received intraperitoneal injection of D-GalN/LPS. Data are represented as mean ± SD, n = 6, aP < 0.05 and bP < 0.01 vs control group.
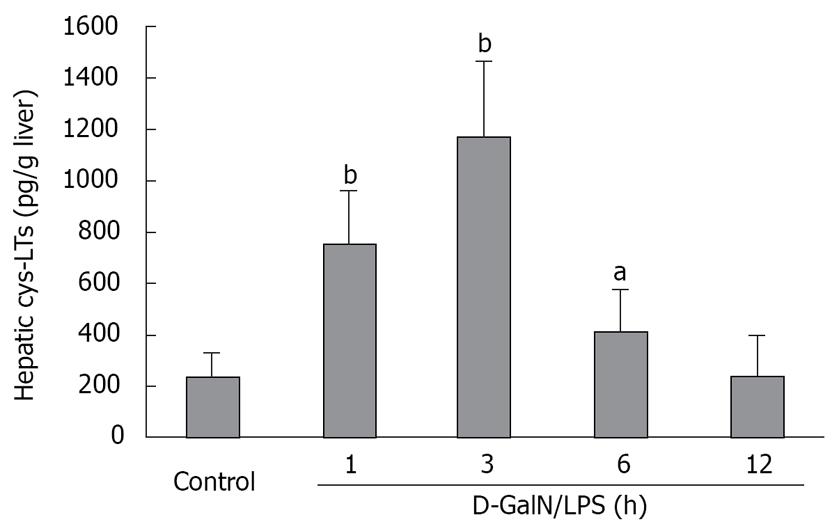
Figure 2 Time course of hepatic cys-LT content in D-GalN/LPS-injured rats.
Rats were treated with D-GalN/LPS as described. Cys-LT was quantified with an enzyme immunoassay kit which recognizes LTC4, LTD4 and LTE4 for a combined quantitative value. Each value represents the mean obtained from six rats in each group. aP < 0.05, bP < 0.01 vs control group.
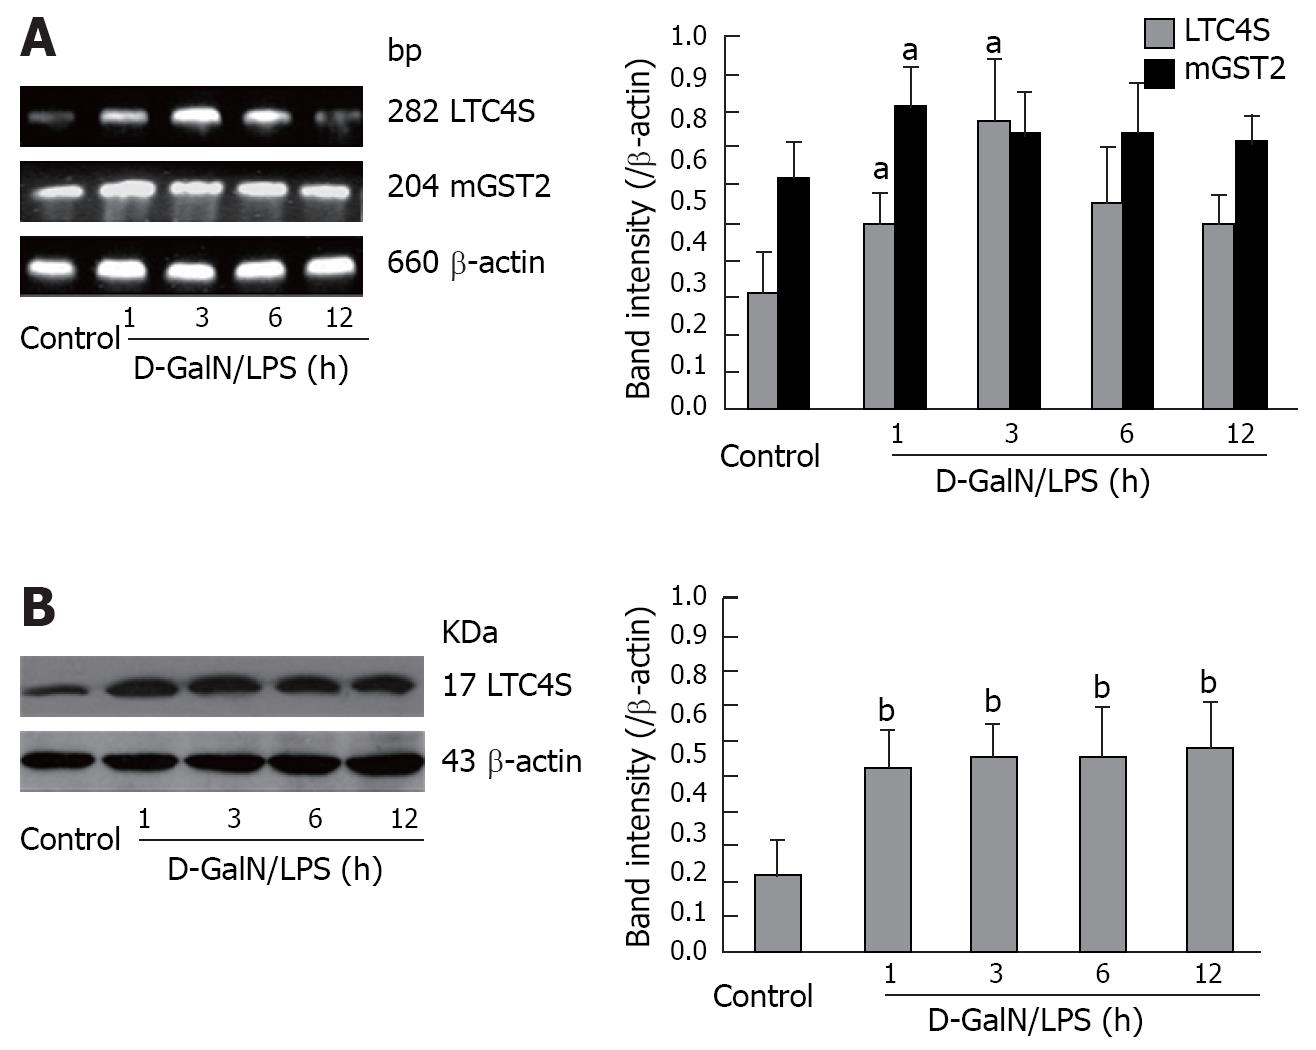
Figure 3 mRNA and protein expressions of LTC4S and mGST2 in D-GalN/LPS-treated liver tissues.
A: mRNA expression of LTC4S and mGST2 detected by RT-PCR. cDNA synthesized from total RNA (3 &mgr;g) was used for PCR amplification with 35 cycles for LTC4S and mGST2. PCR products were electrophoresed on a 1.5% agarose gel. The intensity of each band was quantified by computer-assisted densitometry, and the data were compared to those of the corresponding band of β-actin (Right panel); B: Protein expression of LTC4S detected by Western blotting. An aliquot of total protein (80 &mgr;g) was subjected to immunoblot analysis as described in Methods. Left panel: Immunoreactive bands corresponding to LTC4S and β-actin in D-GalN/LPS-injured liver; right panel: Densities of the products quantified by computer-assisted densitometry, and the data were normalized to β-actin expression. Data are represented as mean ± SD, aP < 0.05, bP < 0.01 vs control group.
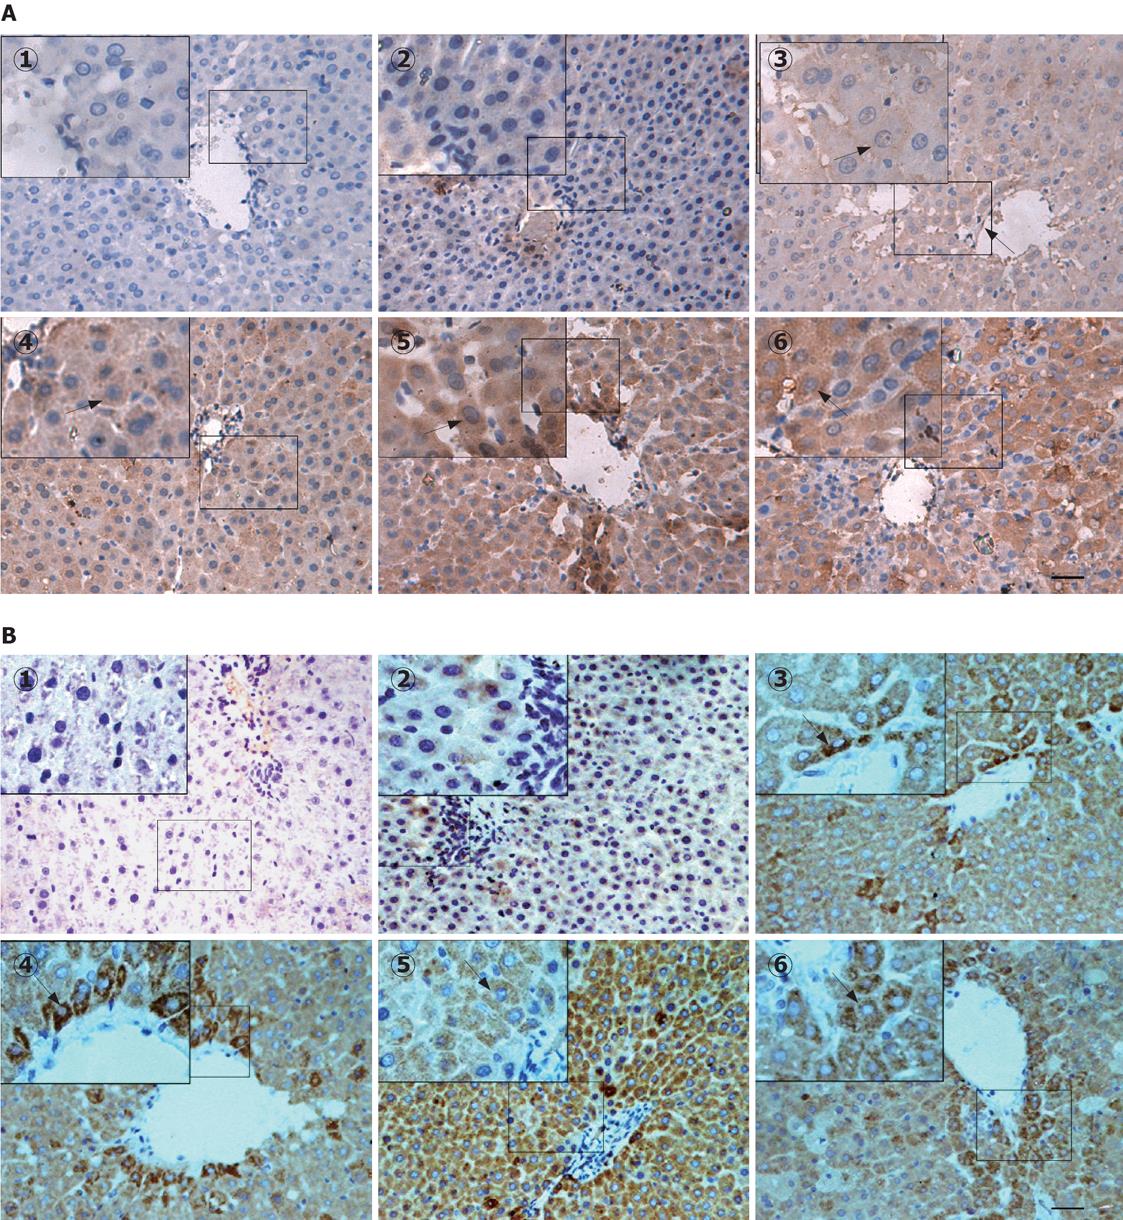
Figure 4 Immunohistochemical assay of the expression and localization of LTC4S (A) and mGST2 (B) in control and D-GalN/LPS-treated liver tissues.
Immunohistochemical staining for paraffin-embedded liver sections from the control and D-GalN/LPS-treated rats was examined as described in Materials and Methods. Arrows indicate the representative positive cells expressing the brown granules. 1: Absence of staining on omission of primary antibody; 2: Control; 3-6: Groups treated with D-GalN/LPS at 1, 3, 6 and 12 h, respectively. Bar = 100 &mgr;m.
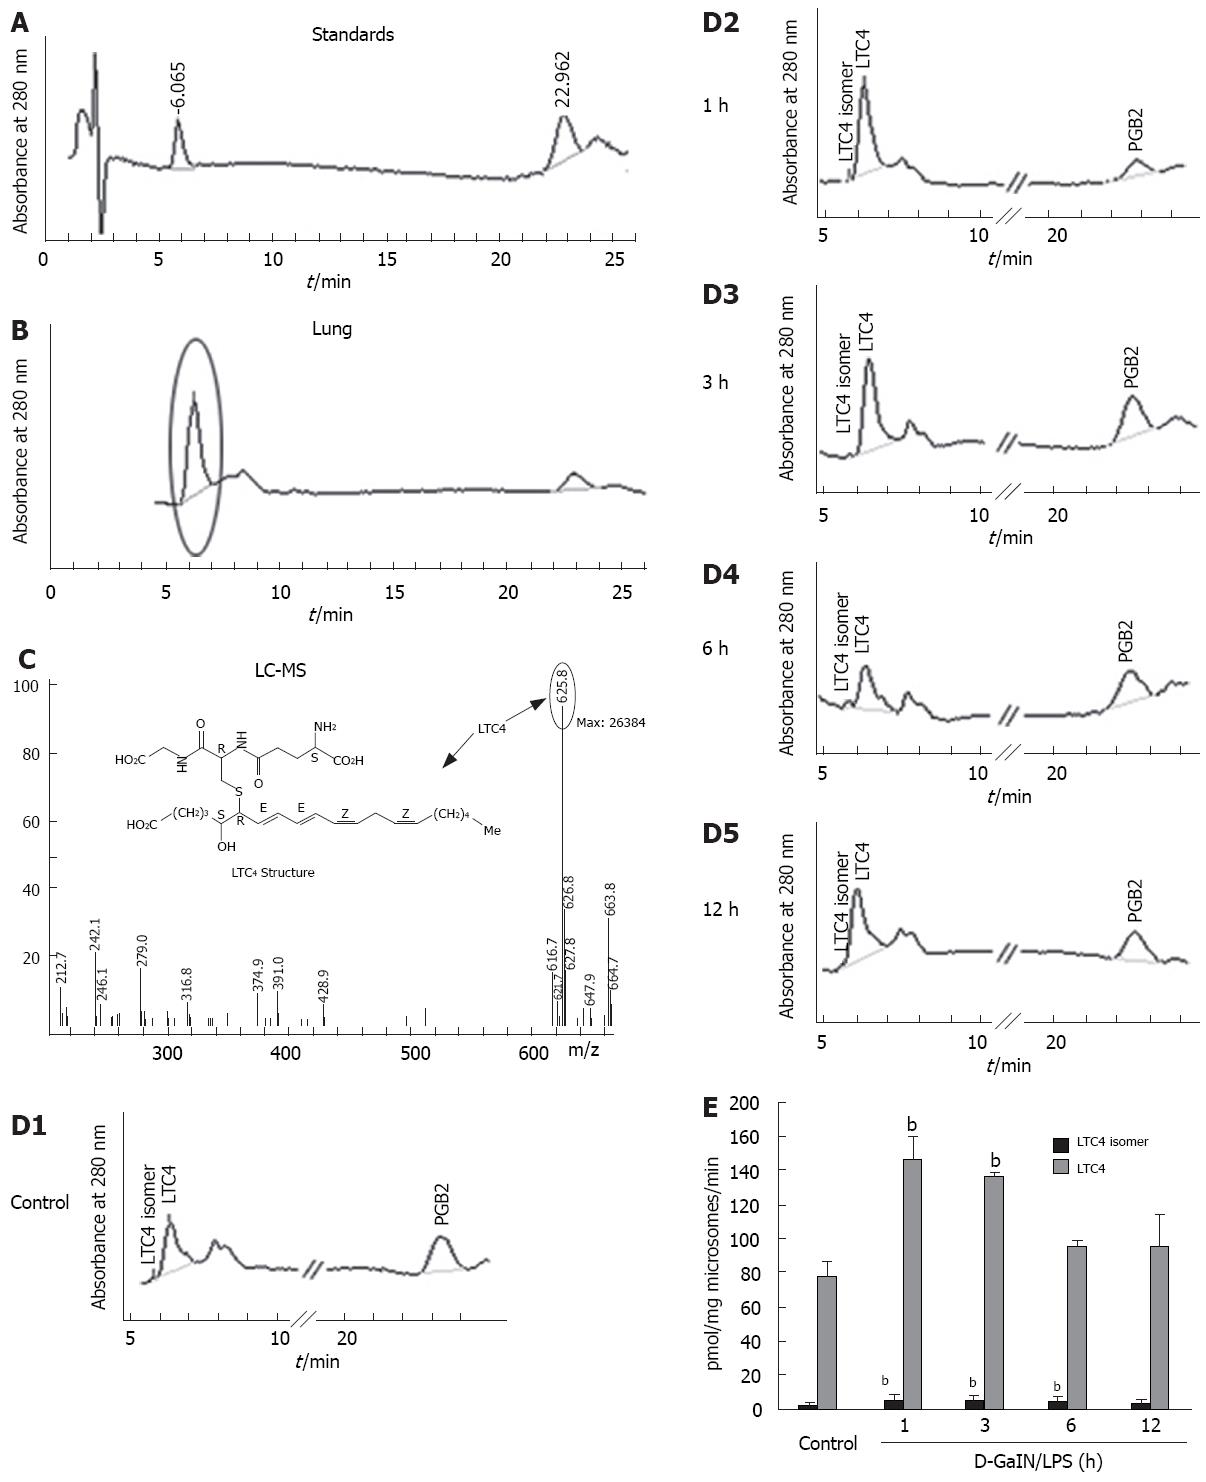
Figure 5 LTC4 synthesis enzyme activity in rat liver microsomal fraction.
A: HPLC traces showing standard LTC4 and internal standard PGB2; B: HPLC traces showing the main products when 100 000 × g pellets from lung incubated with LTA4 (60 &mgr;mol/L) and glutathione (10 mmol/L); C: MS assay of the product showing its peak at the retention time of 6.06 min in HPLC; D: HPLC traces showing generated LTC4 and isomer of LTC4 by a microsomal fraction from D-GalN/LPS treated rat livers with indicated times; E: The amount of generated LTC4 and isomer of LTC4 was calculated by an area peak compared with the internal standard PGB2 and then plotted. Each value represents the mean obtained from duplicate experiments with liver tissue from six rats in each group. aP < 0.05, bP < 0.01 vs control group.
- Citation: Ma KF, Yang HY, Chen Z, Qi LY, Zhu DY, Lou YJ. Enhanced expressions and activations of leukotriene C4 synthesis enzymes in D-galactosamine/lipopolysaccharide-induced rat fulminant hepatic failure model. World J Gastroenterol 2008; 14(17): 2748-2756
- URL: https://www.wjgnet.com/1007-9327/full/v14/i17/2748.htm
- DOI: https://dx.doi.org/10.3748/wjg.14.2748


