Copyright
©2007 Baishideng Publishing Group Co.
World J Gastroenterol. Feb 14, 2007; 13(6): 866-873
Published online Feb 14, 2007. doi: 10.3748/wjg.v13.i6.866
Published online Feb 14, 2007. doi: 10.3748/wjg.v13.i6.866
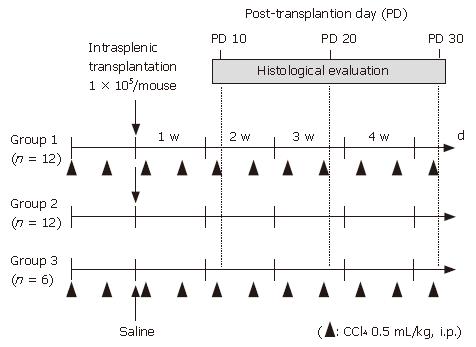
Figure 1 Grouping of experimental animals.
Female C57BL/6 mice were divided into 3 groups. Intraperitoneal injection of CCl4 at 0.5 mL/kg body weight was performed twice a week in group 1 mice (n = 12) and group 3 mice (n = 6), while 0.2 mL of saline was injected instead of CCl4 in group 2 mice (n = 12). One day after the second intraperitoneal injection of CCl4 or saline, 1 x 10⁵ GFP-positive undifferentiated ES cells (0.1 mL of 1 x 10⁶/mL solution) were transplanted into the spleens in groups 1 and 2, whereas no cell transplantation was performed with group 3.
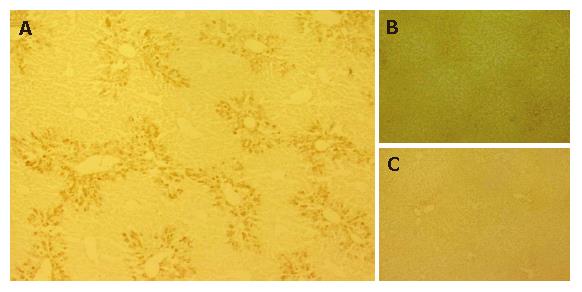
Figure 2 Migration of ES cells into CCl4-treated mouse livers.
GFP-immuno-positivity was examined in the liver specimens on PD 10. A: Immunoreactivity against GFP was clearly observed in the liver sections of Group 1 mice and GFP was predominantly distributed in the portal regions; B, C: No GFP-positive cells were detected in liver sections of group 2 (B) and group 3 mice (C).
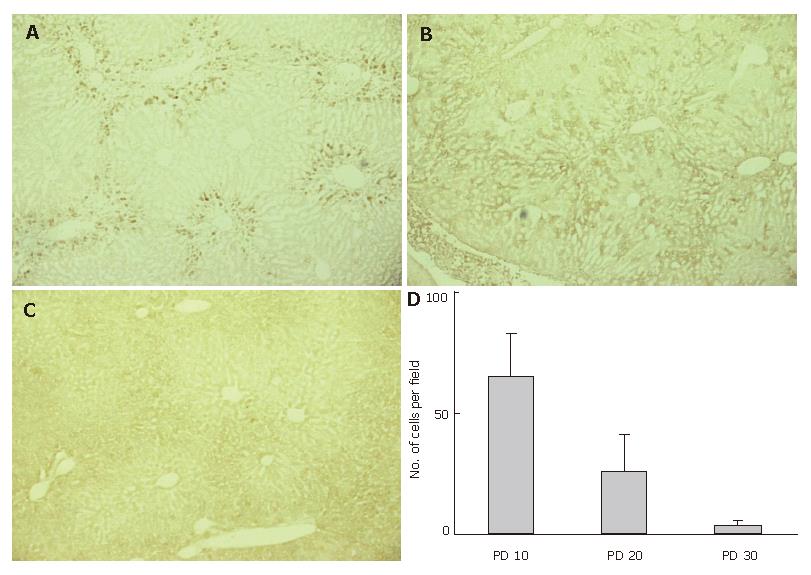
Figure 3 Disappearing GFP-immuno-positivity.
GFP-immuno-positivity on PD 10, 20, and 30 was examined using liver specimens from group 1 mice. A: GFP-immunoreactivity was clearly observed in the periportal regions on PD 10; B: GFP-immunoreactivity was still detected on PD 20, though the intensity was weaker than on PD 10. Cells presenting GFP-immunoreactivity were more inwardly distributed in the hepatic lobules, as compared to PD 10; C: Scant or no GFP-immuno-positivity was detected on PD 30; D: The average numbers of GFP-positive cells around the portal vein were determined after examining 10 microscopic fields in the periportal area at 400 x magnification.
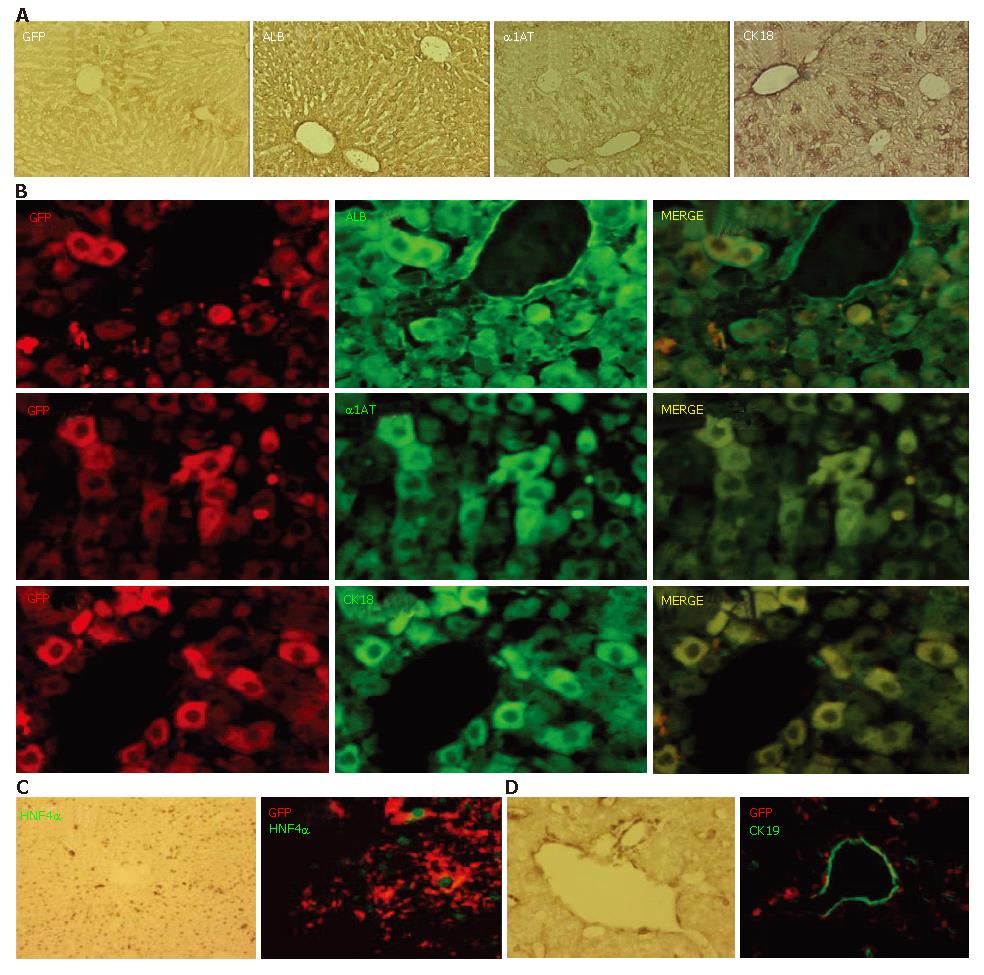
Figure 4 Expression of hepatocyte-related markers on GFP-positive cells.
A: Prior to conducting immunofluorescent studies, the expression of GFP, ALB, α1AT, and CK18 on PD 20 was examined using a conventional method; B, C: Double immunofluorescent studies on PD 20 demonstrated that most of the GFP-immuno-positive cells expressed ALB, α1AT, and CK18; C: Expression of HNF4α was confirmed in the GFP-immuno-positive cells; D: There were no CK19-positive ES-derived cells.
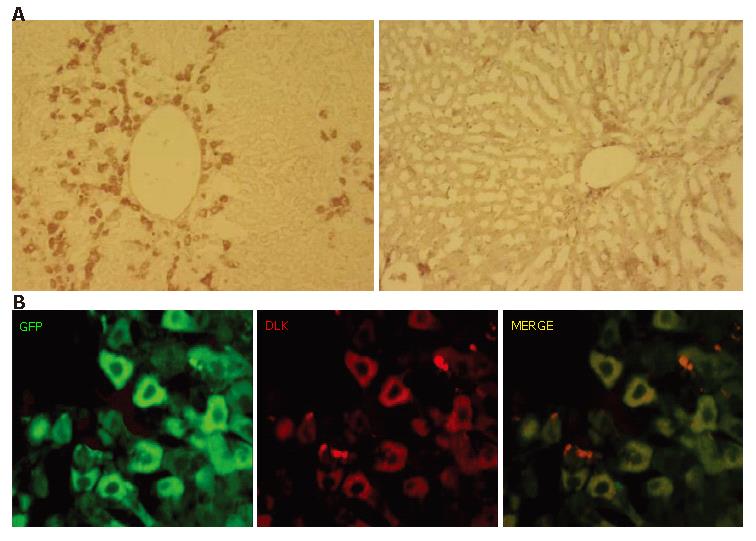
Figure 5 Expression of hepatoblast marker DLK on GFP-positive cells.
A: DLK-immuno-positivity was examined on PD 10 (left) and PD 20 (right). A number of cells showed immunoreactivity against DLK on PD 10, whereas there were few on PD 20; B: Most of GFP-immunopositive cells on PD 10 were positive for DLK.S.
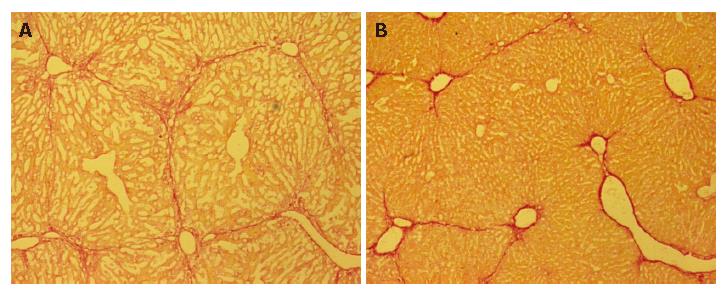
Figure 6 Decreased fibrosis after ES transplantation.
Liver fibrosis was histologically evaluated on PD 30 using picro-Sirius red staining. Representative liver histology results for group 3 (A) and group 1 (B) mice. Decreased fibrosis was observed in group 1 mice, as compared to those in group 3.
- Citation: Moriya K, Yoshikawa M, Saito K, Ouji Y, Nishiofuku M, Hayashi N, Ishizaka S, Fukui H. Embryonic stem cells develop into hepatocytes after intrasplenic transplantation in CCl4-treated mice. World J Gastroenterol 2007; 13(6): 866-873
- URL: https://www.wjgnet.com/1007-9327/full/v13/i6/866.htm
- DOI: https://dx.doi.org/10.3748/wjg.v13.i6.866


