Copyright
©2006 Baishideng Publishing Group Co.
World J Gastroenterol. Dec 28, 2006; 12(48): 7768-7773
Published online Dec 28, 2006. doi: 10.3748/wjg.v12.i48.7768
Published online Dec 28, 2006. doi: 10.3748/wjg.v12.i48.7768
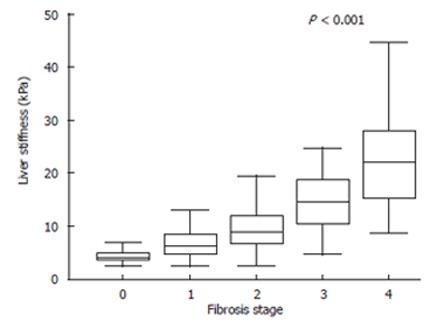
Figure 1 Liver stiffness measurements for each fibrosis stage.
Fibrosis stage 0 is offered to the control group. The top and bottom of the boxes are the 1st and 3rd quartiles. The length of the box thus represents the interquartile range (IQR) within which 50% of values are located. The lines through the middle of the boxes represent the median. The error bars represent the minimum and maximum values (measurement range). Significant correlation was found between stage of fibrosis and liver stiffness (P < 0.001, Kruaskal-wallis test).
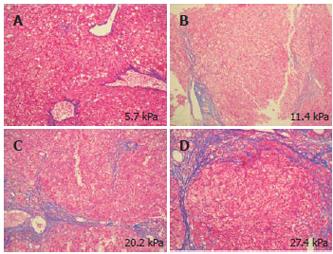
Figure 2 Azan-Mallory-stained liver tissue and liver stiffness measurement.
A and B: stage 1 liver tissue samples, showing that the grade of fibrosis and elasticity was higher for B than for A; C: stage 3 liver tissue sample; D: stage 4 liver tissue sample. The elasticity thus increased as the fibrosis progressed.
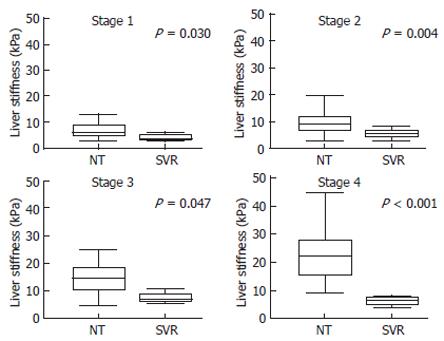
Figure 3 Liver stiffness measurements for each fibrosis stage in the patients not treated with IFN and the patients with sustained response for IFN therapy.
Fibrosis stage 0 indicates the control group. The top and bottom of the boxes are the 1st and 3rd quartiles. The length of the box thus represents the interquartile range (IQR) within which 50% of values are located. The lines through the middle of the boxes represent the median. The error bars represent the minimum and maximum values (measurement range). In each stage, liver stiffness differed between NT and SVR. At each stage of fibrosis, elasticity was significantly lower in SVR than in HCV RNA-positive cases without IFN therapy (NT). NT: Patients without IFN therapy; SVR: Patients with sustained viral response to IFN therapy.
Figure 4 Correlation between liver stiffness and serum fibrosis markers.
Correlations between elasticity measured by the Fibroscan502 and HA (A), type IV collagen (B), IV collagen 7S (C), and P-III-P (D) are indicated. HA: Hyaluronic acid; P-III-P: Type III procollagen N peptide.
- Citation: Takeda T, Yasuda T, Nakayama Y, Nakaya M, Kimura M, Yamashita M, Sawada A, Abo K, Takeda S, Sakaguchi H, Shiomi S, Asai H, Seki S. Usefulness of noninvasive transient elastography for assessment of liver fibrosis stage in chronic hepatitis C. World J Gastroenterol 2006; 12(48): 7768-7773
- URL: https://www.wjgnet.com/1007-9327/full/v12/i48/7768.htm
- DOI: https://dx.doi.org/10.3748/wjg.v12.i48.7768


