Copyright
©2006 Baishideng Publishing Group Co.
World J Gastroenterol. Nov 21, 2006; 12(43): 6998-7006
Published online Nov 21, 2006. doi: 10.3748/wjg.v12.i43.6998
Published online Nov 21, 2006. doi: 10.3748/wjg.v12.i43.6998
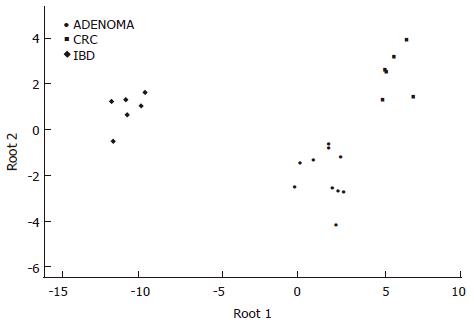
Figure 1 Discriminant analysis of colonic biopsy specimens.
Note the clear separation of the single classification groups based on the discriminatory genes detailed in the results section.
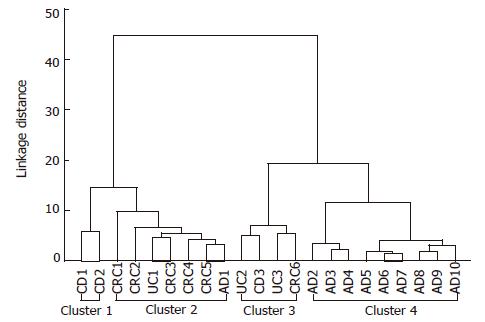
Figure 2 Tree diagram for 22 colonic diseases (Ward's method euclideandistances).
Four different clusters can be identified: 1 and 3 are IBD-related clusters containing one CRC case; 2 is a carcinoma group containing one adenoma and one ulcerative colitis cases; 4 is an adenoma cluster with nine adenoma cases. AD: Adenoma; CD: Crohn’s disease; CRC: Colorectal cancer; UC: Ulcerative colitis.
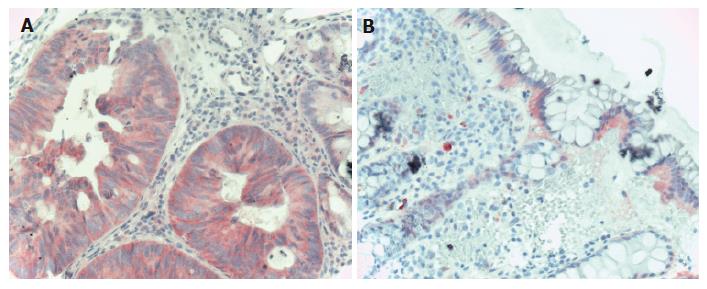
Figure 3 EGFR immunohistochemistry in CRC.
A: Carcinomatous glands of the colon showing diffuse cytoplasmatic, moderately intensive EGFR staining (Hematoxylin co-staining × 200); B: Normal colonic epithelia showing mildly, moderately intensive basolateral intracytoplasmatic EGFR staining. The lower 2/3 of the crypts do not show EGFR positivity (Hematoxylin co-staining × 100).
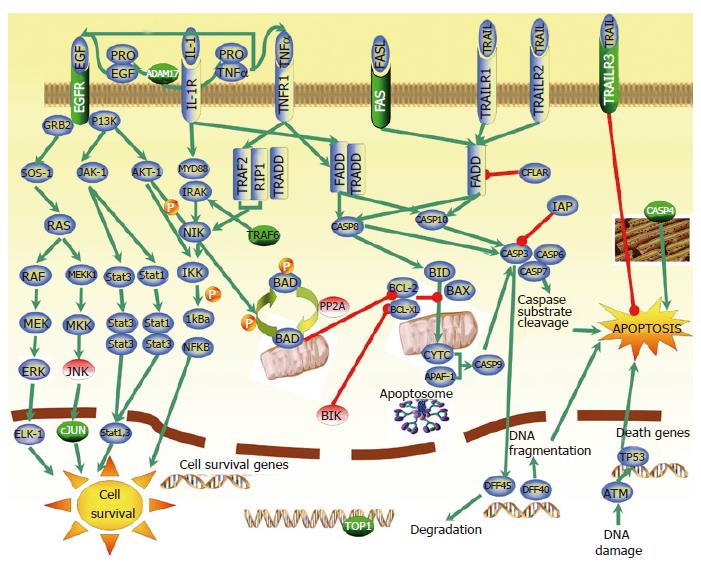
Figure 4 The main apoptotic and cell survival pathways identified in CRC gene expression study.
Genes marked with green were found to be overexpressed, while genes marked with red were found to be underexpressed in our microarray analysis. Genes in blue are previously described as apoptotic and cell survival pathways-related genes. Green arrows refer to the positive regulation, while reds mean negative regulation (inhibition).
- Citation: Galamb O, Sipos F, Dinya E, Spisak S, Tulassay Z, Molnar B. mRNA expression, functional profiling and multivariate classification of colon biopsy specimen by cDNA overall glass microarray. World J Gastroenterol 2006; 12(43): 6998-7006
- URL: https://www.wjgnet.com/1007-9327/full/v12/i43/6998.htm
- DOI: https://dx.doi.org/10.3748/wjg.v12.i43.6998


