Copyright
©2006 Baishideng Publishing Group Co.
World J Gastroenterol. Sep 14, 2006; 12(34): 5483-5489
Published online Sep 14, 2006. doi: 10.3748/wjg.v12.i34.5483
Published online Sep 14, 2006. doi: 10.3748/wjg.v12.i34.5483
Figure 1 Tg-induced intracellular calcium ion concentration changes in 3T3 cells.
A: The fluorescent intensity in 3T3 cells was 25-30 in Ca2+-free and 2 mmol/L EGTA-containing medium after treatment with 4 μmol/L Tg; B: The fluorescent intensity rose to 50-55 in 3T3 cells after adding 2 mmol/L CaCl2; C: Similar intracellular free Ca2+ concentration dynamic changes in 3T3 cells and Tg-induced elevation of [Ca2+]i in 3T3 cells 120 min after treatment.
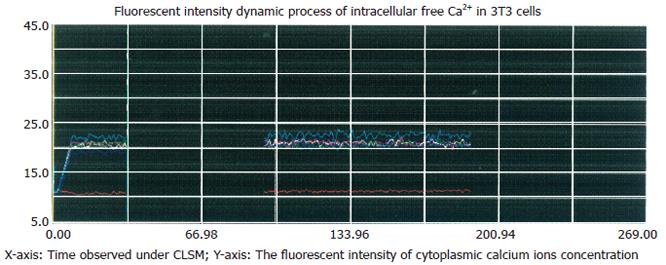
Figure 2 Inhibitory effect of Ni2+ on thapsigargin-induced rise in [Ca2+]i.
The cells were incubated in NPBS with 4 μmol/L thapsigargin and 3 mmol/L NiCl2 for 90 s, then the media were replaced with respective media containing 2 mmol/L CaCl2 without EGTA, no significant change of [Ca2+]i occurred after 120 s.
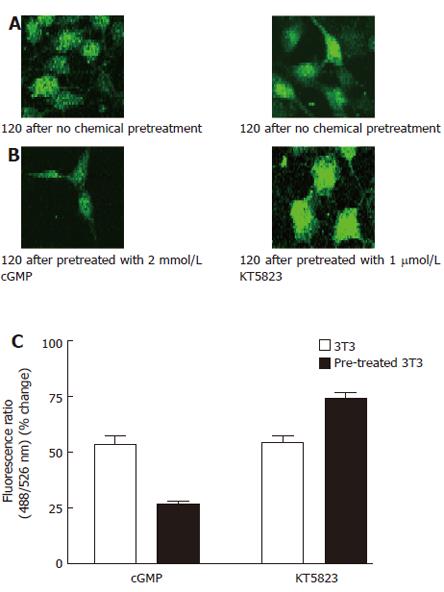
Figure 3 Effect of 8-bromo-cGMP and KT5823 on thapsigargin-induced Ca2+ influx.
A: 3T3 cells were incubated in NPBS with 4 μmol/L thapsigargin for 2 min, then 2 mmol/L CaCl2 was added into the medium; B: 3T3 cells were incubated in NPBS with 4 μmol/L thapsigargin for 2 min, 8-bromo-cGMP(2 mmol/L) or KT5823 (1 μmol/L) was introduced 1 min prior to the measurement, then 2 mmol/L CaCl2 was added into the medium; C: Effects of cGMP and KT5823 on thapsigargin-induced Ca2+ influx.. The Ca2+ entry fluorescence ratios were obtained in cells without chemical treatment (control) or treated with 2 mmol/L 8-Br-cGMP (cGMP) or 1 μmol/L KT5823. The cells were incubated in NPBS with 4 μmol/L thapsigargin for 2 min prior to the chemical treatment. One mmol/L CaCl2 was introduced to the medium to obtain the fluorescent signal of Ca2+ entry. The values are the mean ± SE (n = 4-6).
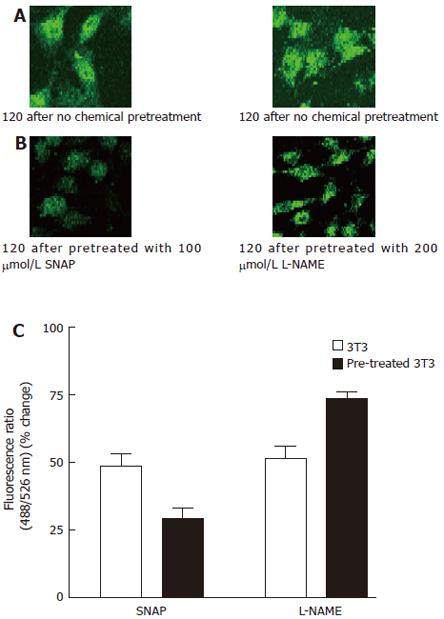
Figure 4 Effect of SNAP and L-NAME on thapsigargin-induced Ca2+ influx.
A: 3T3 cells were incubated in NPBS with 4 μmol/L thapsigargin for 2 min, then 2 mmol/L CaCl2 was added into the medium; B: 3T3 cells were incubated in NPBS with 4 μmol/L thapsigargin for 2 min, 100 μmol/L SNAP or 200 μmol/L L-NAME was introduced 1 min prior to the measurement, then 2 mmol/L CaCl2 was added into the medium; C:.Ca2+ entry fluorescence ratios were obtained in cells without chemical treatment (control) or treated with 100 μmol/L SNAP or 200 μmol/L L-NAME. The values are the mean ± SE (n = 4-6).
Figure 5 Expression of MMP in pretreated and not pretreated 3T3 cells.
A: RT-PCR results of MMP-2 mRNA in both cells (1: DL2000 marker; 2: MMP-2 cDNA of 3T3 cells; 3: MMP-2 cDNA of 8-Br-cGMP (2 mmol/L) pre-treated 3T3 cells; 4: β-actin cDNA of 3T3 cells; 5: β-actin cDNA of pre-treated 3T3 cells); B: RT-PCR results of MMP-9 mRNA in pretreated and not pretreated 3T3 cells (1: DL2000 marker; 2: MMP-9 cDNA of 3T3 cells; 3: MMP-9 cDNA of 8-Br-cGMP (2 mM) pre-treated 3T3cells; 4: β-actin cDNA of 3T3 cells; 5: β-actin cDNA of pre-treated 3T3 cells); C: Gelatin zymography showing constitutive secretion of MMP-2 (72 kDa) and MMP-9 (92 kDa) into serum-free media by pretreated and not pretreated 3T3 cells.
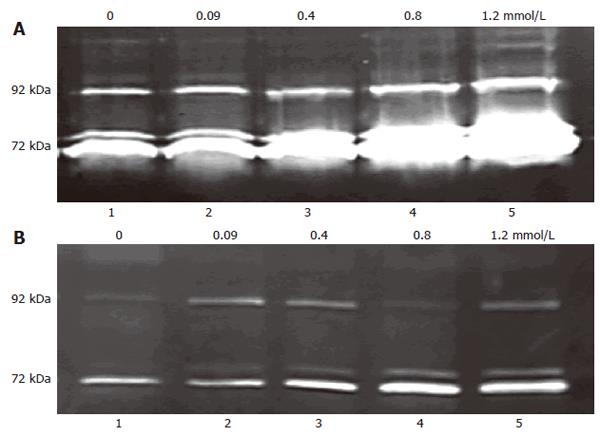
Figure 6 Dose-dependent effect of extracellular Ca2+ on MMP release.
8-bromo-cGMP (2 mmol/L) pre-treated and not pretreated 3T3 cells were plated in media with serial doses of Ca2+ (0, 0.09 ,0.4, 0.8, 1.2 mmol/L) and incubated for 16-18 h, 200 μL conditioned media was used as sample. The 72 kDa gelatinolytic bands corresponded to the MMP-2, the 92 kDa band to MMP-9. A: 3T3 cell mean ratio of 72 kDa in groups 1-5 was 0.198 ± 0.094, 0.287 ± 0.114, 0.486 ± 0.079, 1.247 ± 0.089 and 2.487 ± 0.179, respectively (n = 4-6); B: 8-bromo-cGMP (2 mmol/L) pre-treated 3T3 cell mean ratio of 72 kDa in groups 1-5 was 0.104 ± 0.084, 0.126 ± 0.086, 0.257 ± 0.102, 0.490 ± 0.173 and 0.784 ± 0.187, respectively (n = 4-6).
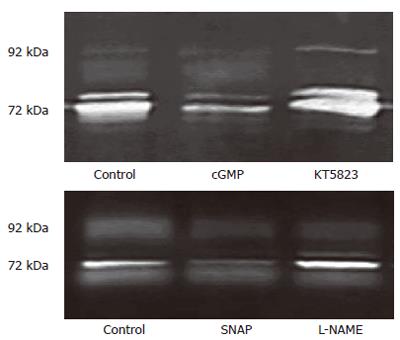
Figure 7 cGMP/KT5823 and SNAP/L-NAME affecting MMP release 3T3 cells via Tg-induced SOC.
3T3 cells were incubated in NPBS with 4 μmol/L thapsigargin for 2 min. Each kind of chemical reagents (2 mmol/L cGMP, 1 μmol/L KT5823, 100 μmol/L SNAP or 200 µmol/L L-NAME) was introduced 1 min prior to the measurement, then 2 mmol/L CaCl2 was added into each medium and incubated for 16-18 h. The 72 kDa gelatinolytic band (MMP-2) was obtained in cells without chemical treatment (control) or treated with cGMP, KT5823, SNAP, L-NAME.
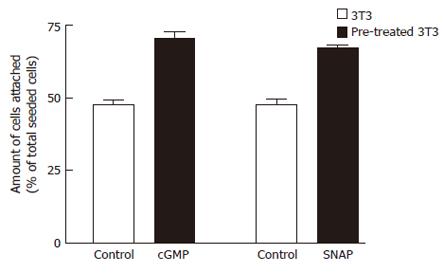
Figure 8 Effects of cGMP or SNAP on adhesion potentials of 3T3 cells to matrigel by adhesion assay.
3T3 cells pretreated with 4 μmol/L Tg were suspended in serum-free medium supplemented with no chemical reagent (control) or cGMP (2 mmol/L) or SNAP (200 μmol/L), 2 mmol/L CaCl2 was added to induce SOC, then seeded into the matrigel (5 mg/L)-coated wells. After incubation for 30 min at 37°C, the percentage of adhered cells was determined using colorimetric crystal violet assay. The values are the mean ± SE (n = 6-8).
- Citation: Huang Y, Lu MQ, Li H, Xu C, Yi SH, Chen GH. Occurrence of cGMP/nitric oxide-sensitive store-operated calcium entry in fibroblasts and its effect on matrix metalloproteinase secretion. World J Gastroenterol 2006; 12(34): 5483-5489
- URL: https://www.wjgnet.com/1007-9327/full/v12/i34/5483.htm
- DOI: https://dx.doi.org/10.3748/wjg.v12.i34.5483


