Copyright
©2006 Baishideng Publishing Group Co.
World J Gastroenterol. Jul 7, 2006; 12(25): 4044-4048
Published online Jul 7, 2006. doi: 10.3748/wjg.v12.i25.4044
Published online Jul 7, 2006. doi: 10.3748/wjg.v12.i25.4044
Figure 1 A: Schematic map of protein distribution on the protein array.
Four squares were involved and different proteins were printed in different areas: UreB in upper left area; VacA in upper right area; CagA in left bottom area; R.M (10 ng) in the upper row of right bottom area for negative control (Ctrl), H. IgG in the middle row for positive control and at the bottom row for strong positive control; B: positive results of anti-UreB IgG, anti-CagA IgG and anti-VacA IgG detected by the protein array.
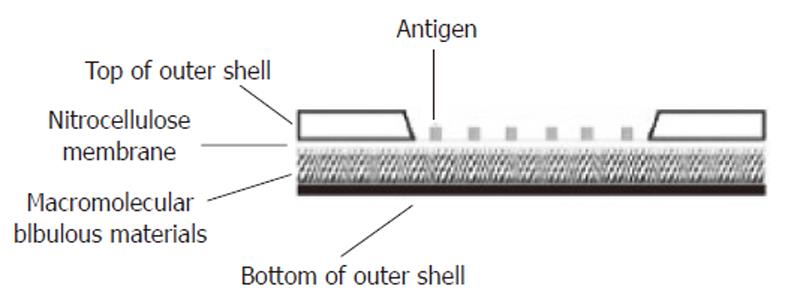
Figure 2 Longitudinal section of the protein array apparatus.
The shell of the apparatus was made of plastic materials. A window was opened on the top of the outer shell and the margin of the nitrocellulose membrane printed with antigens was sealed to the inner surface of the window. Under the nitrocellulose membrane was the macromolecular bibulous material.
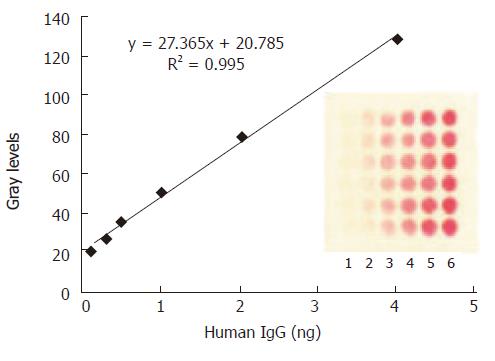
Figure 3 The mean grey level of the spot against various amount of H.
IgG immobilized on the protein array. The concentrations of human IgG spotted from lane 1 to lane 6 are as follows: 1.25, 2.5, 5, 10, 20, 40 μg/mL. The optimized amount of SPA binding to colloid gold was 12 μg/mL. The data in the plot were obtained from the image of CCD by averaging the mean grey levels of the 6 replicate spots.
-
Citation: Han FC, Li XJ, Jiang H, Qin LP, Li D, Guo YH, Liu ZG, Zhang L, Yan XJ. Detection of
H pylori antibody profile in serum by protein array. World J Gastroenterol 2006; 12(25): 4044-4048 - URL: https://www.wjgnet.com/1007-9327/full/v12/i25/4044.htm
- DOI: https://dx.doi.org/10.3748/wjg.v12.i25.4044


