Copyright
©2006 Baishideng Publishing Group Co.
World J Gastroenterol. May 14, 2006; 12(18): 2846-2857
Published online May 14, 2006. doi: 10.3748/wjg.v12.i18.2846
Published online May 14, 2006. doi: 10.3748/wjg.v12.i18.2846
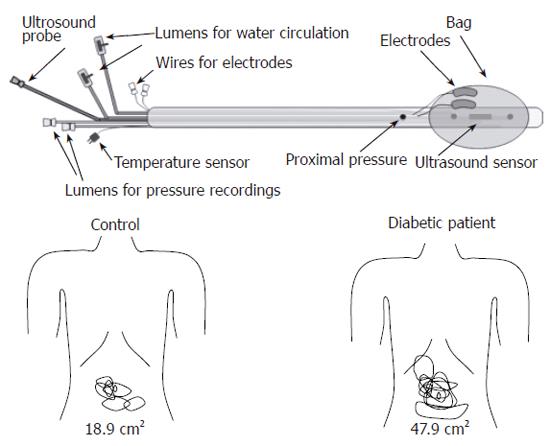
Figure 1 Top: The probe design allowing mechanical, heat and electrical stimulation of both the oesophagus and duodenum.
The centre of the bag contains the sensor of the ultrasound probe imaging the oesophagus and duodenum during mechanical distension. The thermal stimuli were given by a pump system, which re-circulates water at 60 °C through two channels in the probe. The electrodes allowed electrical stimulation delivered directly to the mucosal surface. Bottom: The somatic referred pain areas to mechanical distension of the duodenum for the controls (left) and diabetic patients (right). The areas were larger for the diabetic patients.
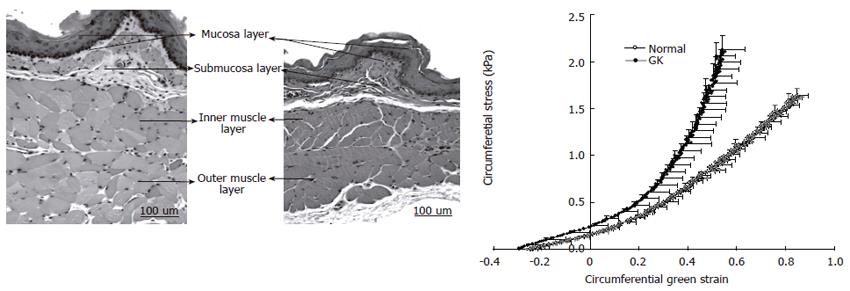
Figure 2 Microphotos of esophageal layer thickness in GK rats (left) and normal rats (middle).
The muscle layer was biggest in the GK esophagus. Correspondingly the circumferential stress-strain curves of diabetic and non-diabetic esophageal wall showed in the right. The curve in the GK rats was shifted to the left, indicating that the esophageal wall stiffness increased.
Figure 3 Left: Cross-sectional ultrasound image of the distended distal esophagus allows identification of the esophageal layers, i.
e. mucosa-submucosa, muscle and adventitia layers. The white round shadow in the center is caused by the intraluminal ultrasound probe. Right: The distension-induced change in longitudinal stretch ratio is illustrated as function of the esophageal radius. The curves were obtained during smooth muscle relaxation with butylscopolamine. Exponential trend lines of the patients and controls are shown. The shortening during distension was clearly reduced in the diabetic patients.
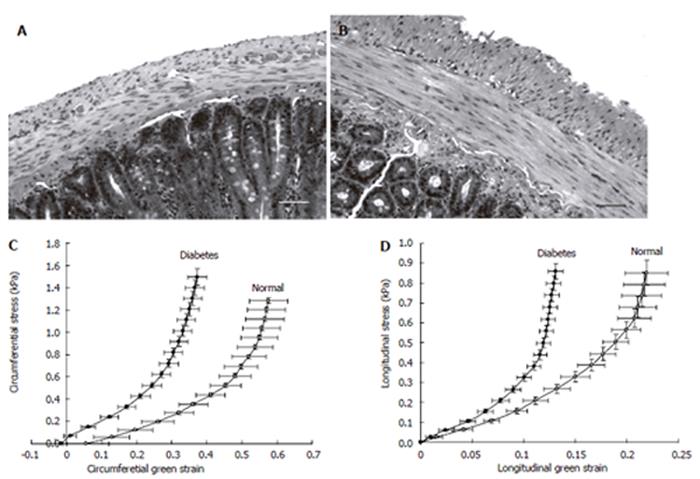
Figure 4 The micro-photographs show the normal (A) and 4 wk STZ-induced diabetic (B) duodenal histological sections.
It clearly demonstrates that the muscle and submucosa layers in the diabetic duodenum became much thicker than in the normal duodenum. The bar is 100 μm. Correspondingly, the circumferential (C) and longitudinal (D) stress-strain relation curves of the duodenum in the STZ-induced diabetic rats shifted to the left indicating the wall became stiffer.
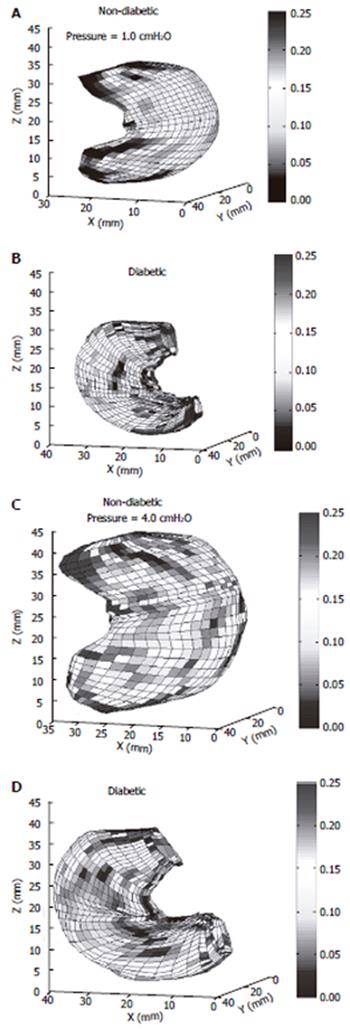
Figure 5 The circumferential curvature at the distension pressure of 1.
0 (A,B) and 4.0 (C,D) cmH2O in the non-diabetic (A,C) and the diabetic stomach (B,D). The circumferential deformation of the stomach in the non-diabetic rats was significantly bigger than that in the diabetic Goto-Kakizaki (GK) rats, indicating the stiffness of the diabetic gastric wall increased in the diabetic GK rats.
- Citation: Zhao JB, Frøkjær JB, Drewes AM, Ejskjaer N. Upper gastrointestinal sensory-motor dysfunction in diabetes mellitus. World J Gastroenterol 2006; 12(18): 2846-2857
- URL: https://www.wjgnet.com/1007-9327/full/v12/i18/2846.htm
- DOI: https://dx.doi.org/10.3748/wjg.v12.i18.2846


