Copyright
©The Author(s) 2005.
World J Gastroenterol. Jul 28, 2005; 11(28): 4332-4336
Published online Jul 28, 2005. doi: 10.3748/wjg.v11.i28.4332
Published online Jul 28, 2005. doi: 10.3748/wjg.v11.i28.4332
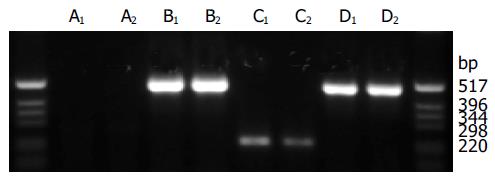
Figure 1 (PDF) Gene expression of sFlt1-3 in vitro.
RT-PCR was performed with A549 cells infected with AdsFlt1-3 or AdlacZ. Specific primer pairs for sFlt1-3 resulted in bands of about 250 bp (C1 and C2), whereas no bands were detectable in the negative control AdLacZ (A1 and A2). Expression of the house keeping gene b-actin (514 bp) was similar for AdLacZ (B1 and B2) and AdsFlt1-3 (D1 and D2).
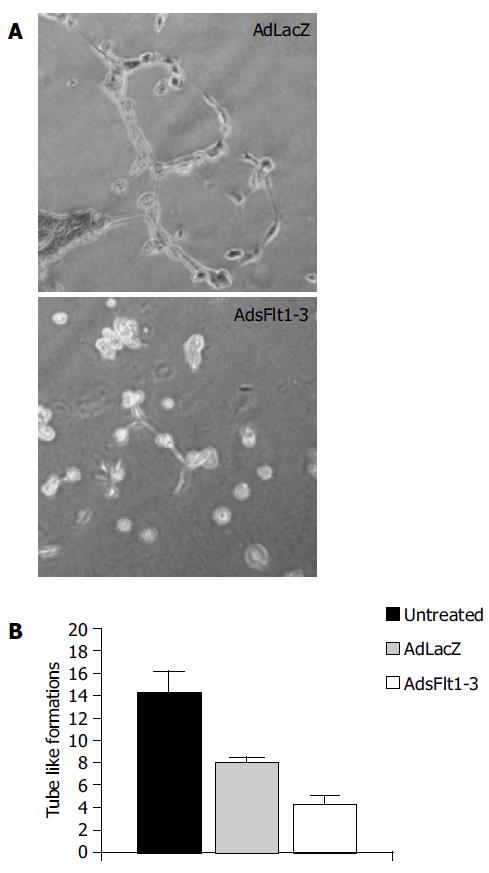
Figure 2 (PDF) Tube formation assay in vitro.
HUVE cells were incubated on Matrigel with CM from AdsFlt1-3- or AdLacZ-infected tumor cells. A: Exemplary light microscope image (40 magnifications) of HUVE cells incubated with CM of AdLacZ-infected cells and with CM of AdsFlt1-3-infected cells; B: So called tube-like formations were quantified per high power field. Data are shown as mean and SE (P = 0.10 compared to the control).
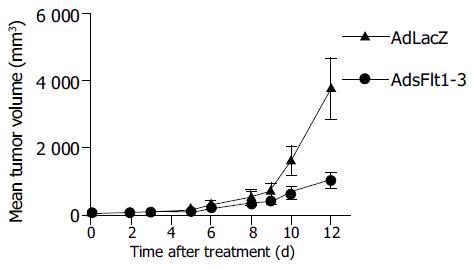
Figure 3 (PDF) Tumor treatment of pre-established CT-26 CRC.
Vectors were administered systemically (5×10⁹ pfu, AdsFlt1-3, n = 10; AdLacZ, n = 11). Data are given as mean tumor volume and SE (P = 0.006 compared to the control).
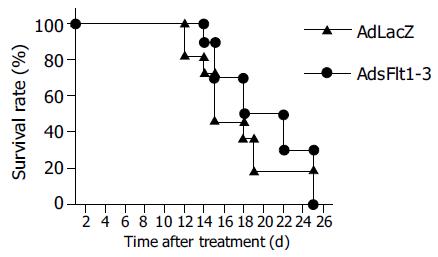
Figure 4 No effect of AdLacZ and AdsFlt1-3 on the survival rate of tumor bearing mice.
Tumor treatment of pre-established CT-26 CRC. (PDF) Vectors were administered systemically (5×10⁹ pfu, AdsFlt1-3, n = 10; AdLacZ, n = 11).
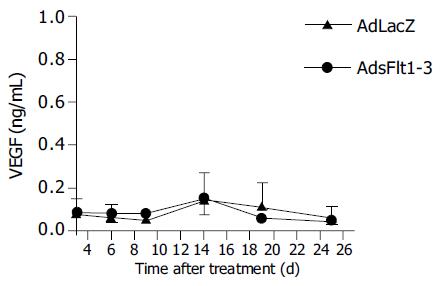
Figure 5 Time course of in vivo VEGF serum levels of tumor bearing mice that had been treated with AdLacZ or AdsFlt1-3 (mean±SE).
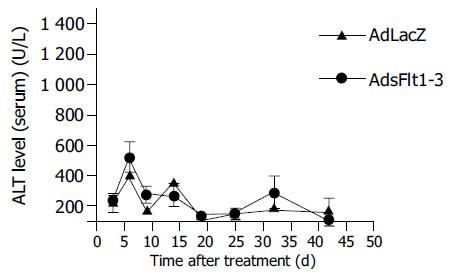
Figure 6 (PDF) Time course of ALT serum levels as marker of liver toxicity at d 3, 6, 9, 14, 19, 25, 32, and 42 after AdLacZ and AdsFlt1-3 treatment initiation (mean±SE).
Figure 7 (PDF) Effective inhibition of tumor angiogenesis in vivo by treatment with AdsFlt1-3.
Pre-established CRC tumors were treated with AdLacZ or AdsFlt1-3. Animals were killed on d 9 after treatment and tumor tissue was removed. Microvessel density was determined by anti-von Willebrand factor staining. A and B: Representative photomicrographs show microvessel staining in tumors of AdLacZ- or AdsFlt1-3-treated mice; C: quantitative analysis of microvessel density was made by counting the positively stained cells per high-power fields (200× magnification). Data are given as mean of cell number/HPF and SE (P = 0.02 compared to the control).
- Citation: Schmitz V, Kornek M, Hilbert T, Dzienisowicz C, Raskopf E, Rabe C, Sauerbruch T, Qian C, Caselmann WH. Treatment of metastatic colorectal carcinomas by systemic inhibition of vascular endothelial growth factor signaling in mice. World J Gastroenterol 2005; 11(28): 4332-4336
- URL: https://www.wjgnet.com/1007-9327/full/v11/i28/4332.htm
- DOI: https://dx.doi.org/10.3748/wjg.v11.i28.4332


