©2005 Baishideng Publishing Group Inc.
World J Gastroenterol. May 7, 2005; 11(17): 2597-2602
Published online May 7, 2005. doi: 10.3748/wjg.v11.i17.2597
Published online May 7, 2005. doi: 10.3748/wjg.v11.i17.2597
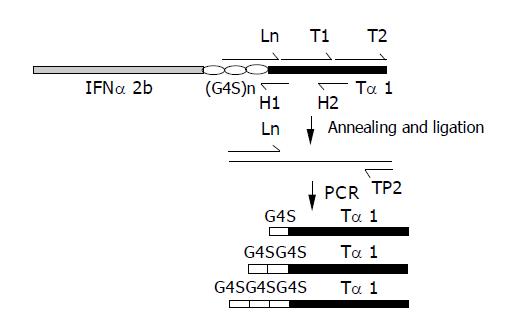
Figure 1 Construction of (G4S)n-thymosin α1 (n = 1-3) DNA fragments.
Figure 2 PCR analysis of plasmids pPIC9-IFNα2b-(G4S)n-Tα1 (n = 1-3).
The electrophoresis was performed on an 8 g/L agarose gel. Lane M: DNA molecular marker; lane 1: pPIC9-IFNα2b-G4S-Tα1; lane 2: pPIC9-IFNα2b-(G4S)2-Tα1; lane 3: pPIC9-IFNα2b-(G4S)3-Tα1.
Figure 3 Expression of the fusion proteins IFNα2b-(G4S)n-Tα1 (n = 1-3) in P.
pastoris. A: SDS-PAGE analysis of the fusion proteins. SDS-PAGE was performed on a 150 g/L polyacrylamide gel and stained with Coomassie blue R-250. Lane M: molecular weight marker; lane 1: IFNα2b-G4S-Tα1; lane 2: IFNα2b-(G4S)2-Tα1; lane3: IFNα2b-(G4S)3-Tα1; lane 4, SMD1168/pPIC9 as control; B: Density quantification analysis of lane 2 in A. Peak 4 represents the IFNα2b-(G4S)2-Tα1 fusion protein. Peak 5 represents the degradation fragment.
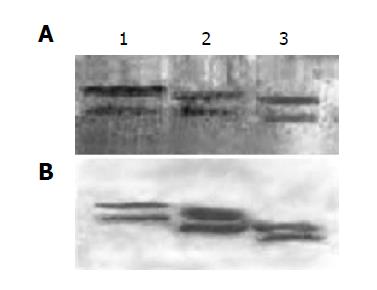
Figure 4 Identification of expressed fusion proteins IFNα2b-(G4S) n-Tα1 (n = 1-3) by the Western blot.
A: IFNα2b monoclonal antibody as the primary antibody; B: Thymosin α1 polyclonal antibody as the primary antibody. Lane 1: IFNα2b-(G4S)3-Tα1; lane 2: IFNα2b-(G4S)2-Tα1; lane 3: IFNα2b-G4S-Tα1.
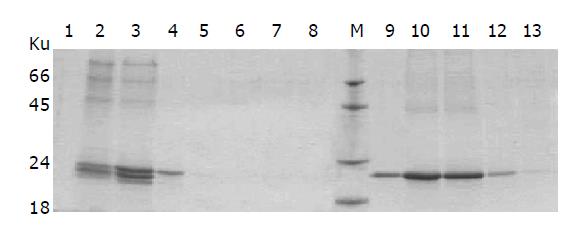
Figure 5 SDS-PAGE analysis of eluted fractions from the DEAE column by different elution buffers.
After fermentation, the supernatant of SMD1168/pPIC9-IFNα2b-(G4S)2-Tα1 was collected and loaded on the DEAE column. The fractions eluted sequentially by elution buffer A and B were analyzed by SDS-PAGE. Lane1-8: the fractions subsequently eluted by elution buffer A (0.05 mol/L Tris-HCl, 0.10 mol/L NaCl, pH 8.0); lane 9-14: the fractions subsequently eluted by elution buffer B (0.05 mol/L Tris-HCl, 0.10 mol/L NaCl, pH 8.0).
Figure 6 Purified fusion proteins IFNα2b-(G4S) n-Tα1 (n = 1-3) after gel filtration.
A: SDS-PAGE analysis of purified fusion proteins. Lane M: molecular weight marker; Lane 1: IFNα2b-(G4S)3-Tα1; Lane 2: IFNα2b-(G4S)2-Tα1; Lane 3: IFNα2b-G4S-Tα1; B: Density quantification analysis of lane 2 in A. Peak 1 represents the IFNα2b-(G4S)2-Tα1 fusion protein.
Figure 7 E-rosette analysis of the purified fusion proteins.
Experimental details are given in Materials and Methods.
- Citation: Yang YF, Yuan HY, Liu NS, Chen XL, Gao BY, Lu H, Li YY. Construction, expression and characterization of human interferon α2b-(G4S)n-thymosin α1 fusion proteins in Pichia pastoris. World J Gastroenterol 2005; 11(17): 2597-2602
- URL: https://www.wjgnet.com/1007-9327/full/v11/i17/2597.htm
- DOI: https://dx.doi.org/10.3748/wjg.v11.i17.2597


