©2005 Baishideng Publishing Group Inc.
World J Gastroenterol. May 7, 2005; 11(17): 2591-2596
Published online May 7, 2005. doi: 10.3748/wjg.v11.i17.2591
Published online May 7, 2005. doi: 10.3748/wjg.v11.i17.2591
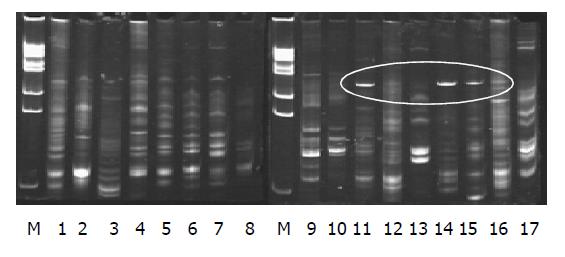
Figure 1 Gut bacterium colony DNA fingerprint profiles.
Lane M: Marker; lanes 1-8: Probiotics group; lanes 9 and 10: Control group; lanes 11-17: PN group.
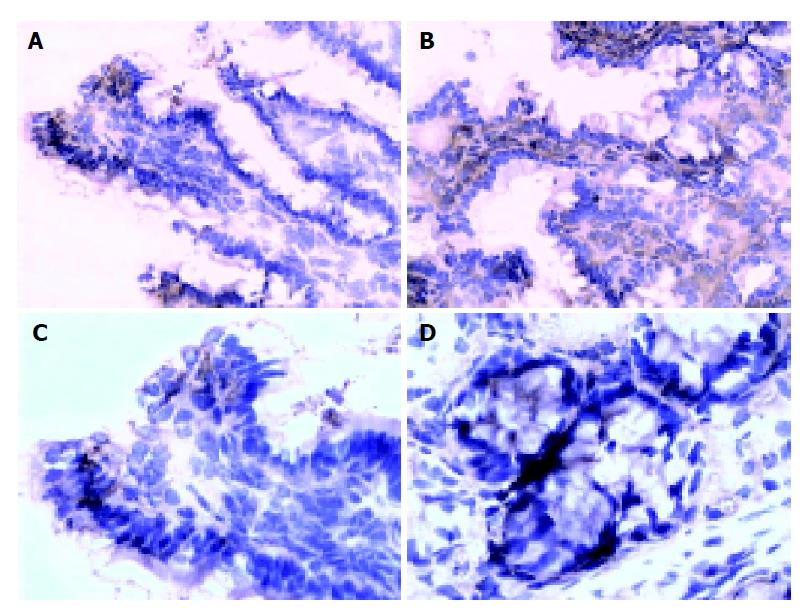
Figure 2 Intestinal and colon epithelial occludin expression.
A: Intestinal epithelium occludin expression decreased in PN group (200×); B: Intestinal epithelium occludin expression increased in probiotics group (200×); C: Colon epithelium occludin expression decreased in PN group (200×); D: Colon epithelium occludin expression increased in probiotics group (200×).
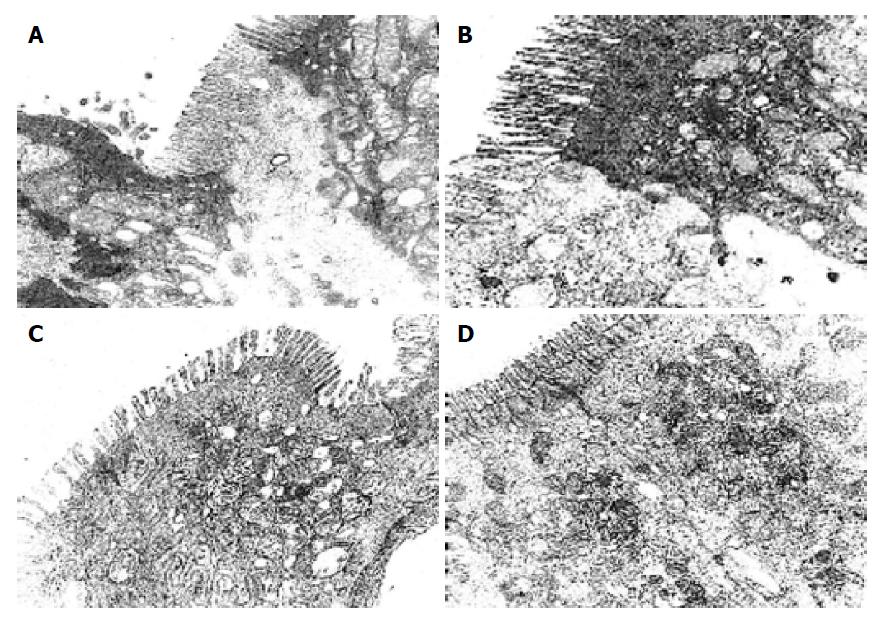
Figure 3 The ultra-structure of the tight junction of the intestine and colon.
A: The tight junction of intestine was damaged seriously in PN group (5000×); B: The tight junction of intestine was damaged in probiotics group (5000×); C: The tight junction of colon junction was damaged seriously in PN group (5000×); D: The tight junction of the colon was clear in probiotics group (5000×).
- Citation: Qin HL, Shen TY, Gao ZG, Fan XB, Hang XM, Jiang YQ, Zhang HZ. Effect of lactobacillus on the gut microflora and barrier function of the rats with abdominal infection. World J Gastroenterol 2005; 11(17): 2591-2596
- URL: https://www.wjgnet.com/1007-9327/full/v11/i17/2591.htm
- DOI: https://dx.doi.org/10.3748/wjg.v11.i17.2591


