Copyright
©2005 Baishideng Publishing Group Inc.
World J Gastroenterol. Apr 28, 2005; 11(16): 2491-2496
Published online Apr 28, 2005. doi: 10.3748/wjg.v11.i16.2491
Published online Apr 28, 2005. doi: 10.3748/wjg.v11.i16.2491
Figure 1 HepG2 cells’ growth inhibited by Cantide, DDP(A), 5-FU(B) and ADM(C) only and at the indicated combinations on HepG2 cells.
The dots represent the concentrations of chemotherapeutic drugs as 0 on the dose-response curves which means treatments with Cantide only. The cells were treated with Cantide complexed to Lipofectin for 6 h at 37 °C. The medium was then replaced with media containing various concentrations of DDP, 5-FU and ADM. After 72 h of incubation, MTT assay was performed. Absorbance at 490 nm was normalized to the control, untreated cells to determine cell viability. Each value represents the mean±SD from triplicate determination.
Figure 2 Q values for the combination treatments of Cantide with DDP (A), 5-FU (B) and ADM (C) tested on HepG2 cells.
Q values were calculated from the dose-response curves shown in Figure 1 and analyzed with Zheng-Jun Jin method.
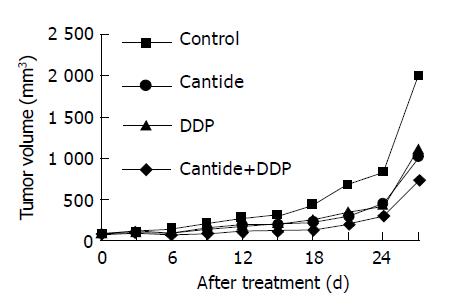
Figure 3 Tumor growth curves for Balb/c nude mice after treatment with DDP, Cantide or DDP+Cantide.
Points for these groups represent the average values for 7-8 mice.
-
Citation: Yang Y, Lv QJ, Du QY, Yang BH, Lin RX, Wang SQ. Combined effects of Cantide and chemotherapeutic drugs on inhibition of tumor cells’ growth
in vitro andin vivo . World J Gastroenterol 2005; 11(16): 2491-2496 - URL: https://www.wjgnet.com/1007-9327/full/v11/i16/2491.htm
- DOI: https://dx.doi.org/10.3748/wjg.v11.i16.2491


