Copyright
©The Author(s) 2004.
World J Gastroenterol. Aug 1, 2004; 10(15): 2163-2167
Published online Aug 1, 2004. doi: 10.3748/wjg.v10.i15.2163
Published online Aug 1, 2004. doi: 10.3748/wjg.v10.i15.2163
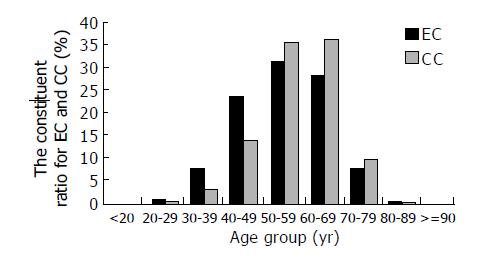
Figure 1 The histogram of the constituent ratio for EC and CC in Chaoshan region.
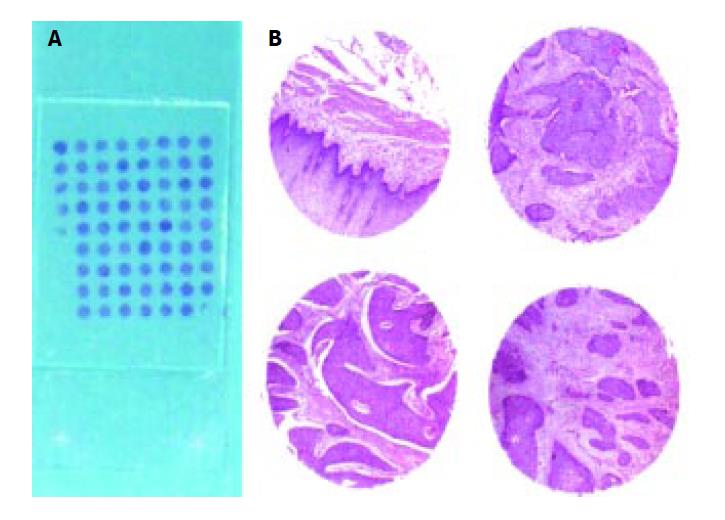
Figure 2 A: Overview of Chaoshan esophageal carcinoma tissue array (tissue cores with a diameter of 1.
5 mm with 68 samples); B: Esophageal para-cancerous tissue and squamous carcinoma tissue (HE staining, original magnification: × 40).
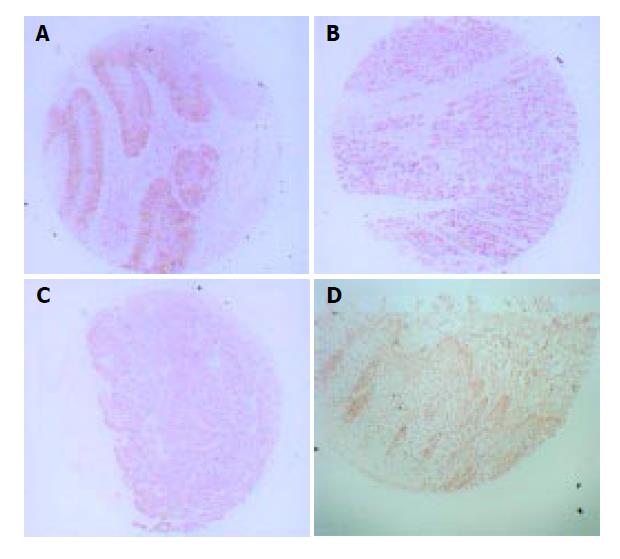
Figure 3 Phosphor-EGFR (Tyr845) expression on esophageal squamous carcinoma tissue (A, B, C) and esophageal para-cancerous tissue (D) (Cell Signaling Technology kit, original magnification: × 40).
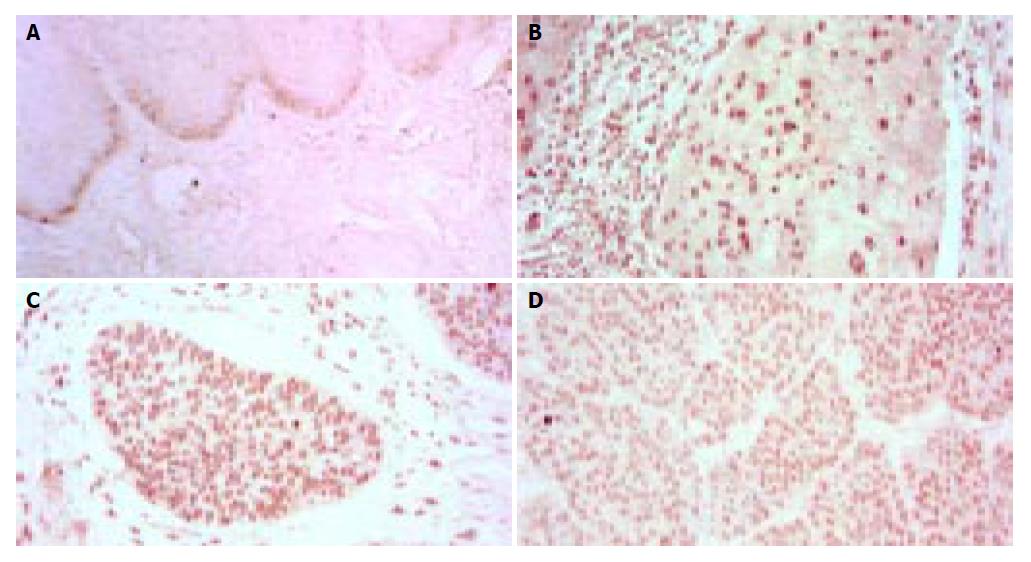
Figure 4 Erk1/Erk2 expression on normal esophageal squamous tissue (A, conventional tissue section, SP × 100) and esophageal squamous carcinoma tissue (B, C, D tissue arrays) (SP × 200).
- Citation: Su M, Li XY, Tian DP, Wu MY, Wu XY, Lu SM, Huang HH, Li DR, Zheng ZC, Xu XH. Clinicopathologic analysis of esophageal and cardiac cancers and survey of molecular expression on tissue arrays in Chaoshan littoral of China. World J Gastroenterol 2004; 10(15): 2163-2167
- URL: https://www.wjgnet.com/1007-9327/full/v10/i15/2163.htm
- DOI: https://dx.doi.org/10.3748/wjg.v10.i15.2163


