Copyright
©The Author(s) 2004.
World J Gastroenterol. Jul 1, 2004; 10(13): 1923-1927
Published online Jul 1, 2004. doi: 10.3748/wjg.v10.i13.1923
Published online Jul 1, 2004. doi: 10.3748/wjg.v10.i13.1923
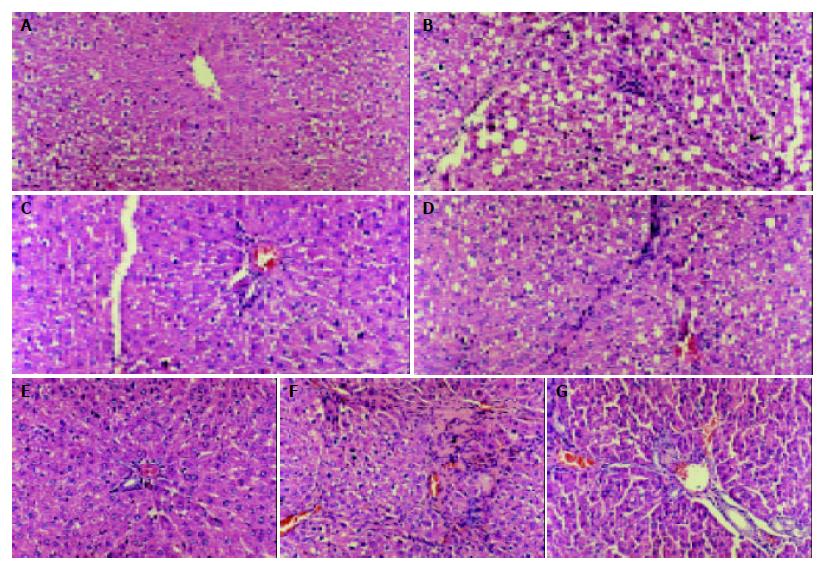
Figure 1 Histological images of three-grade fibrosis and tetrandrine treated group (200 ×).
A: normal group, B: earlier cirrhosis group, C: earlier tetrandrine group, D: metaphase cirrhosis group, E: metaphase tetrandrine group, F: late cirrhosis group, G: late tetrandrine group.
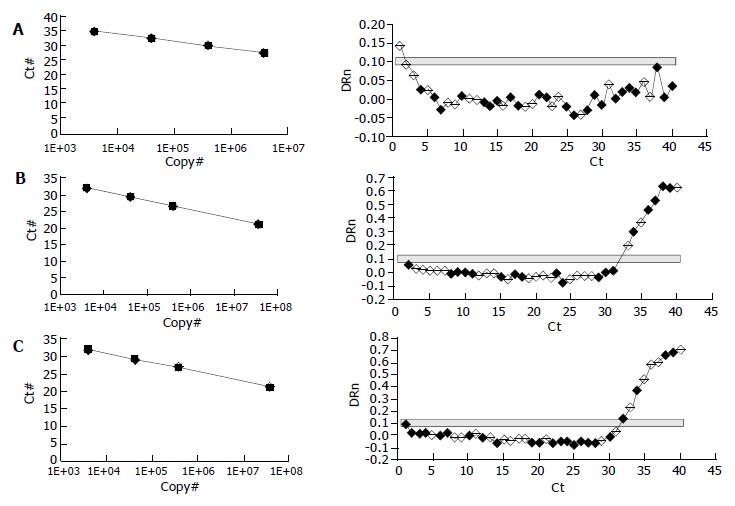
Figure 2 Real-time RT-PCR images: Expression of iNOS in normal hepatic tissue (A), Expression of iNOS in Tetrandrine therapeutic hepatic tissue (B), Expression of iNOS in cirrhotic tissue (C).
NOS II was not expressed in normal rat tissue, but highly expressed in cirrhotic rat tissue and NOS II in therapeutic groups was significantly decreased than that in cirrhosis.
Figure 3 Quantification of cirrhosis: cirrhotic group (A), Tetrandrine group (B).
- Citation: Wang H, Chen XP, Qiu FZ. Increased hepatic expression of nitric oxide synthase type II in cirrhotic rats. World J Gastroenterol 2004; 10(13): 1923-1927
- URL: https://www.wjgnet.com/1007-9327/full/v10/i13/1923.htm
- DOI: https://dx.doi.org/10.3748/wjg.v10.i13.1923


