©The Author(s) 2021.
World J Meta-Anal. Aug 28, 2021; 9(4): 353-376
Published online Aug 28, 2021. doi: 10.13105/wjma.v9.i4.353
Published online Aug 28, 2021. doi: 10.13105/wjma.v9.i4.353
Figure 1 Flowchart of literature search.
The flowchart shows, for each of the four stages of the process, the numbers of papers and meta-analyses considered, together with the numbers of papers meeting the selection criteria or rejected, with reasons for rejection shown.
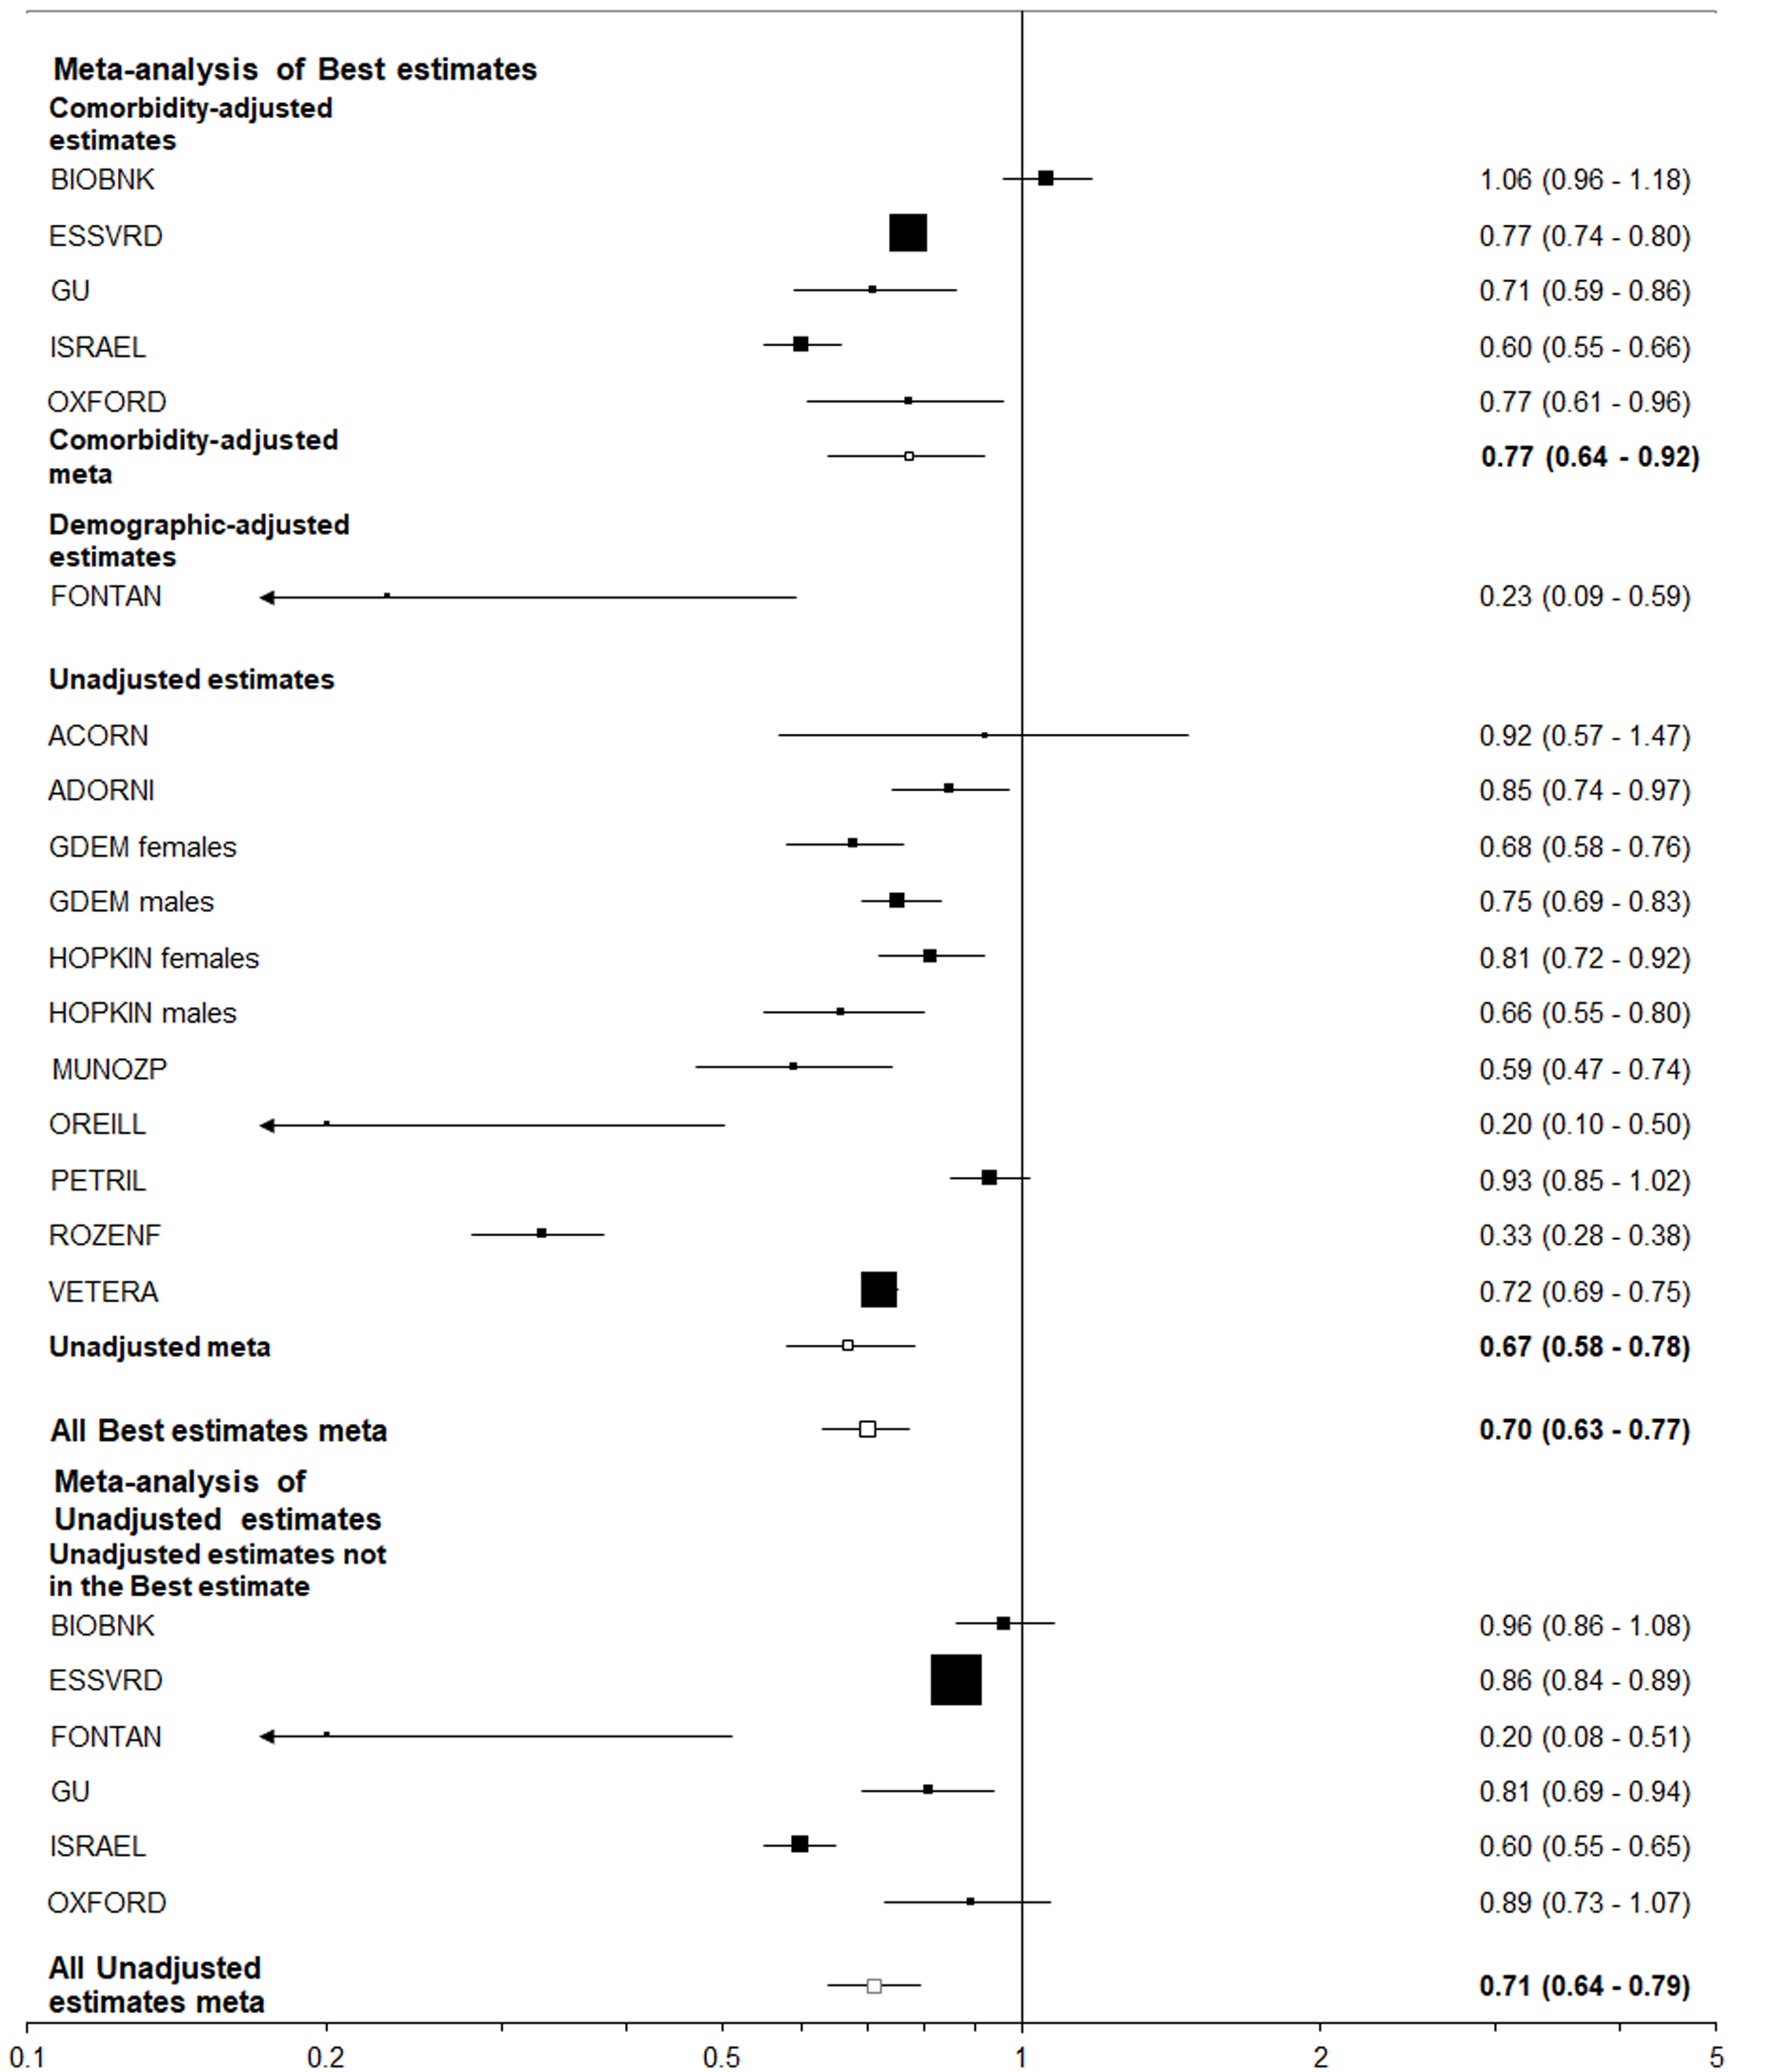
Figure 2 Forest plot of the relationship of the index “closest to current smoking” to positivity for coronavirus disease 2019 among those tested.
The individual study effect estimates and random-effects combined effect estimates are shown, both as numbers and as horizontal lines with the weight of the estimate indicated by a box of proportional size. “Best estimates” are selected in the preference order (first to last) comorbidity-adjusted, demographic-adjusted and unadjusted. Estimates from ESSVRD, GDEM and HOPKIN are for current vs non-smokers, from FONTAN and OREILL for smokers (undefined) vs non-smokers, and from MUNOZP and ROZENF for ever vs never smokers, with estimates from the other eight studies being for current vs never smokers.
Figure 3 Forest plot of the relationship of the index “closest to ever smoking” to positivity for coronavirus disease 2019 among those tested.
This figure is laid out as described for Figure 2. Estimates from ESSVRD, GDEM and HOPKIN are for current vs non-smokers, from FONTAN and OREILL for smokers (undefined) vs non-smokers, with estimates from the other 10 studies being for ever vs never smokers.
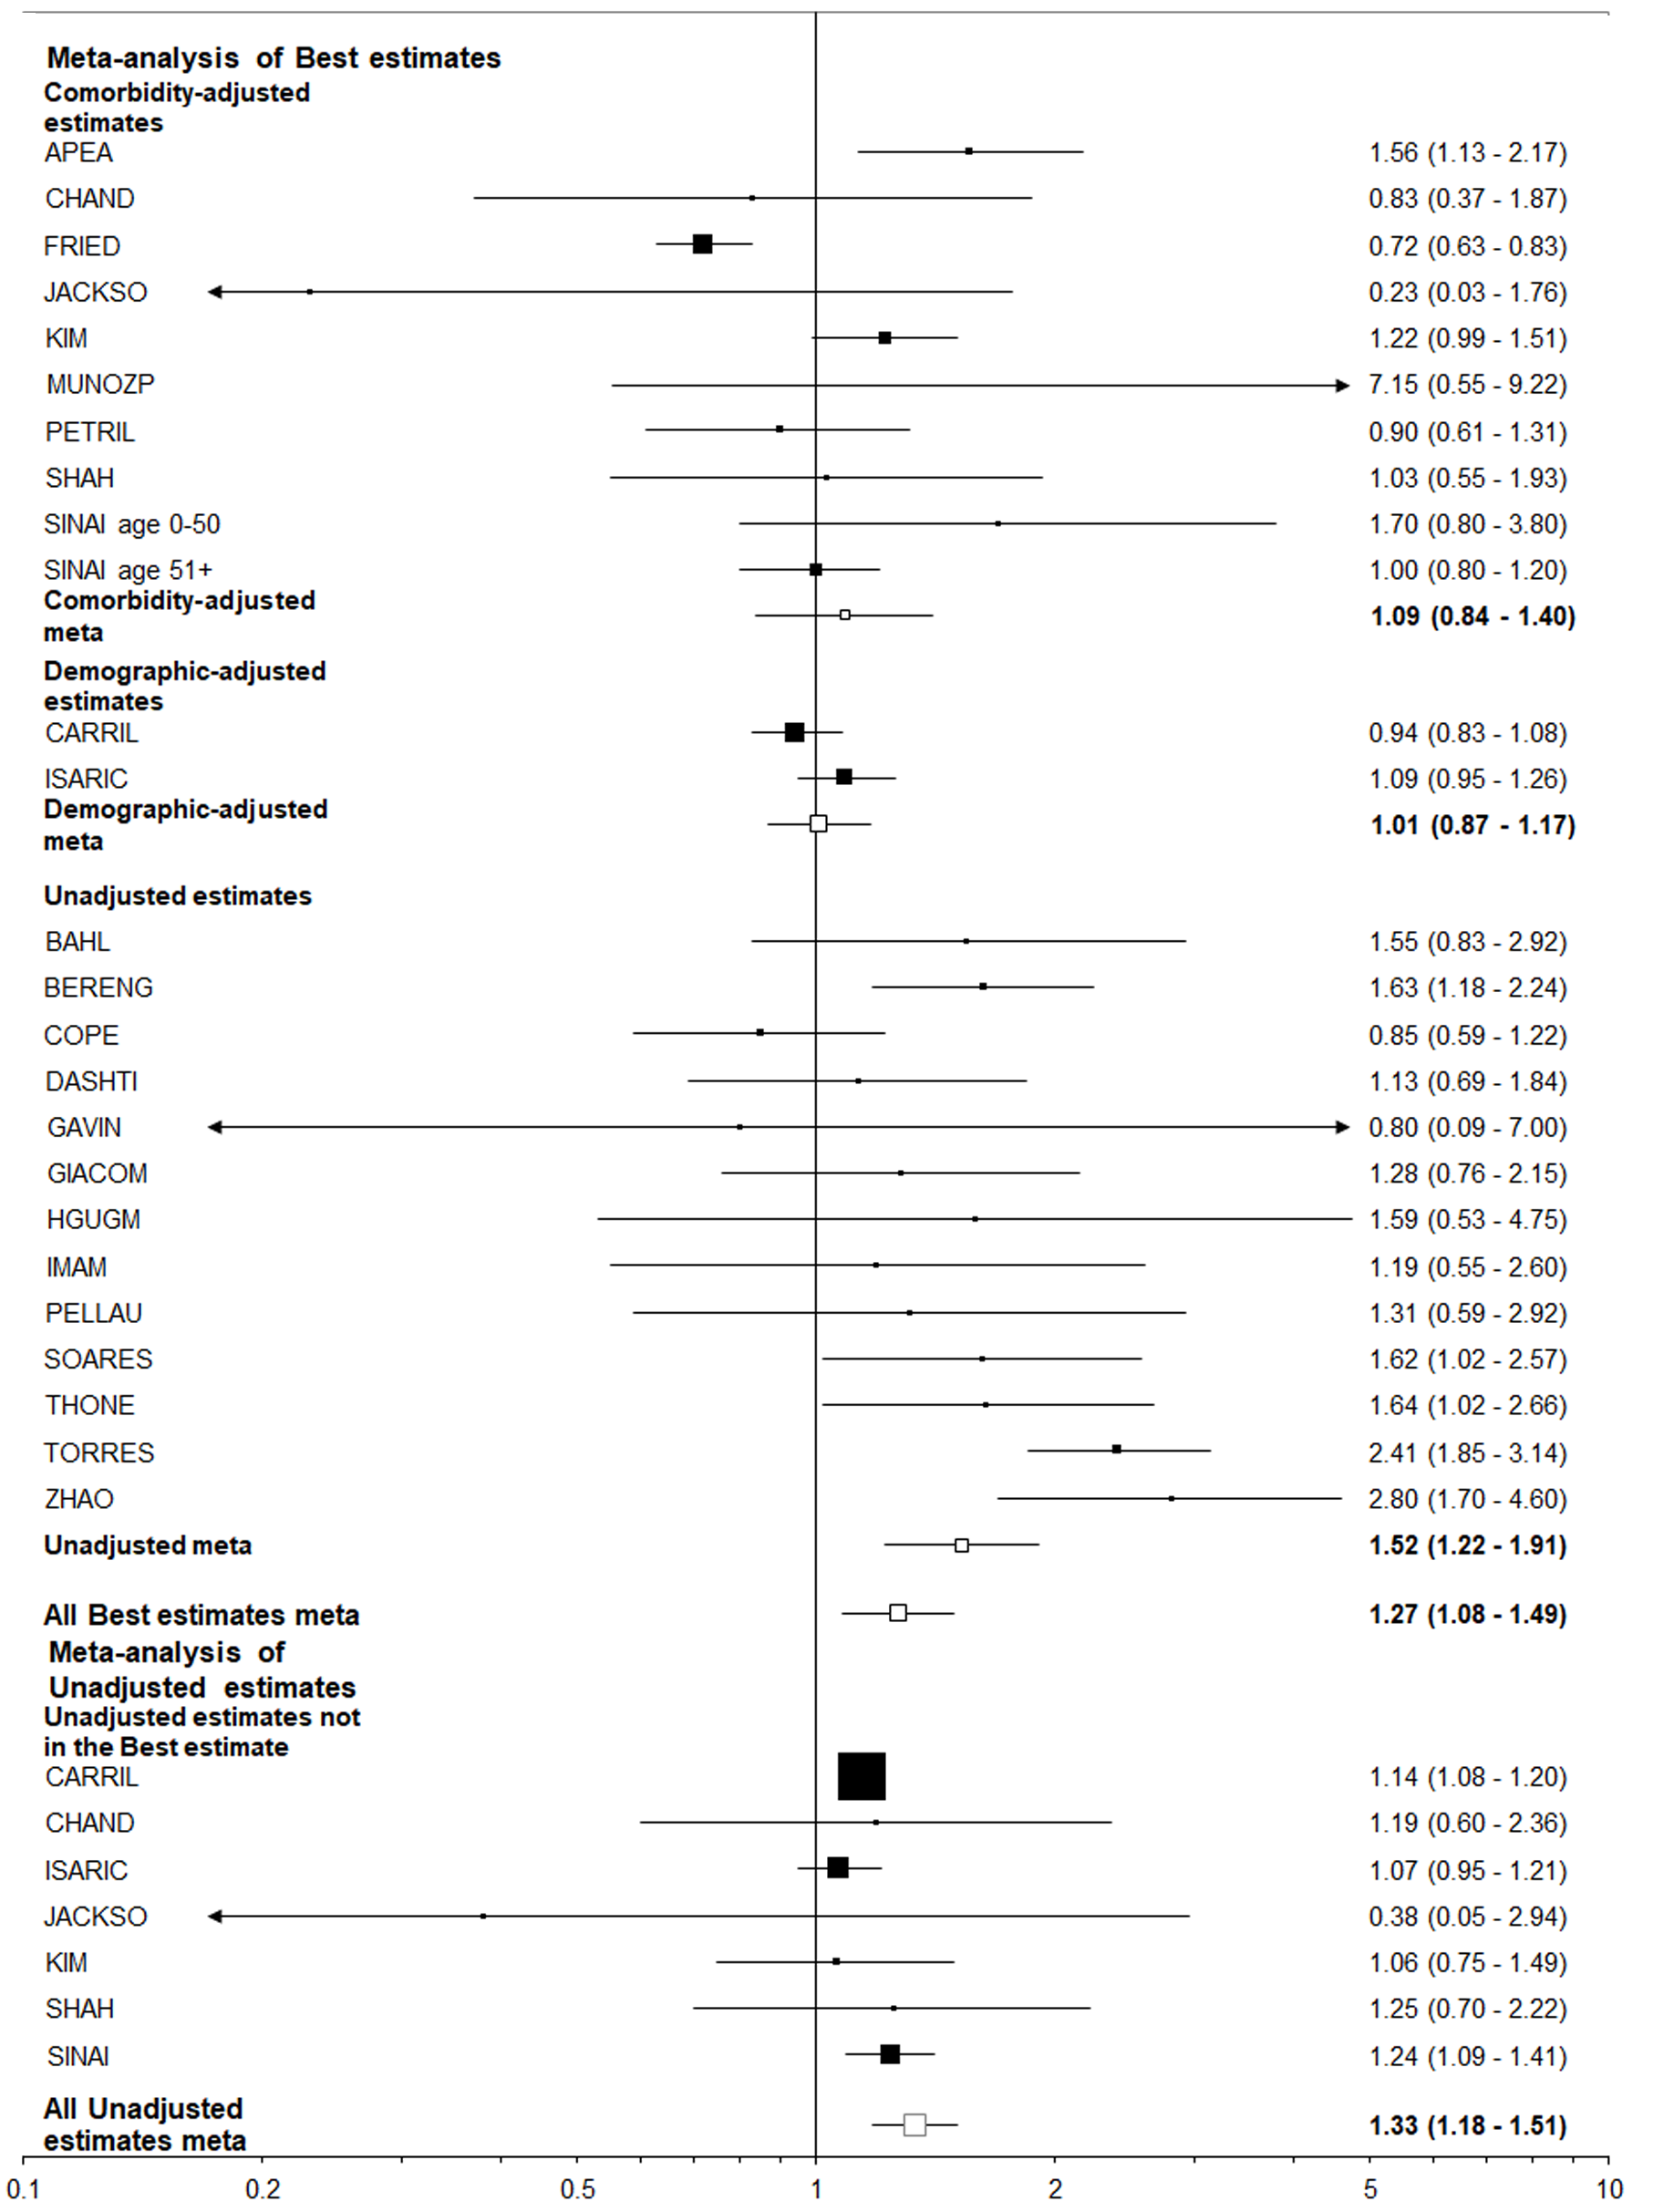
Figure 4 Forest plot of the relationship of the index “closest to current smoking” to death among those hospitalized for coronavirus disease 2019.
This figure is laid out as described for Figure 2. Estimates from CARRIL are for current vs non-smokers, from APEA, HGUGM, PELLAU, SOARES and TORRES for smokers (undefined) vs non-smokers, and from CHAND, FRIED, GIACOM, IMAM, MUNOZP, SHAH, SINAI, THONE and ZHAO for ever vs never smokers, with estimates from the other nine studies being for current vs never smokers.
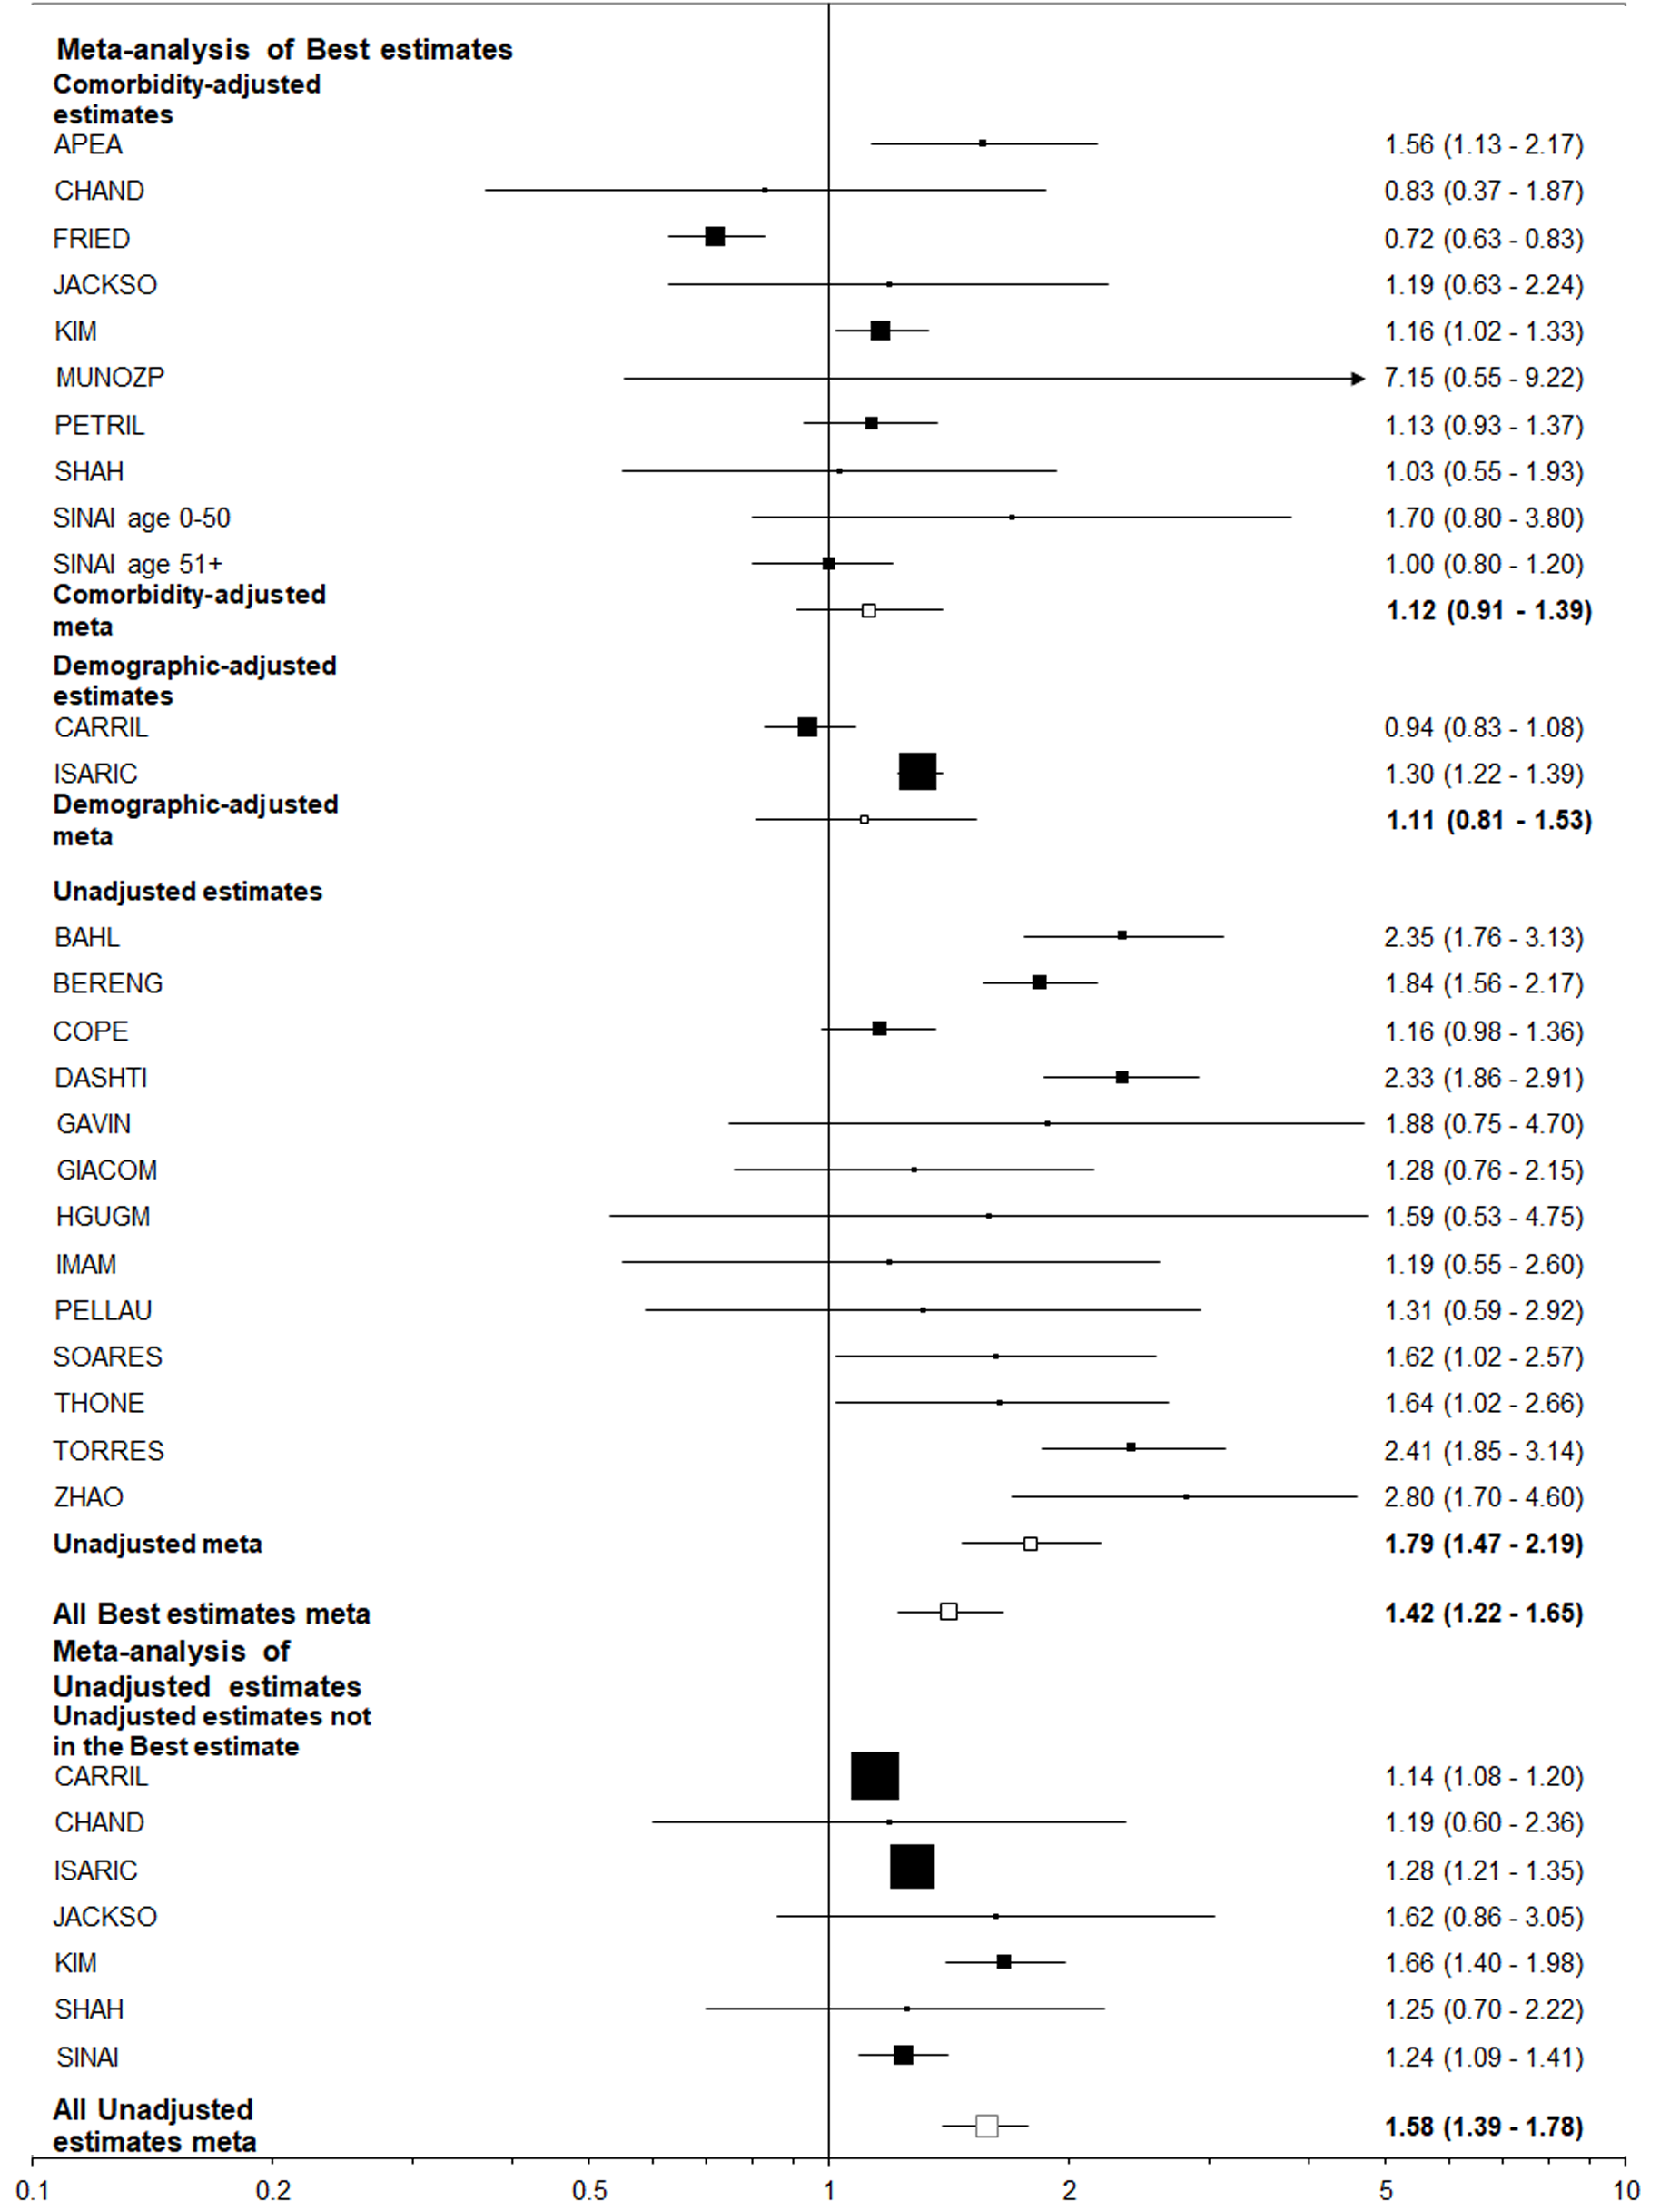
Figure 5 Forest plot of the relationship of the index “closest to ever smoking” to death among those hospitalized for coronavirus disease 2019.
This figure is laid out as described for Figure 2. Estimates from CARRIL are for current vs non-smokers, from APEA, HGUGM, PELLAU, SOARES and TORRES for smokers (undefined) vs non-smokers, and from PETRIL for former vs never smokers, with estimates from the other 17 studies being for ever vs never smokers.
- Citation: Lee PN, Hamling JS, Coombs KJ. Systematic review with meta-analysis of the epidemiological evidence in Europe, Israel, America and Australasia on smoking and COVID-19. World J Meta-Anal 2021; 9(4): 353-376
- URL: https://www.wjgnet.com/2308-3840/full/v9/i4/353.htm
- DOI: https://dx.doi.org/10.13105/wjma.v9.i4.353


