Copyright
©The Author(s) 2015.
World J Meta-Anal. Dec 26, 2015; 3(6): 284-294
Published online Dec 26, 2015. doi: 10.13105/wjma.v3.i6.284
Published online Dec 26, 2015. doi: 10.13105/wjma.v3.i6.284
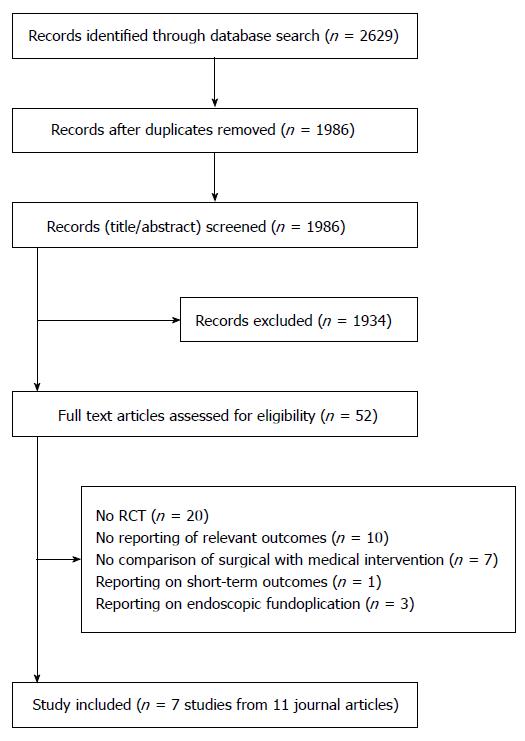
Figure 1 Study selection.
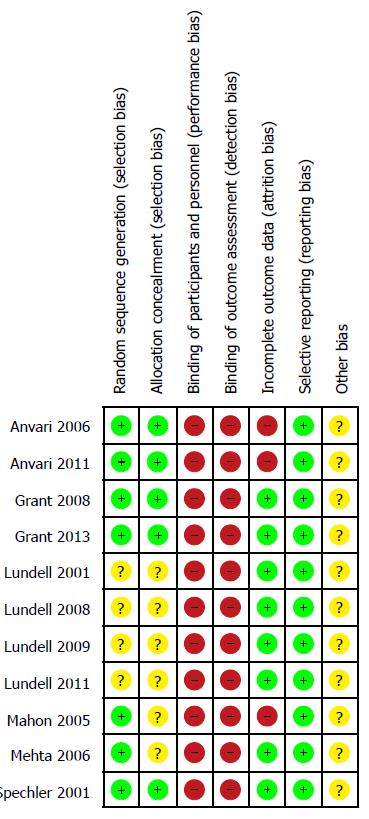
Figure 2 Risk of bias assessment.
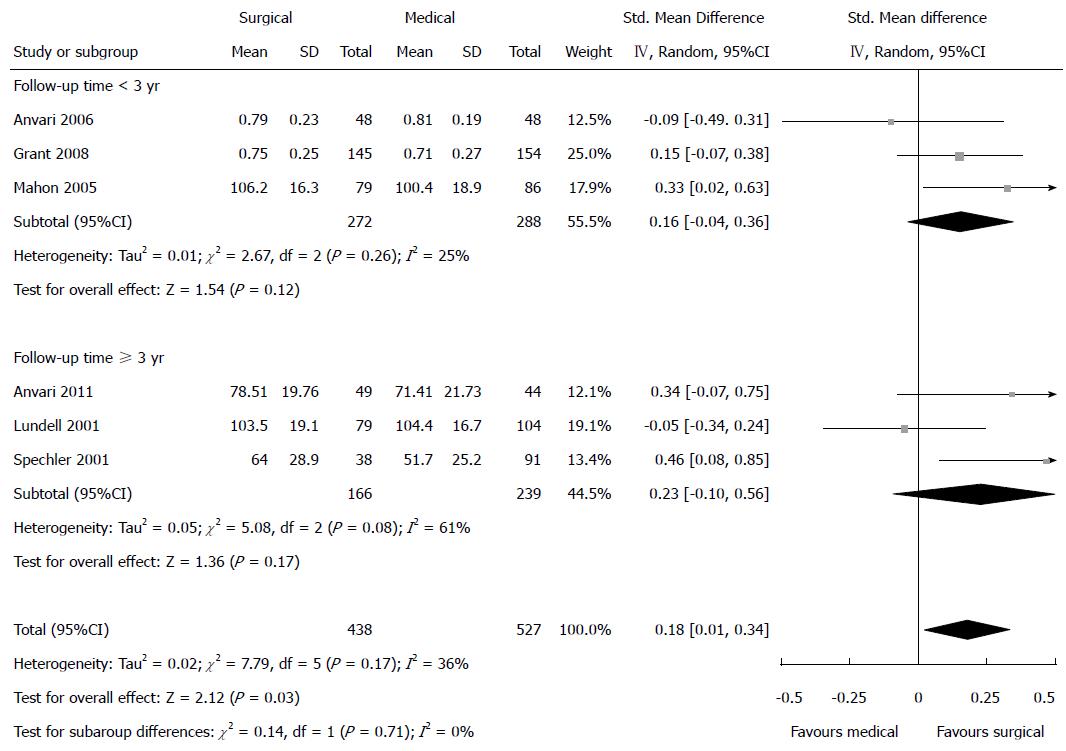
Figure 3 Meta-analysis Forest plot concerning health-related quality of life.
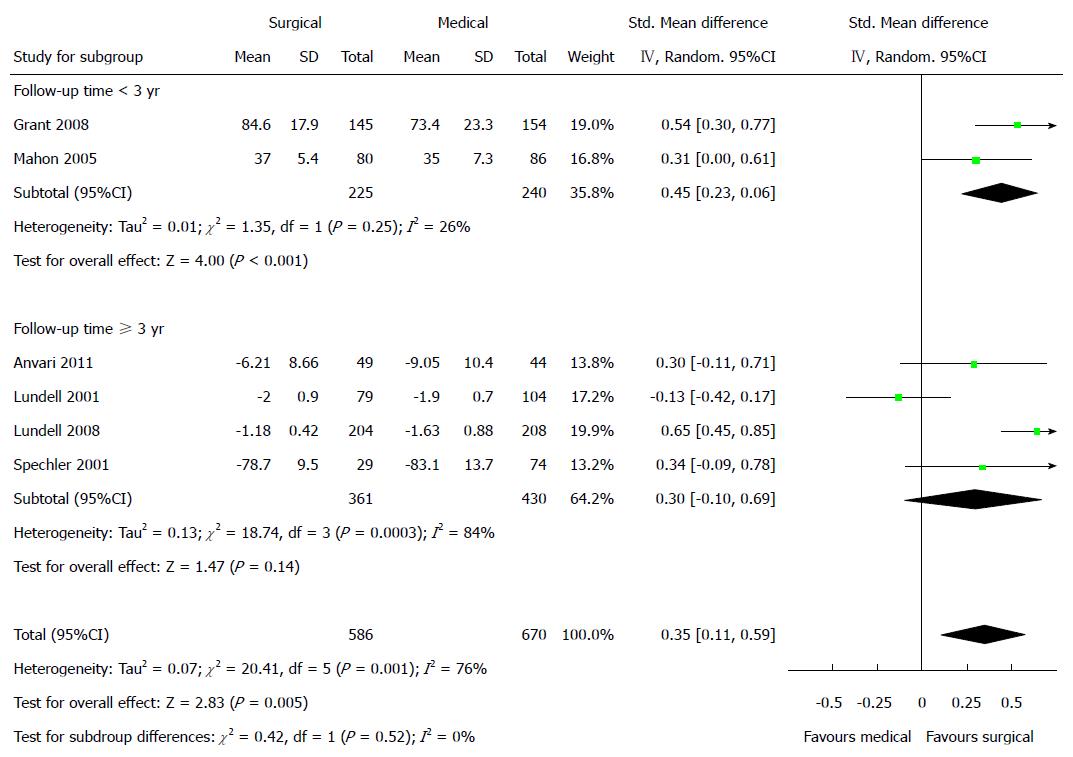
Figure 4 Meta-analysis Forest plot concerning gastroesophageal reflux disease-related quality of life.
Figure 5 Meta-analysis Forest plot concerning % of time pH < 4.
Figure 6 Meta-analysis Forest plot concerning DeMeester scores.
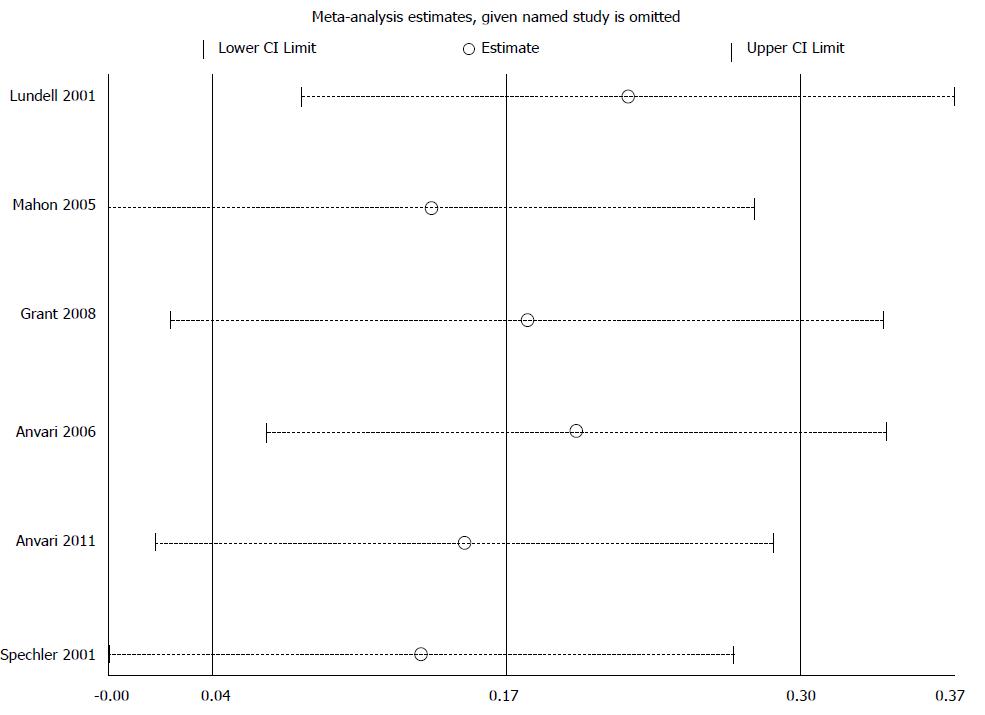
Figure 7 Sensitivity analysis concerning gastroesophageal reflux disease-related quality of life.
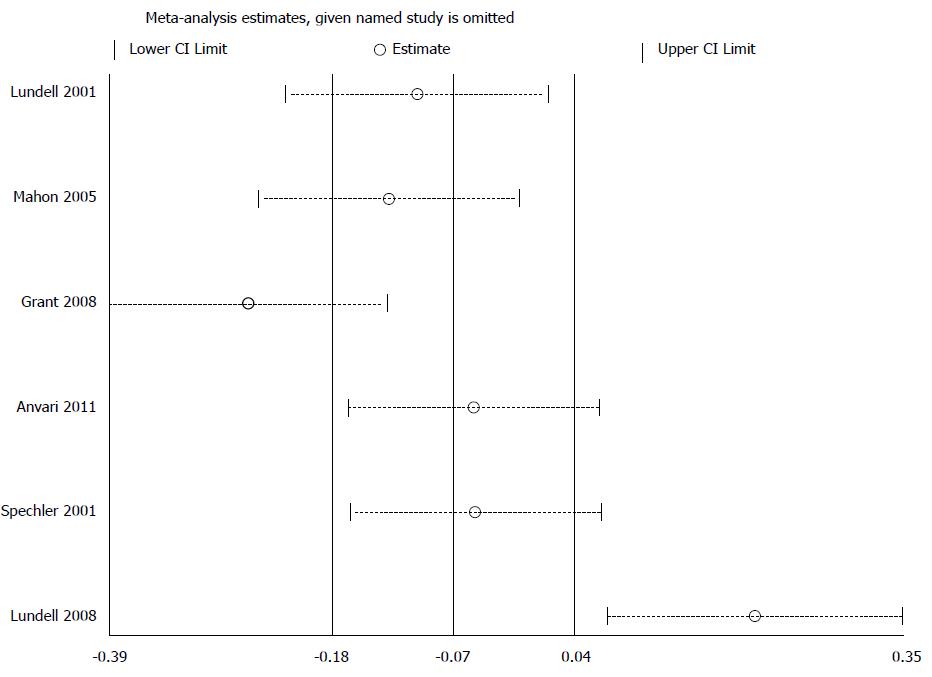
Figure 8 Sensitivity analysis concerning health-related quality of life.
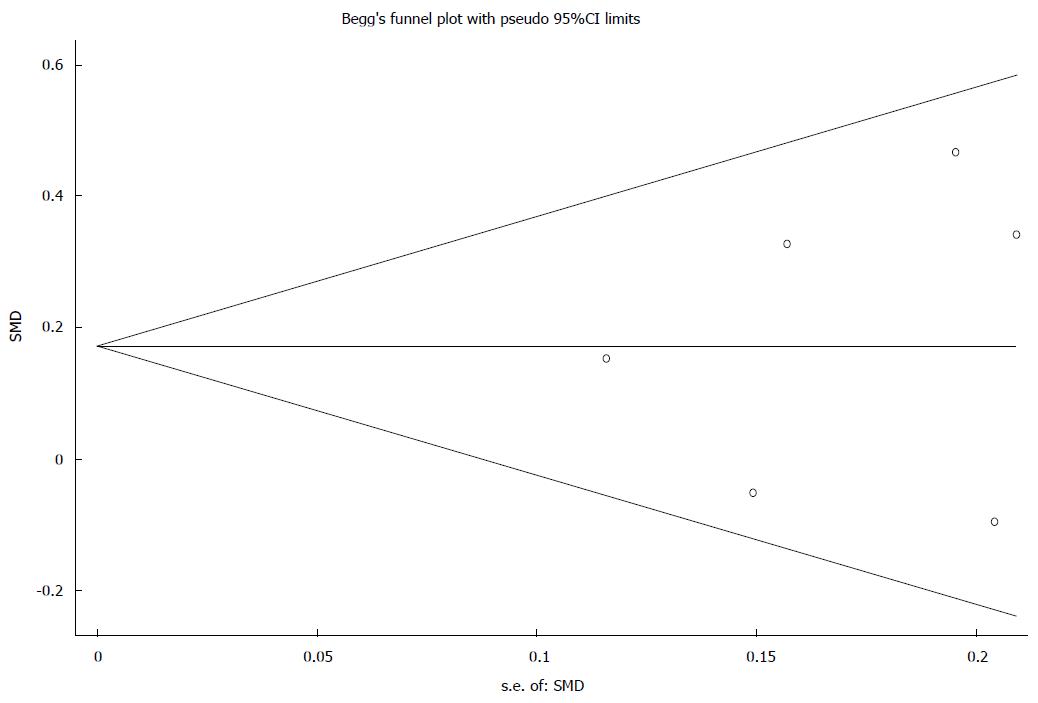
Figure 9 Funnel plot of health-related quality of life.
SMD: Standardized mean difference.
- Citation: Jiang Y, Cui WX, Wang Y, Heng D, Tan JC, Lin L. Antireflux surgery vs medical treatment for gastroesophageal reflux disease: A meta-analysis. World J Meta-Anal 2015; 3(6): 284-294
- URL: https://www.wjgnet.com/2308-3840/full/v3/i6/284.htm
- DOI: https://dx.doi.org/10.13105/wjma.v3.i6.284


