©The Author(s) 2022.
World J Meta-Anal. Feb 28, 2022; 10(1): 25-36
Published online Feb 28, 2022. doi: 10.13105/wjma.v10.i1.25
Published online Feb 28, 2022. doi: 10.13105/wjma.v10.i1.25
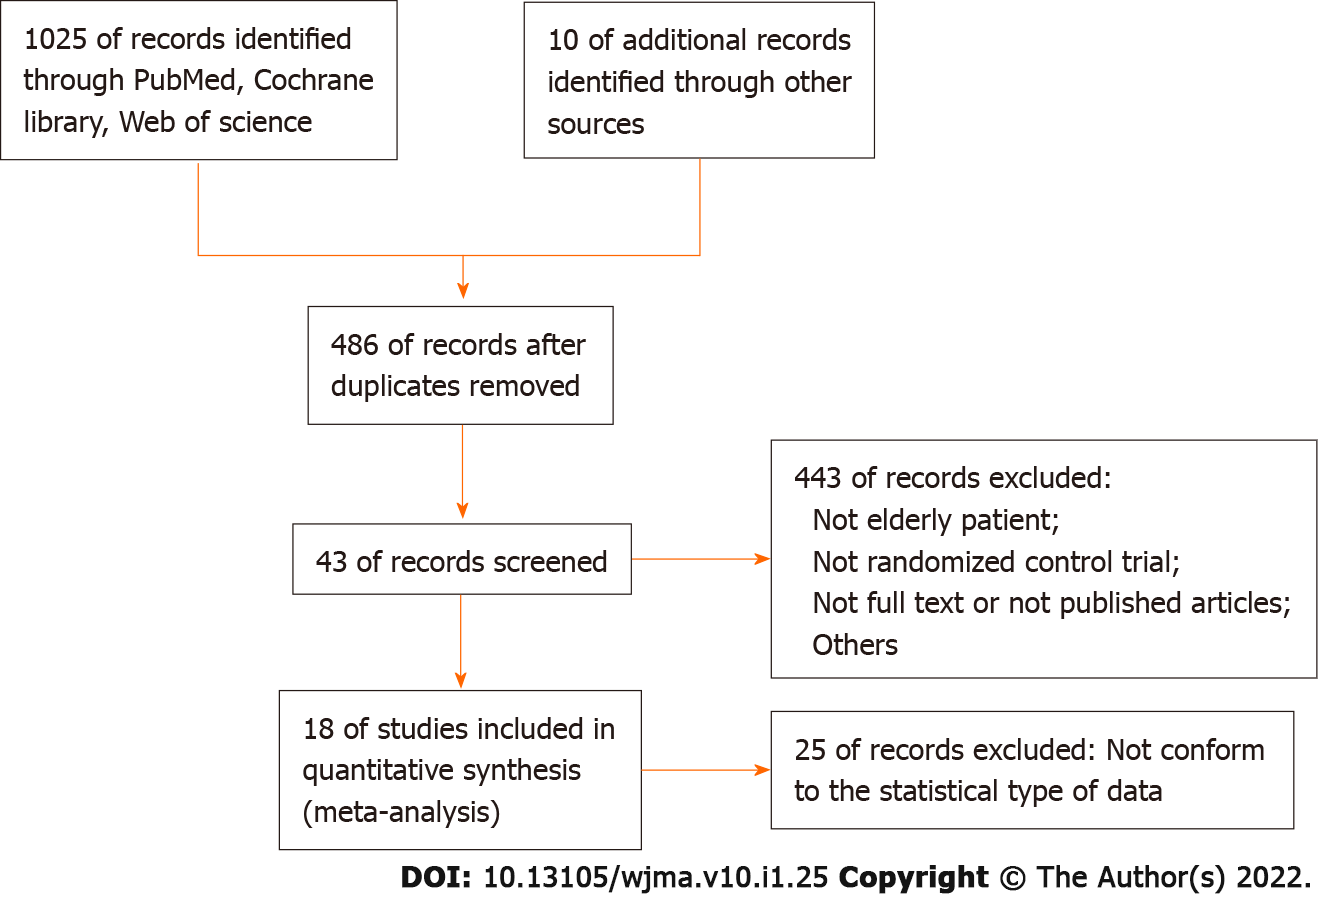
Figure 1
Flow chart of study selection.
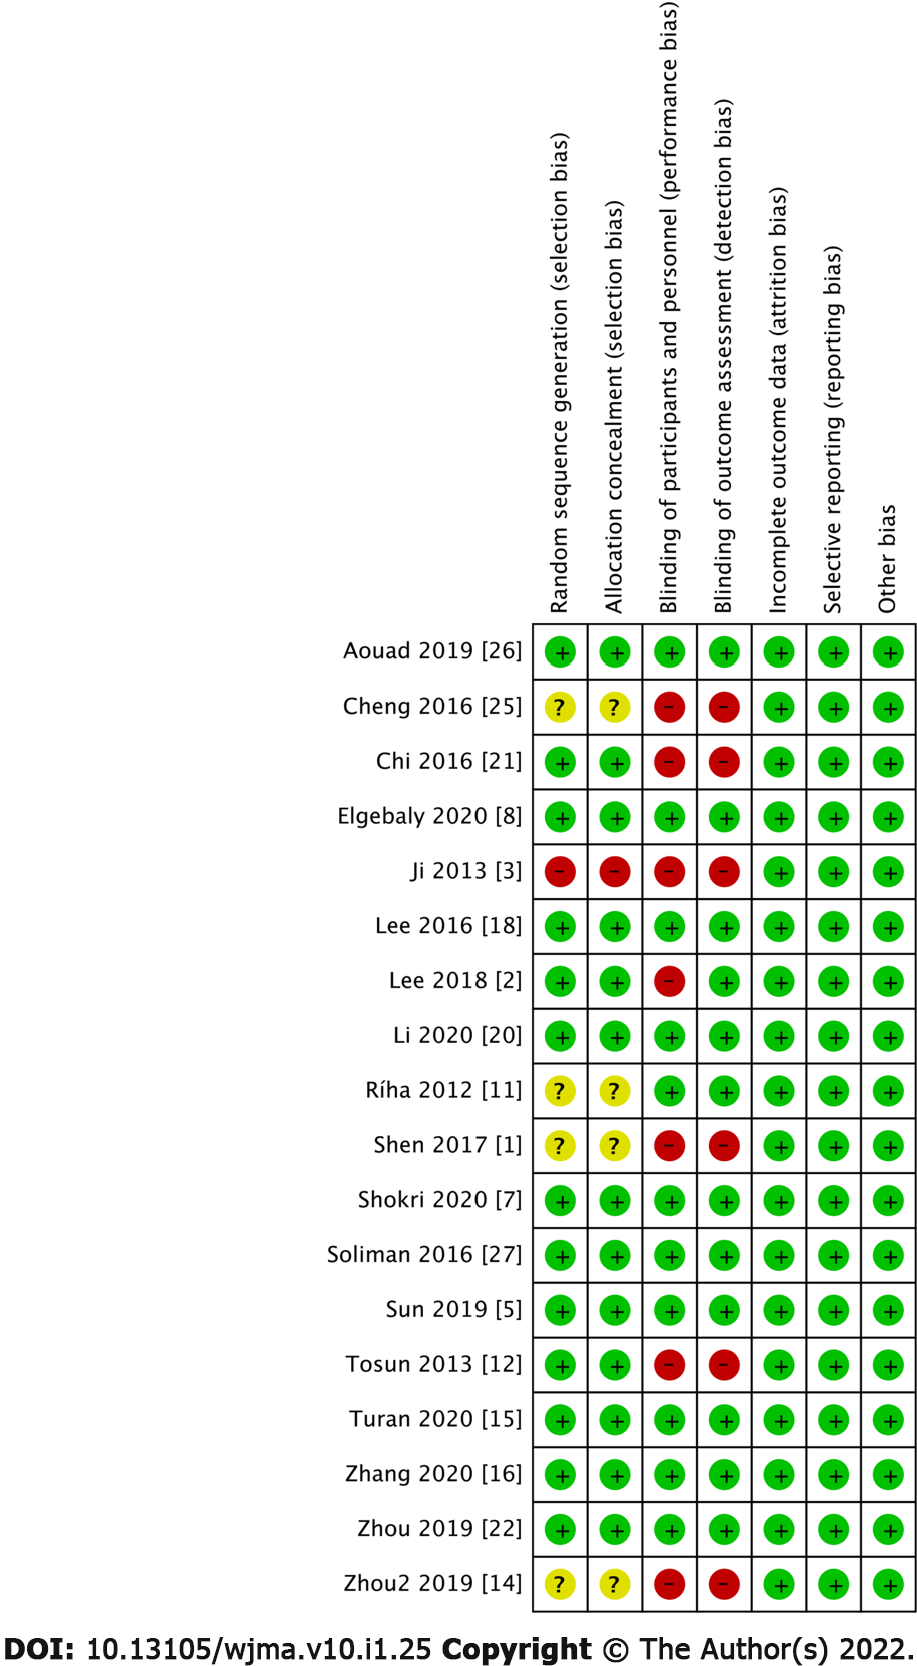
Figure 2
Risk of bias assessment according to cochrane risk of bias methods.
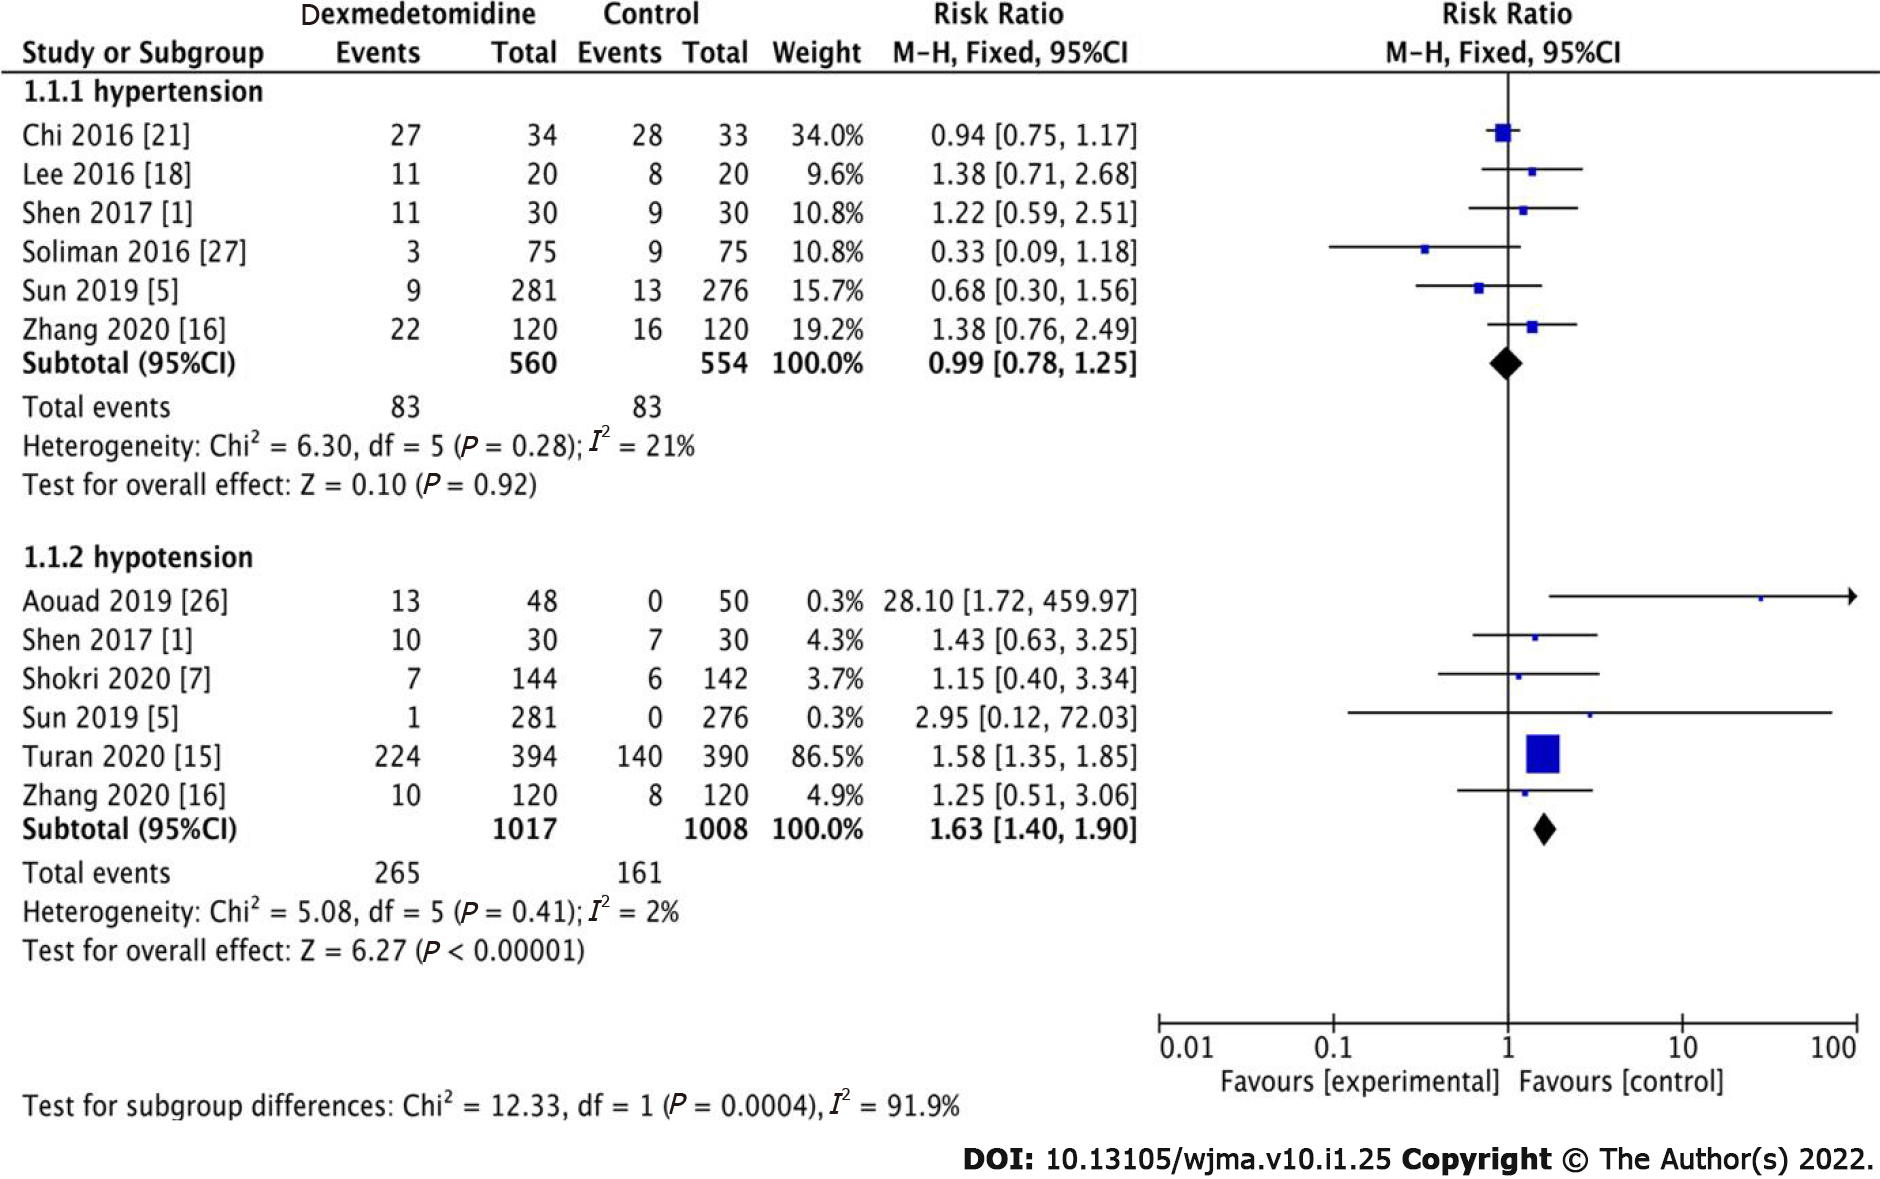
Figure 3
Meta-analysis of the incidence of hypertension and hypotension during the operation.
Figure 4
Meta-analysis of heart rate.
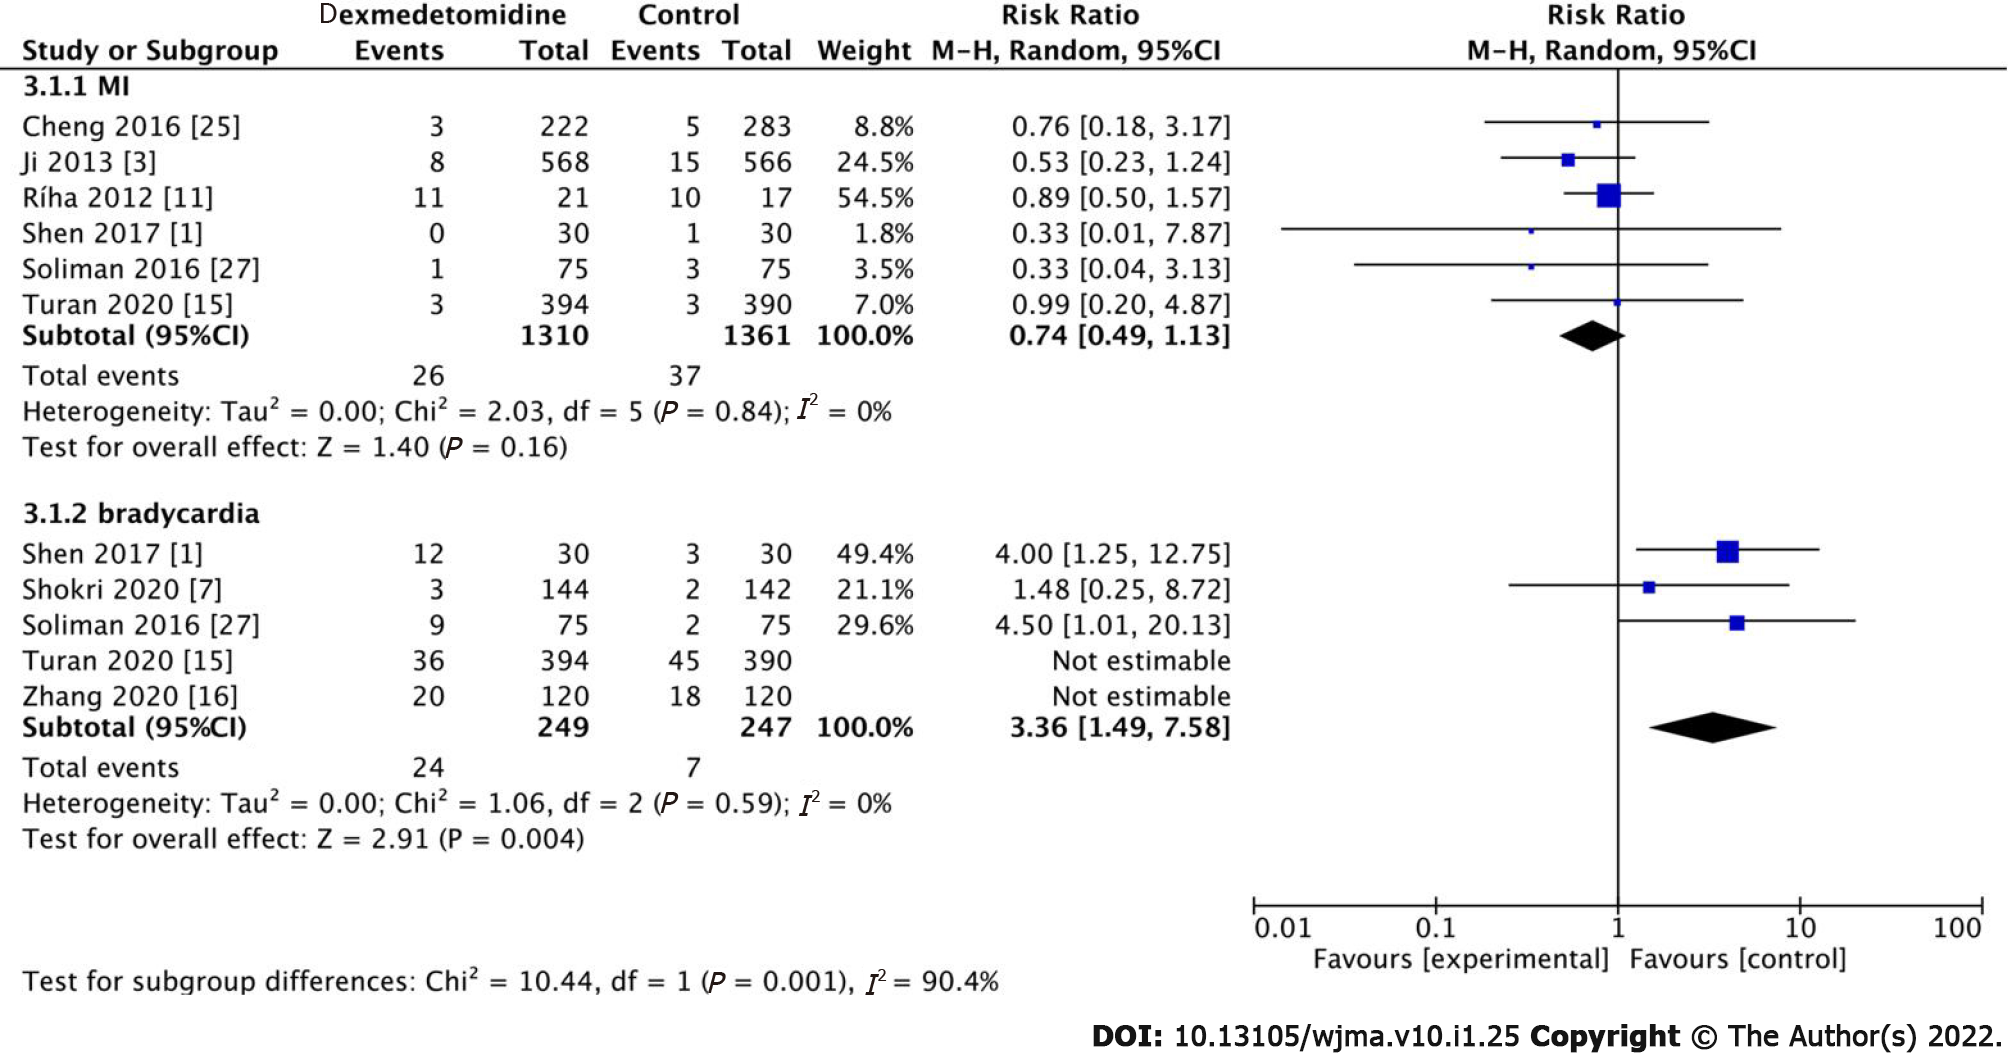
Figure 5 Meta-analysis of cardiac complications (myocardial infarction and bradycardia).
MI: Myocardial infarction.
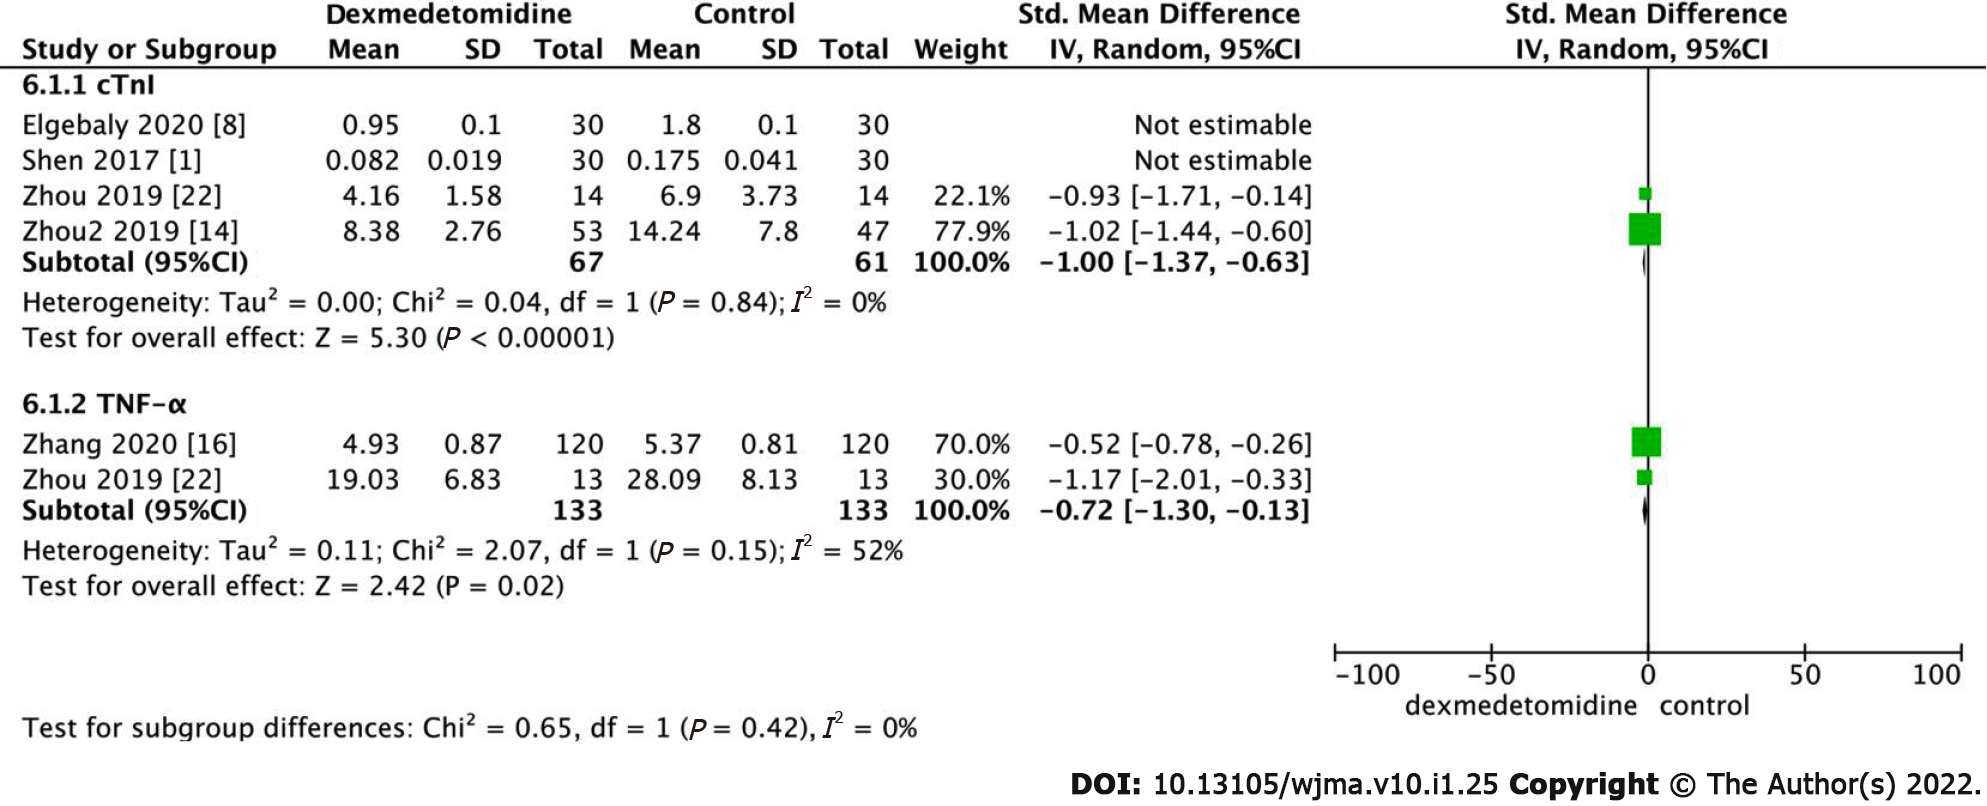
Figure 6
Meta-analysis of cardiac troponin I (cTnI) (mg/L) and TNF-α (tumor necrosis factor-α) (μl/L).
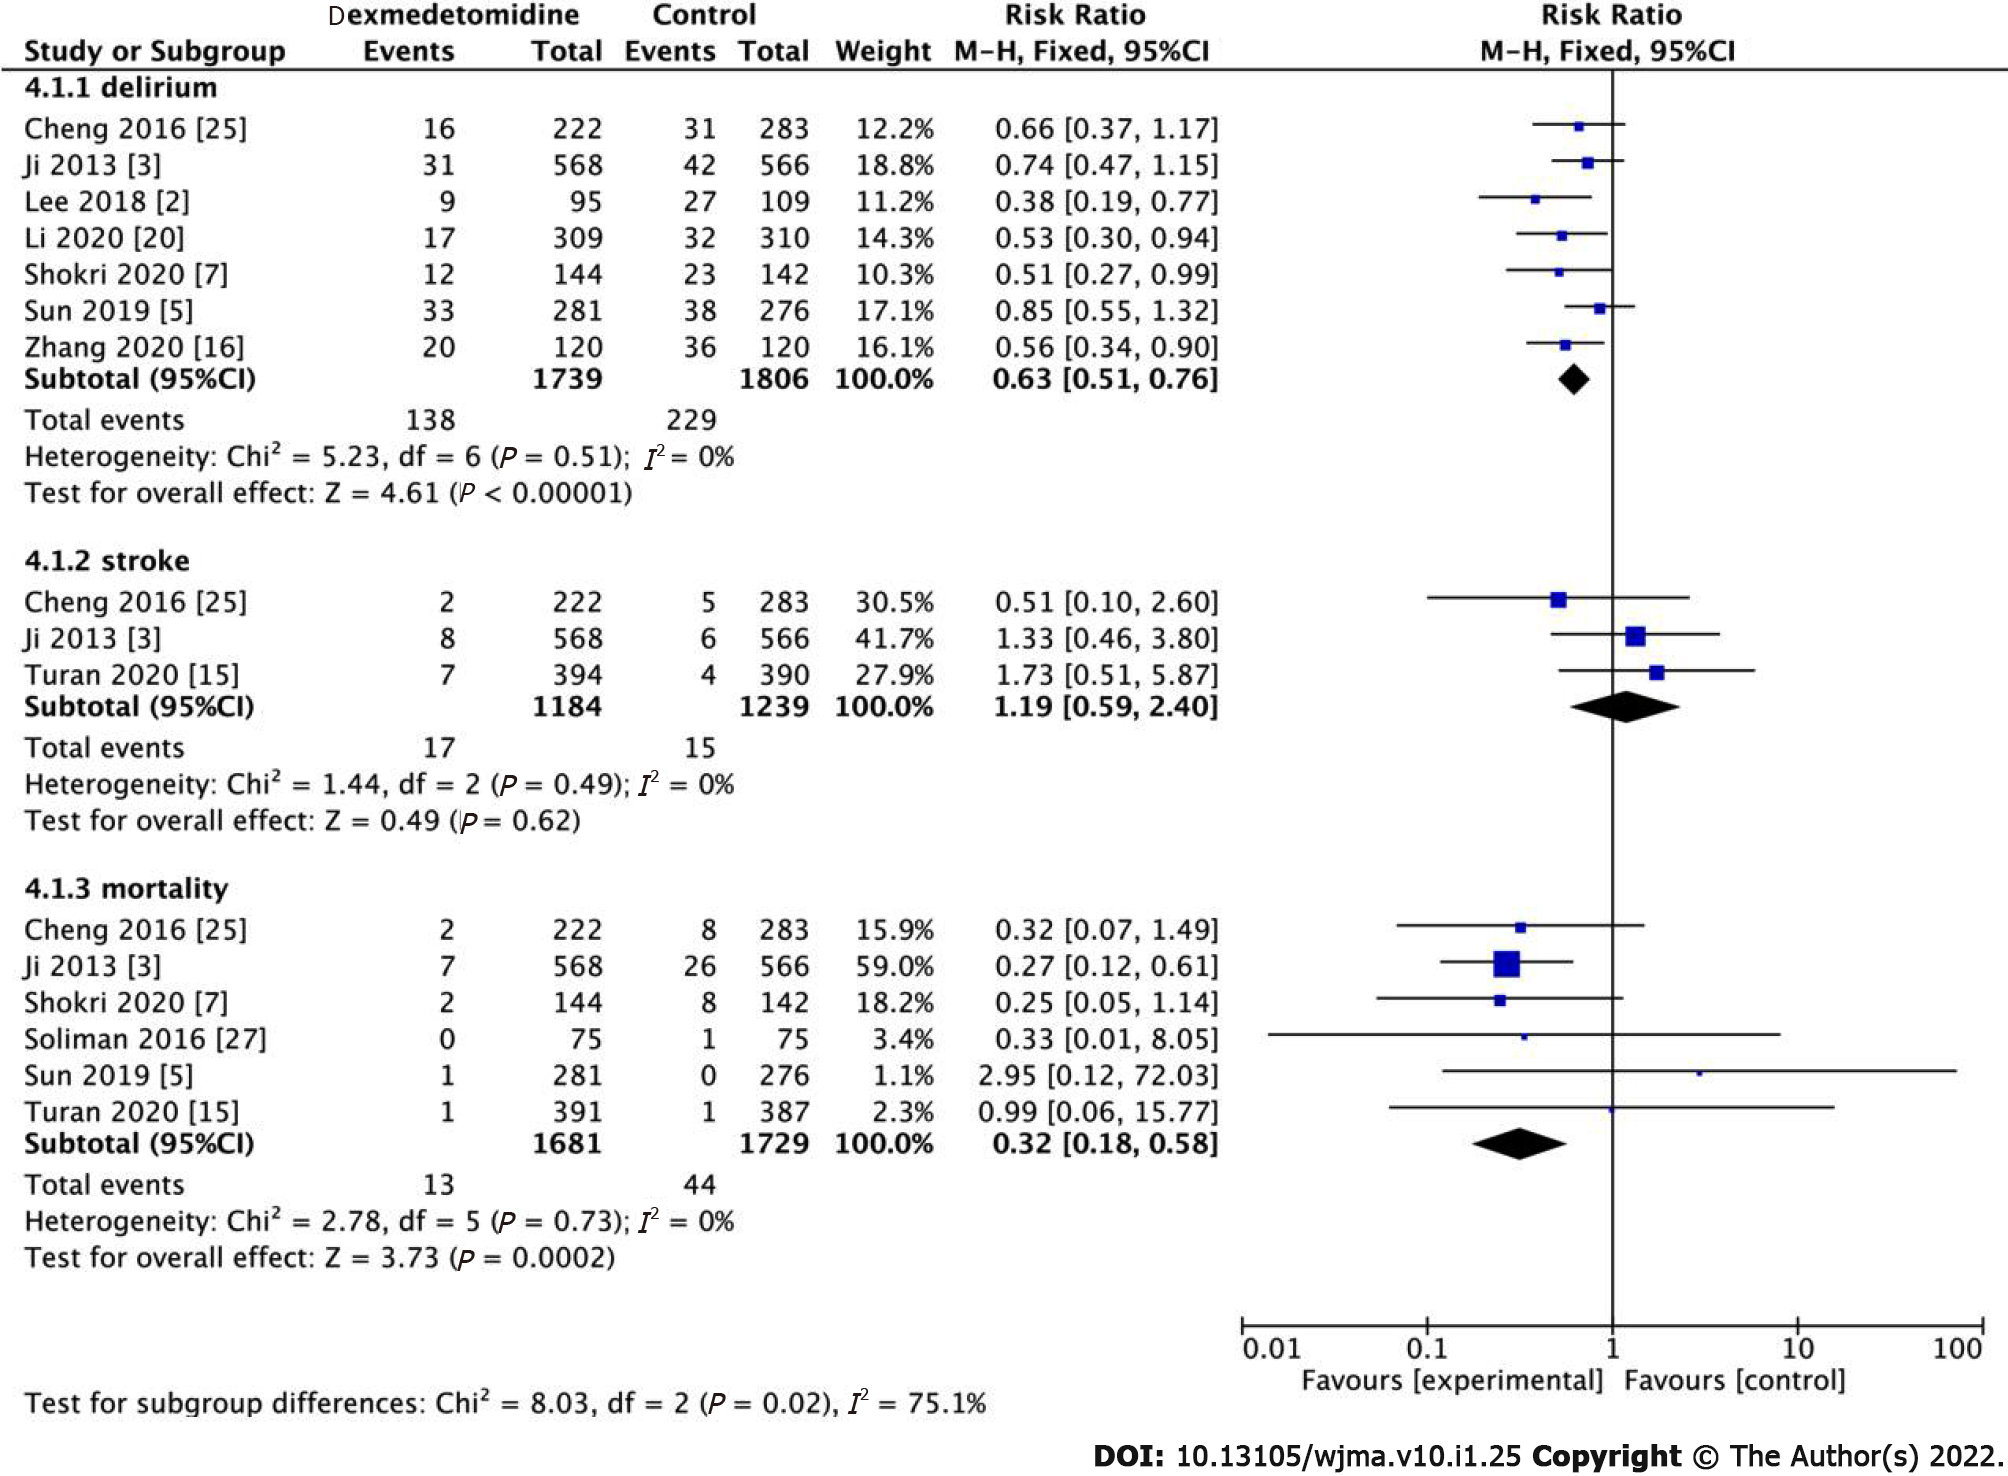
Figure 7
Meta-analysis of postoperative delirium, stroke, and mortality (In-hospital).
POD: Postoperative delirium.
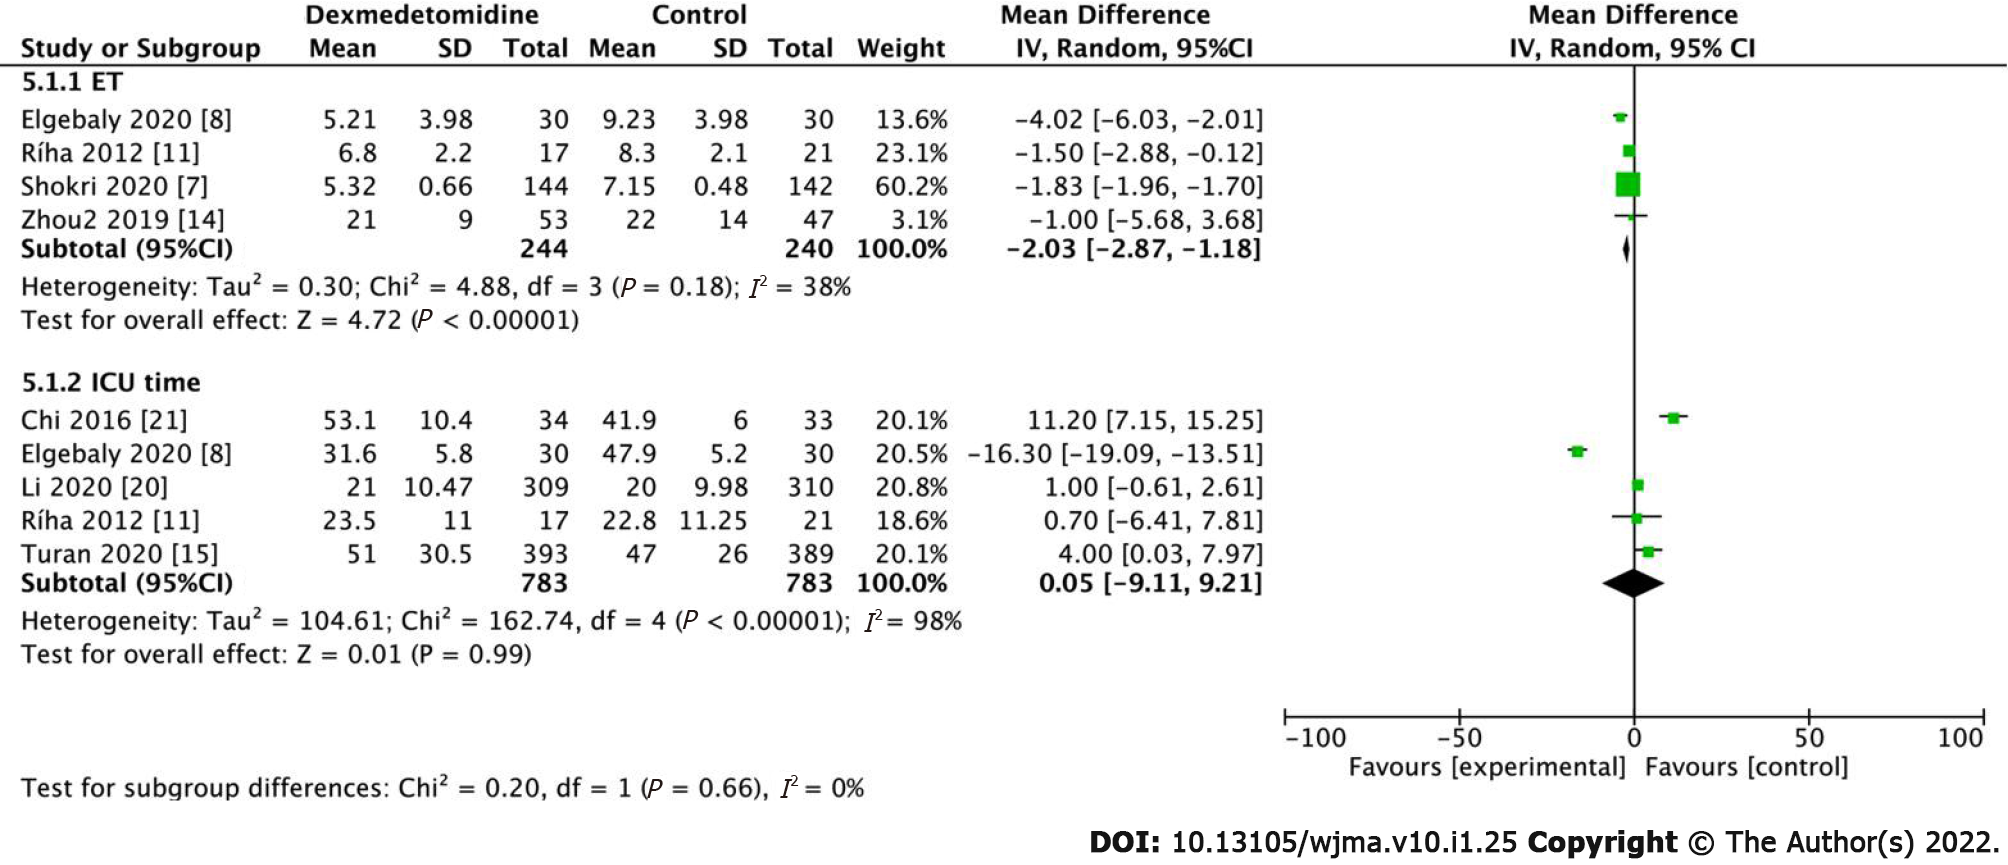
Figure 8 Meta-analysis of extubation time (h) and intensive care unit length of stay (h).
ET: Extubation time; ICU: Intensive care unit.
- Citation: Yang YL, Hu BJ, Yi J, Pan MZ, Xie PC, Duan HW. Effects of dexmedetomidine on cardioprotection and other postoperative complications in elderly patients after cardiac and non-cardiac surgerie. World J Meta-Anal 2022; 10(1): 25-36
- URL: https://www.wjgnet.com/2308-3840/full/v10/i1/25.htm
- DOI: https://dx.doi.org/10.13105/wjma.v10.i1.25


