©2014 Baishideng Publishing Group Inc.
World J Methodol. Jun 26, 2014; 4(2): 46-58
Published online Jun 26, 2014. doi: 10.5662/wjm.v4.i2.46
Published online Jun 26, 2014. doi: 10.5662/wjm.v4.i2.46
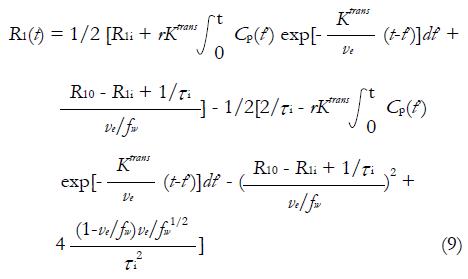
Math 6 Math(A1).
Math 7 Math(A1).
Figure 1 A sketch of two-compartment model.
Ktrans: Transport rate of CA from blood plasma to EES; kep: Transport rate of CA from EES to blood plasma; υe: Volume fraction of EES. The three quantities are related by kep = Ktrans/υe. EES: Extravascular-extracellular space.
Math 8 Math(A1).
Math 9 Math(A1).
Math 10 Math(A1).
Math 11 Math(A1).
Math 12 Math(A1).
Math 13 Math(A1).
Figure 2 A hierarchical relationship diagram of the introduced pharmacokinetic models.
DP: Distributed-parameter; FXR: Fast-exchange regime.
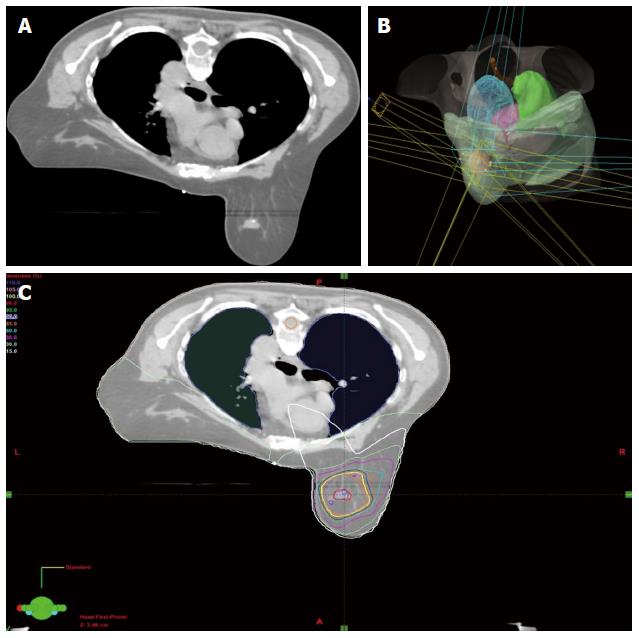
Figure 3 Radiation treatment planning.
A: A computed tomography simulation image for a selected patient breast stereotactic body radiosurgery (SBRT) treatment plan; B: 3D planned beams view for the selected patient’s SBRT plan; C: Calculated conformal dose distribution of the selected patient’s SBRT plan.
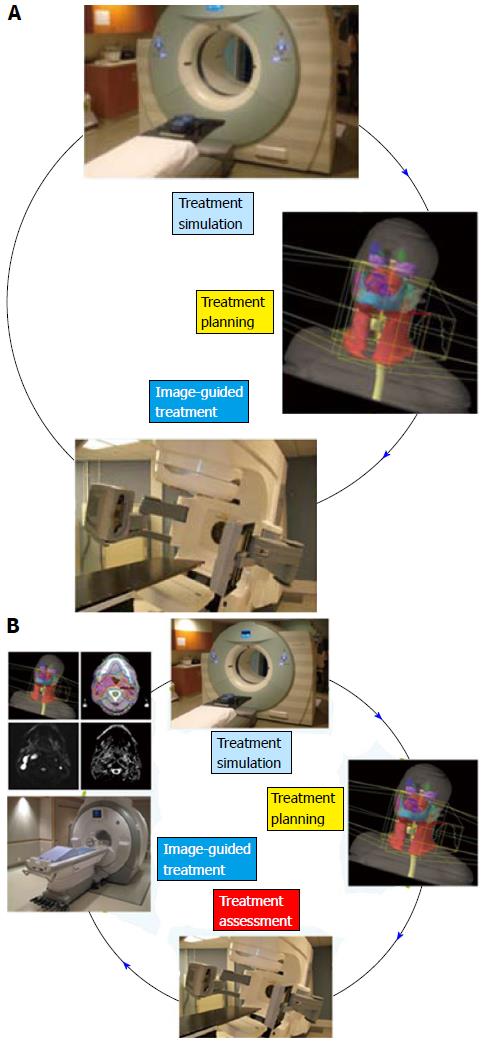
Figure 4 Conventional radiation treatment workflow.
The proposed workflow (A) with treatment assessment component (B). Radiation treatment assessment can be used in plan optimization based on understanding towards biological response.
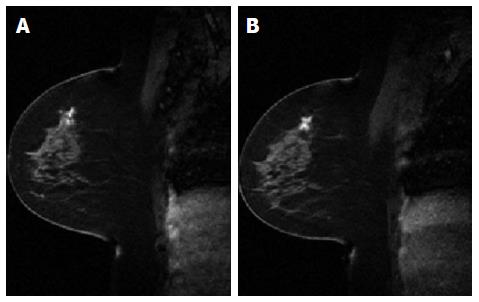
Figure 5 A comparison between pre-treatment dynamic contrast-enhanced magnetic resonance imaging image (A) and post-treatment dynamic contrast-enhanced magnetic resonance imaging image (B).
- Citation: Wang CH, Yin FF, Horton J, Chang Z. Review of treatment assessment using DCE-MRI in breast cancer radiation therapy. World J Methodol 2014; 4(2): 46-58
- URL: https://www.wjgnet.com/2222-0682/full/v4/i2/46.htm
- DOI: https://dx.doi.org/10.5662/wjm.v4.i2.46


