
















Copyright: ©Author(s) 2026.
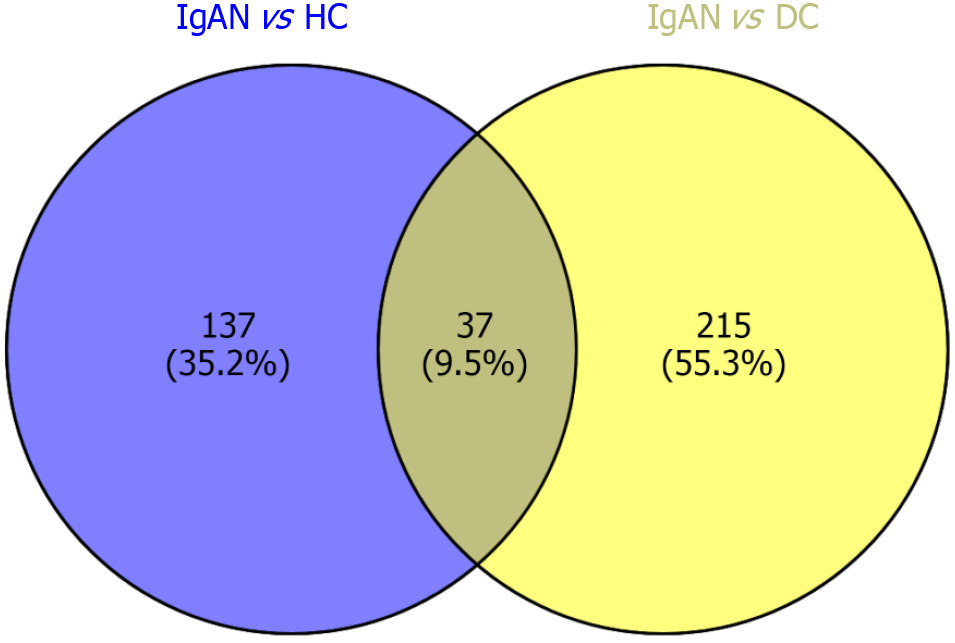
Figure 1 Venn plot: 137 microRNAs significantly differed between immunoglobulin A nephropathy cases and healthy controls.
Of 215 microRNAs significantly differed between immunoglobulin A nephropathy cases and disease controls. It was found that 37 microRNAs commonly differentiated immunoglobulin A nephropathy cases from healthy controls and disease controls. IgAN: Immunoglobulin A nephropathy; HC: Healthy controls; DC: Disease controls.
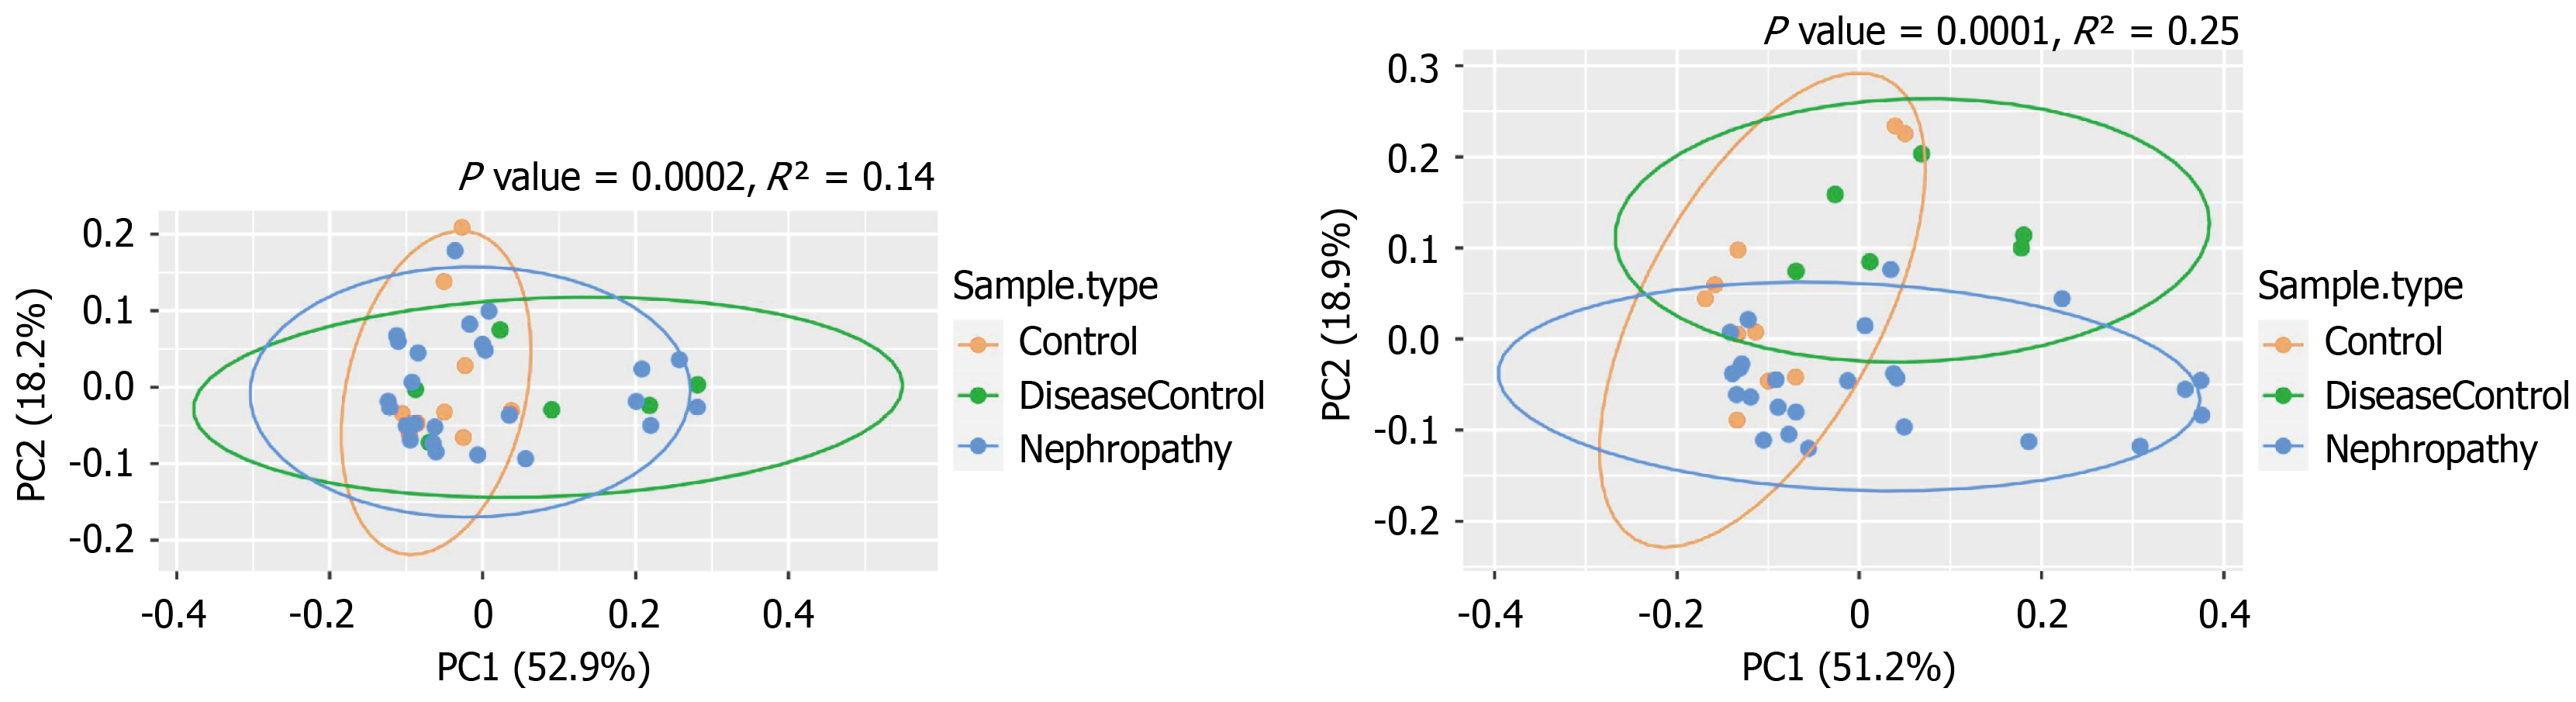
Figure 2 Principal component analysis of 37 microRNA profiles shows that they can significantly differentiate between immunoglobulin A nephropathy cases, disease controls, and healthy controls compared to all the 798 microRNAs in the nanostring gene panel (left panel).
PC: Principal component.
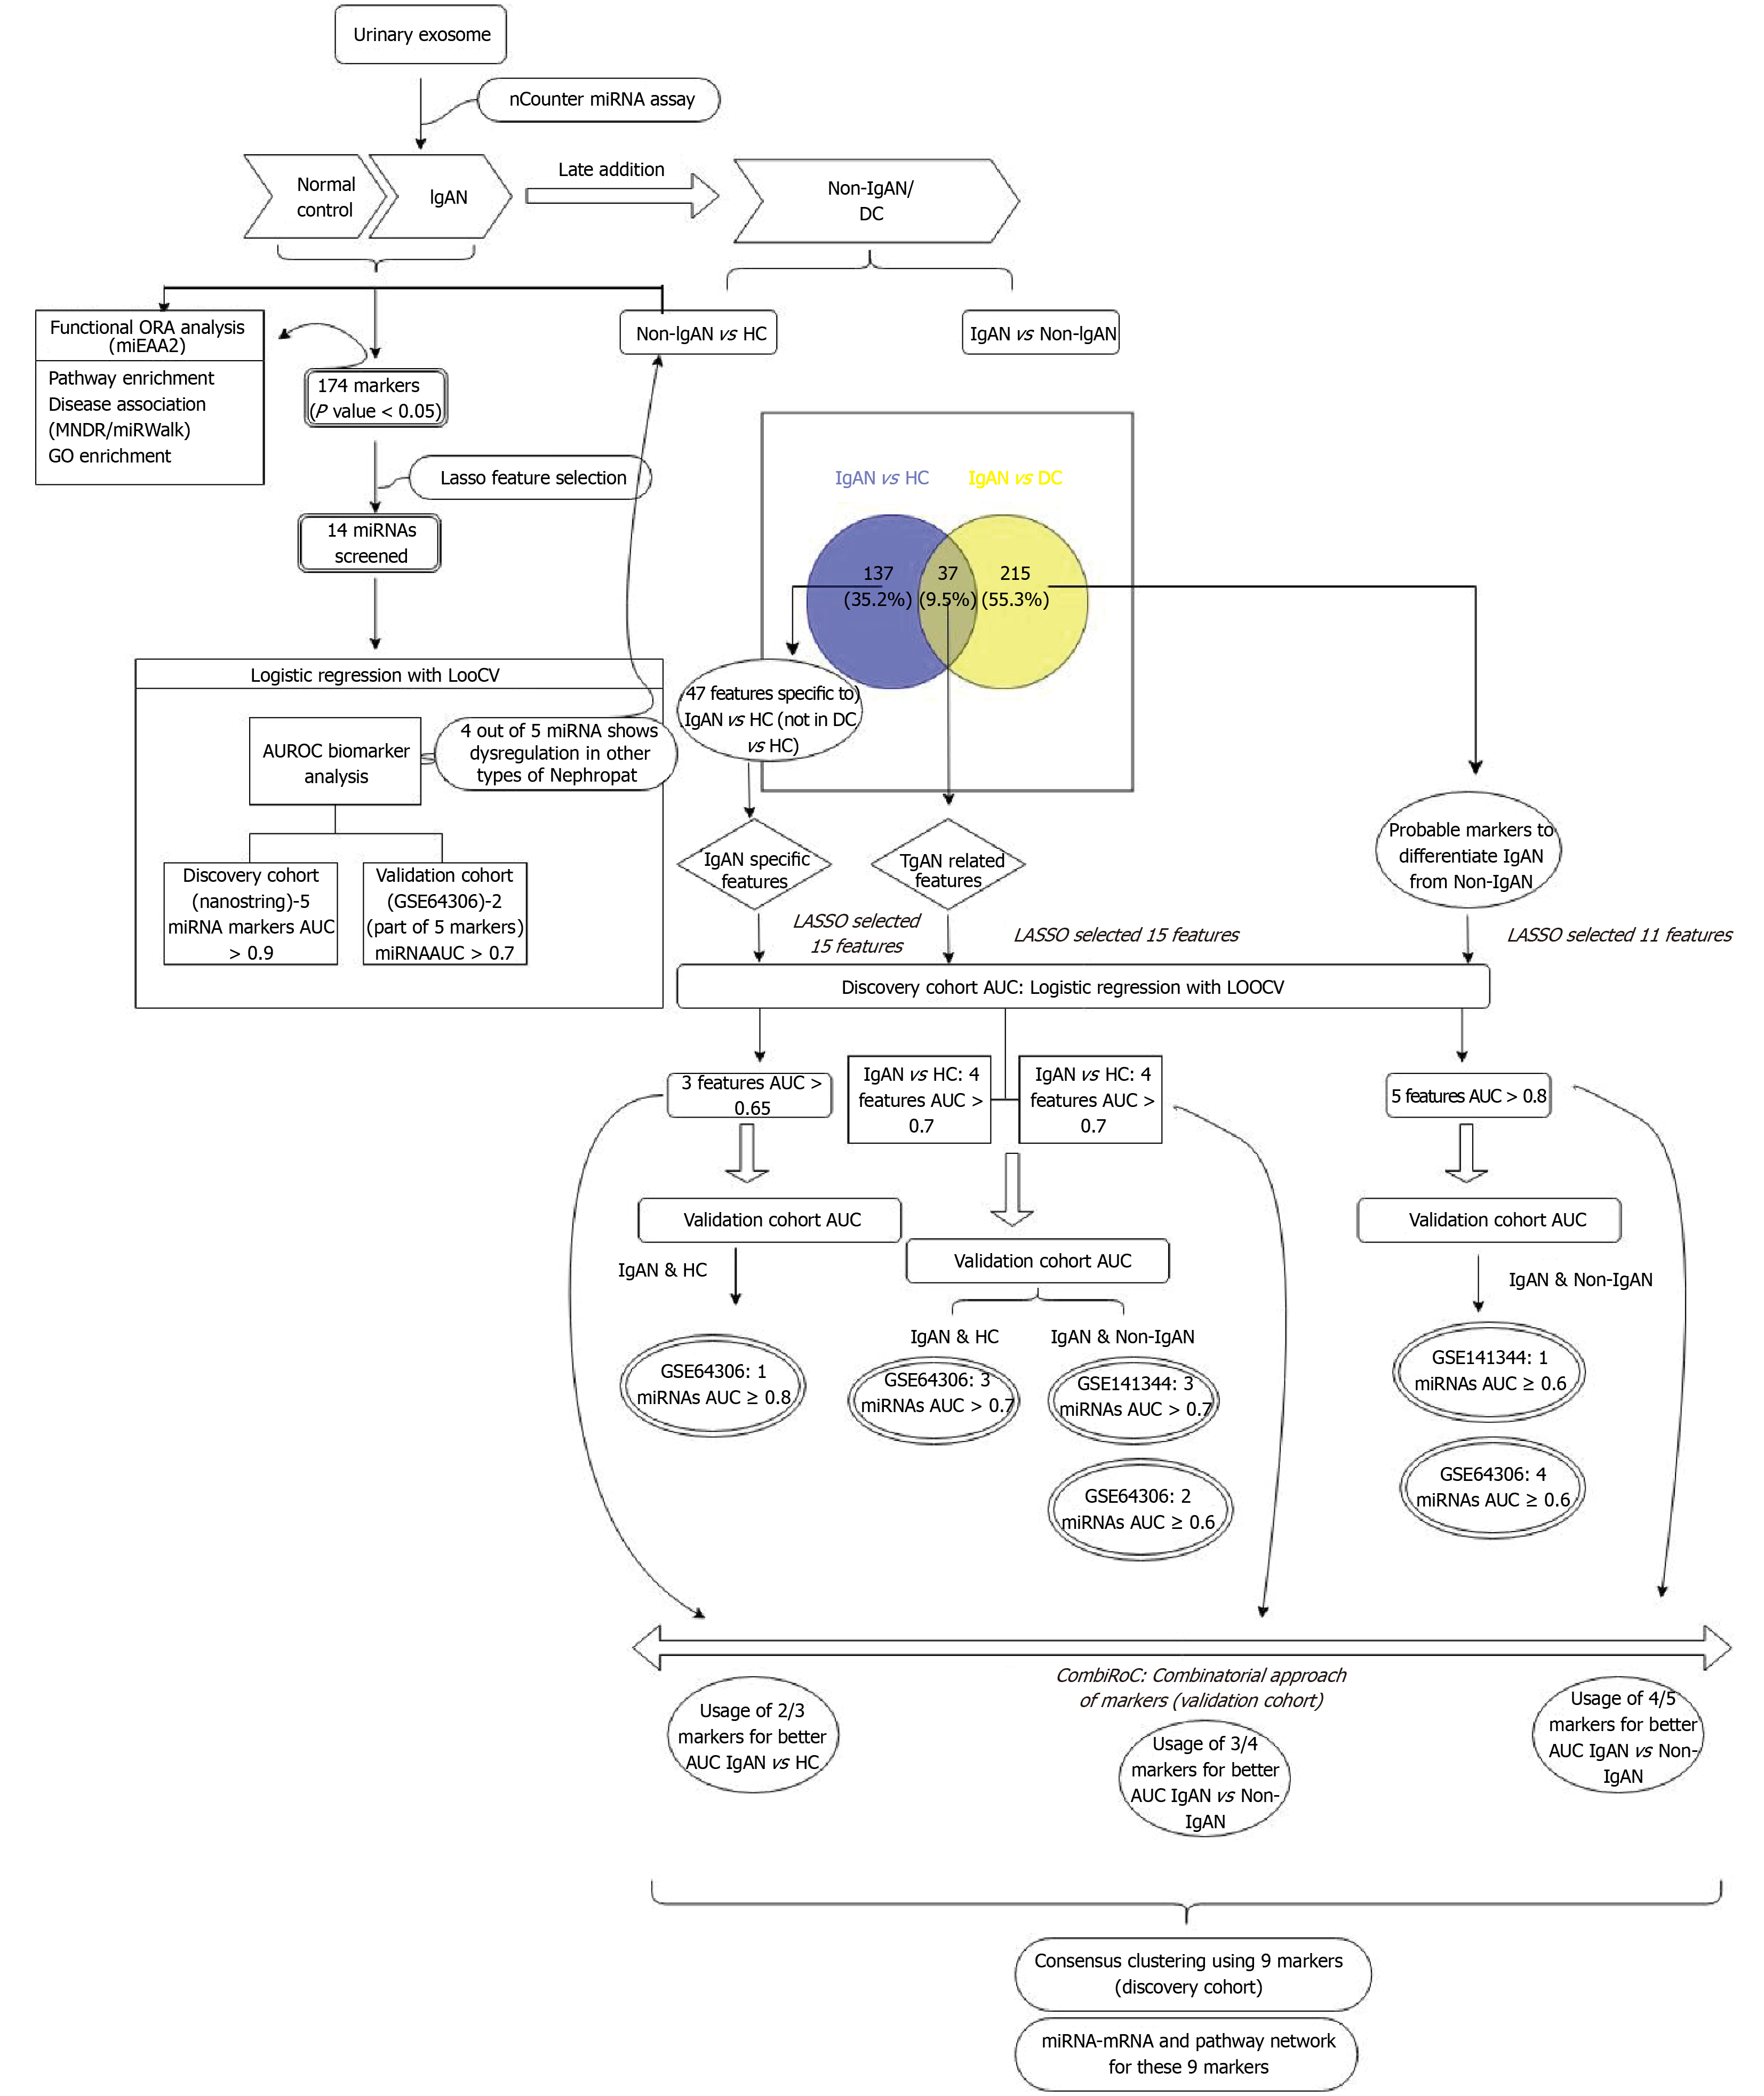
Figure 3 Workflow analysis.
IgAN: Immunoglobulin A nephropathy; HC: Healthy controls; DC: Disease controls; miRNA: Micro ribonucleic acid; ORA: Over-representation analysis; MNDR: Mammal non-coding RNA-disease repository; LOOCV: Leave-one-out cross-validation; AUROC: Area under the receiver operating characteristic curve; LASSO: Least absolute shrinkage and selection operator; AUC: Area under the curve; ROC: Receiver operator curve.
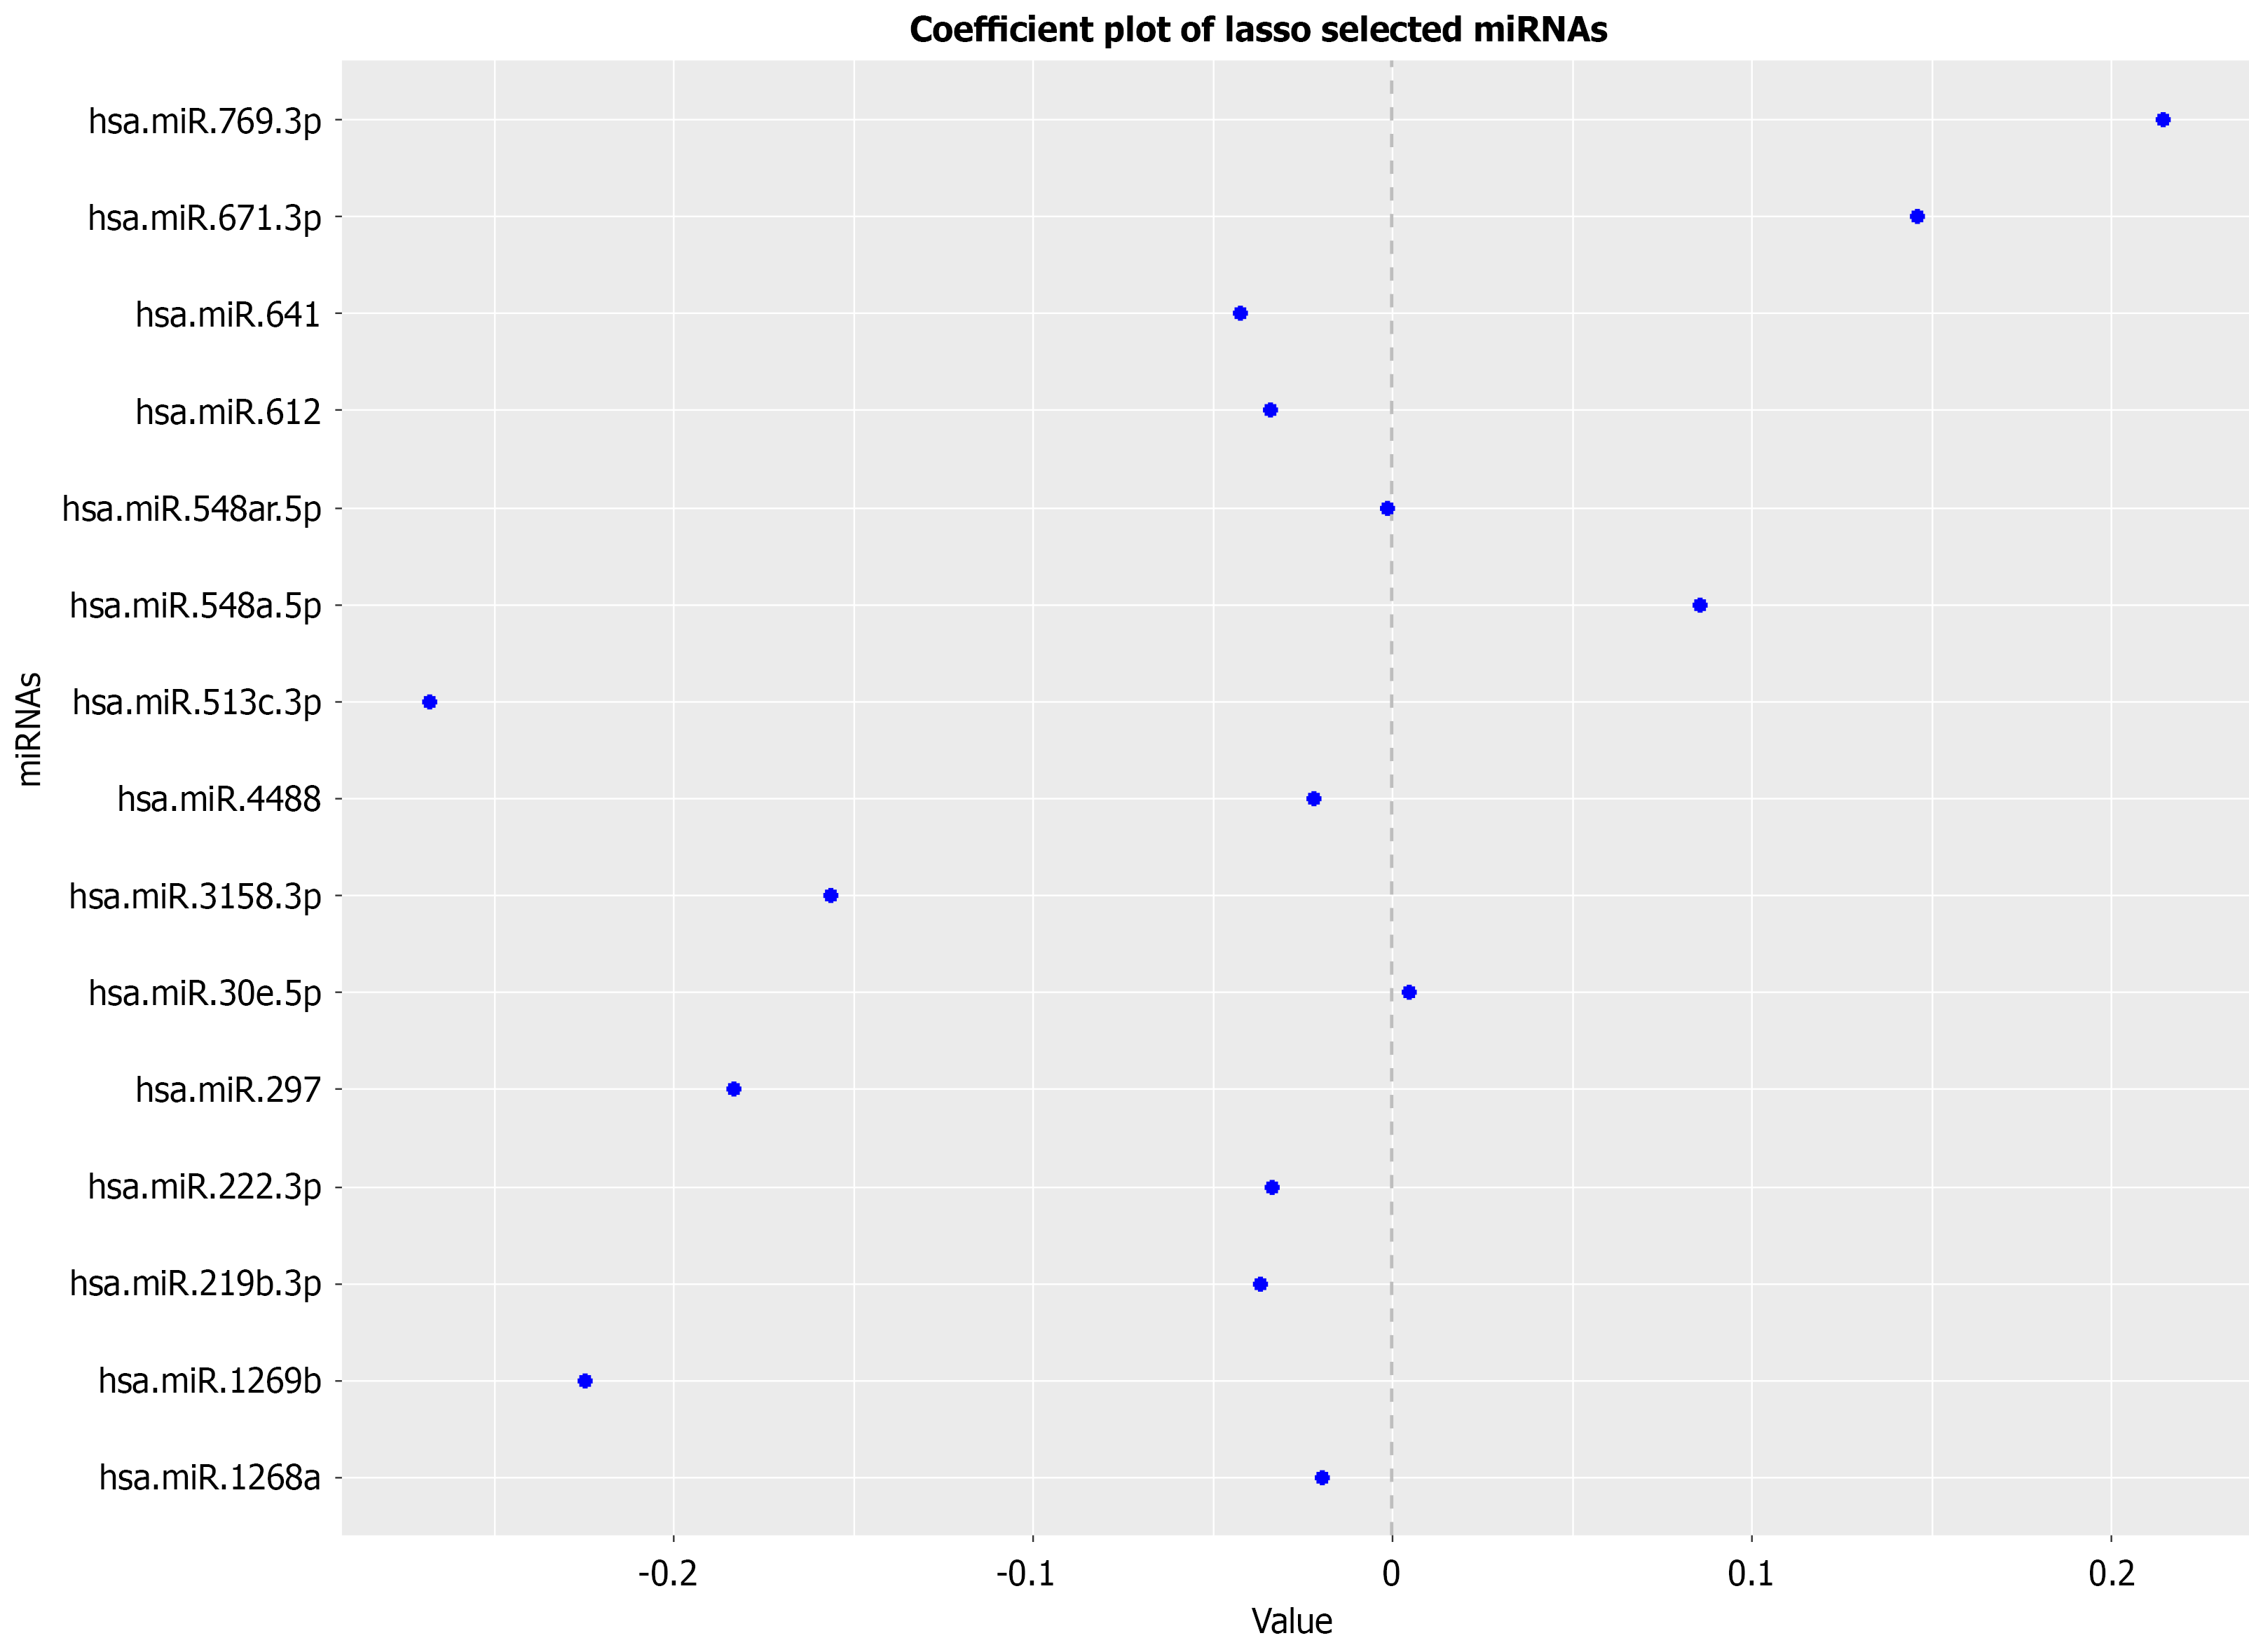
Figure 4 Least absolute shrinkage and selection operator coefficient plot showing 15 microRNAs that can differentiate immunoglobulin A nephropathy cases from healthy controls.
miRNA: MicroRNA.
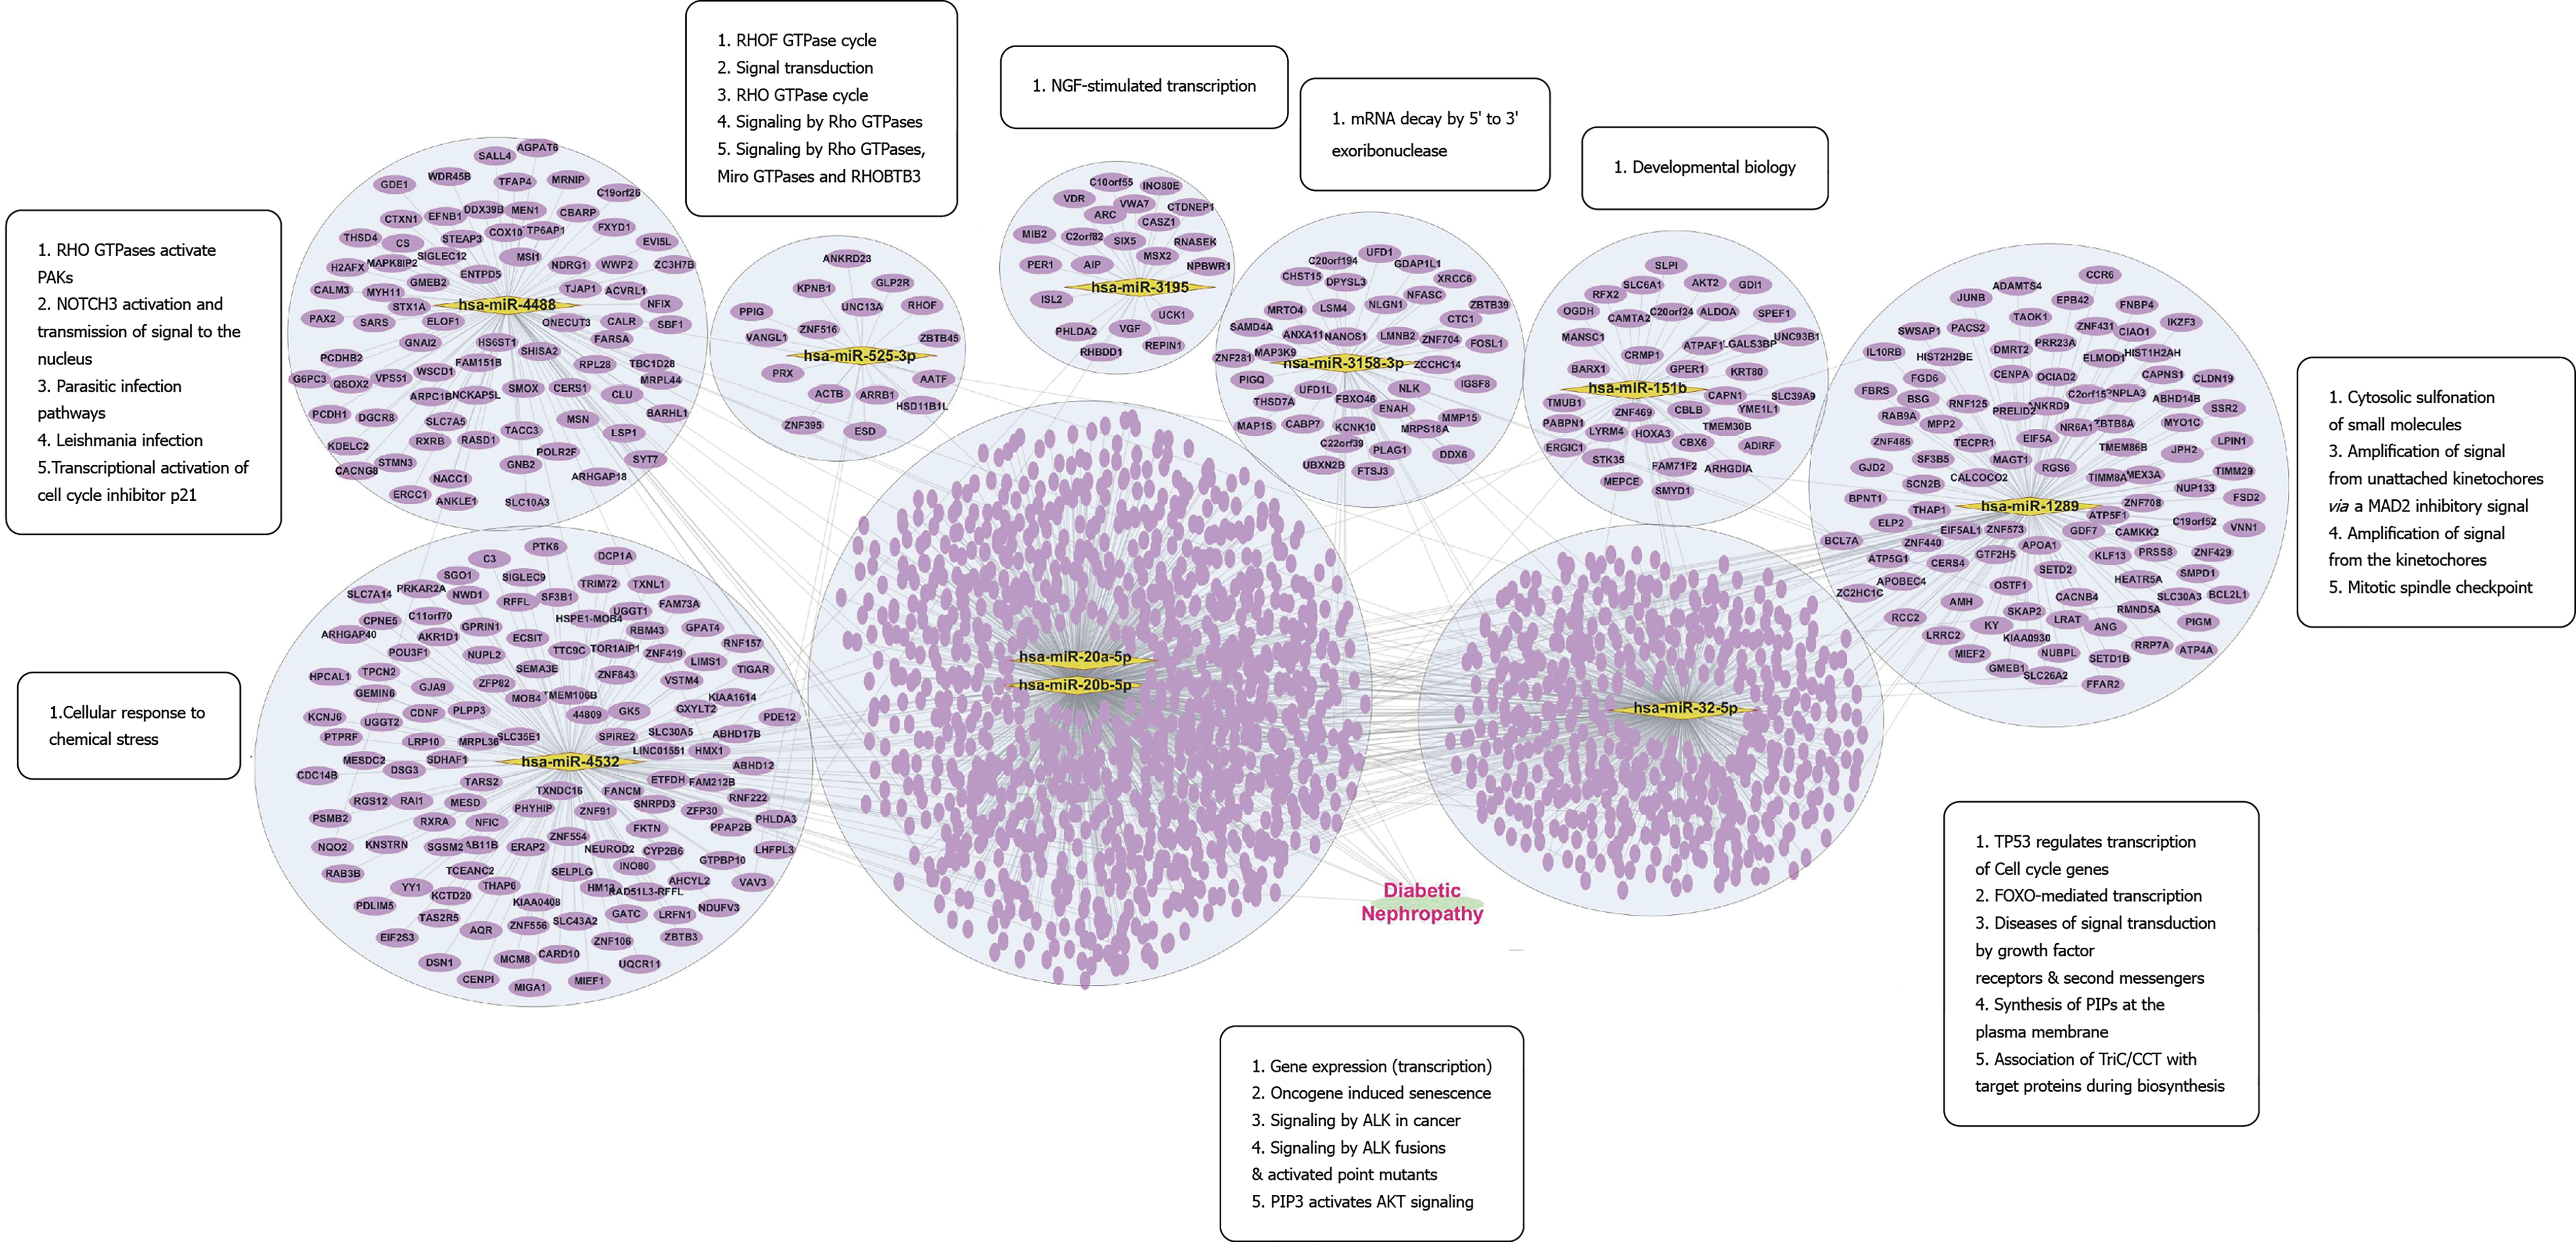
Figure 5
Shows the network of nine microRNAs (yellow), pathways enriched (in boxes), experimentally targeted messenger RNA (purple oval), and disease association (in pink).
- Citation: Shankar M, Moorthy M, Shetty A, Gurusiddaiah SC. Potential diagnostic role of urinary exosomal microRNAs in immunoglobulin A nephropathy: A case-control study. World J Nephrol 2026; 15(3): 119882
- URL: https://www.wjgnet.com/2220-6124/full/v15/i3/119882.htm
- DOI: https://dx.doi.org/10.5527/wjn.119882