Copyright
©The Author(s) 2025.
World J Transplant. Dec 18, 2025; 15(4): 108791
Published online Dec 18, 2025. doi: 10.5500/wjt.v15.i4.108791
Published online Dec 18, 2025. doi: 10.5500/wjt.v15.i4.108791
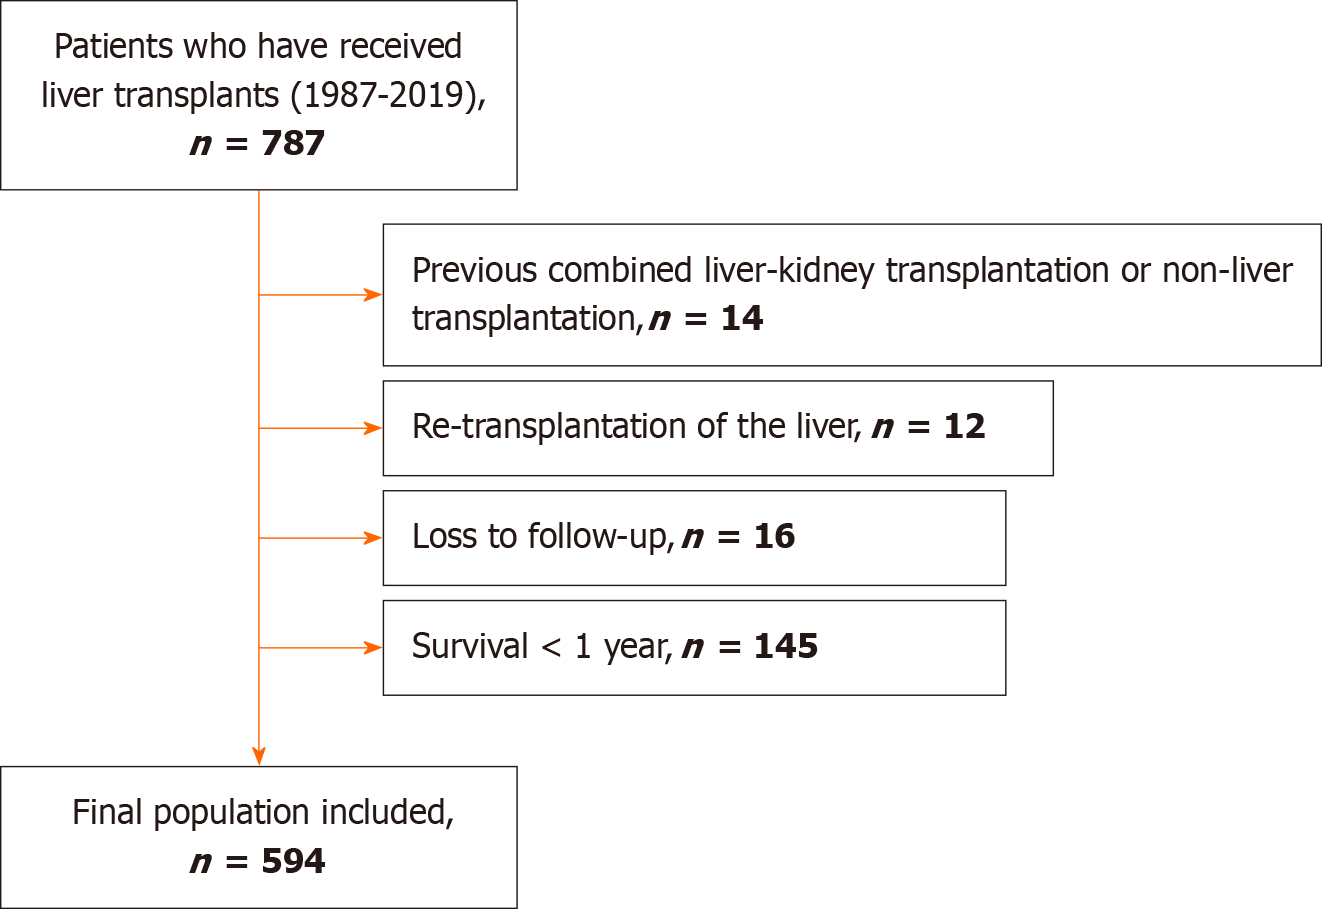
Figure 1 Flow diagram of the liver transplant recipients enrolled in the study.
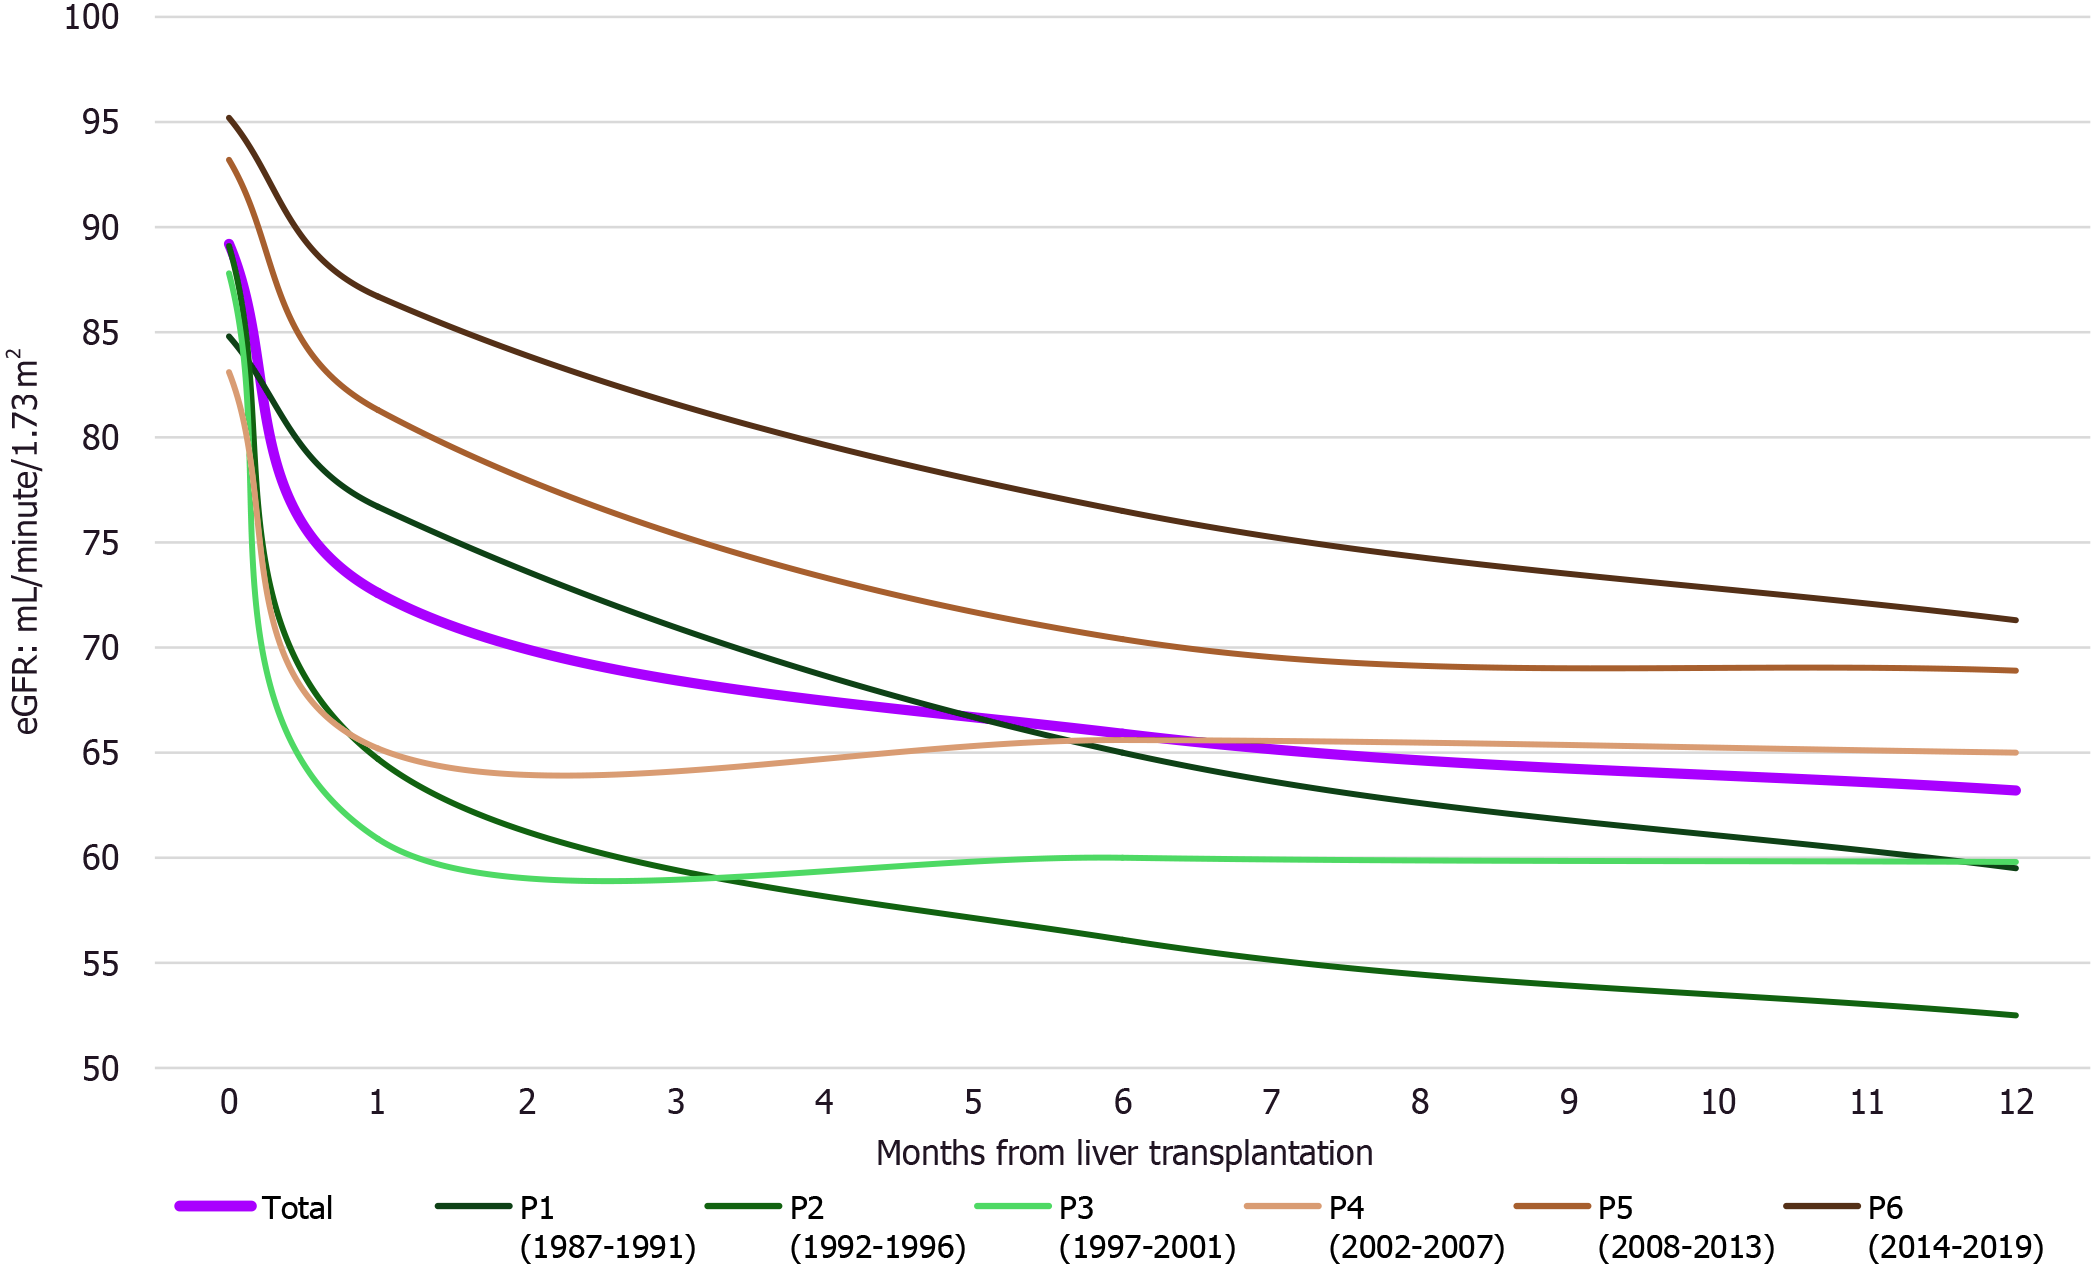
Figure 2 Evolution of estimated glomerular filtration rate in each period of liver transplantation.
eGFR: Estimated glomerular filtration rate.
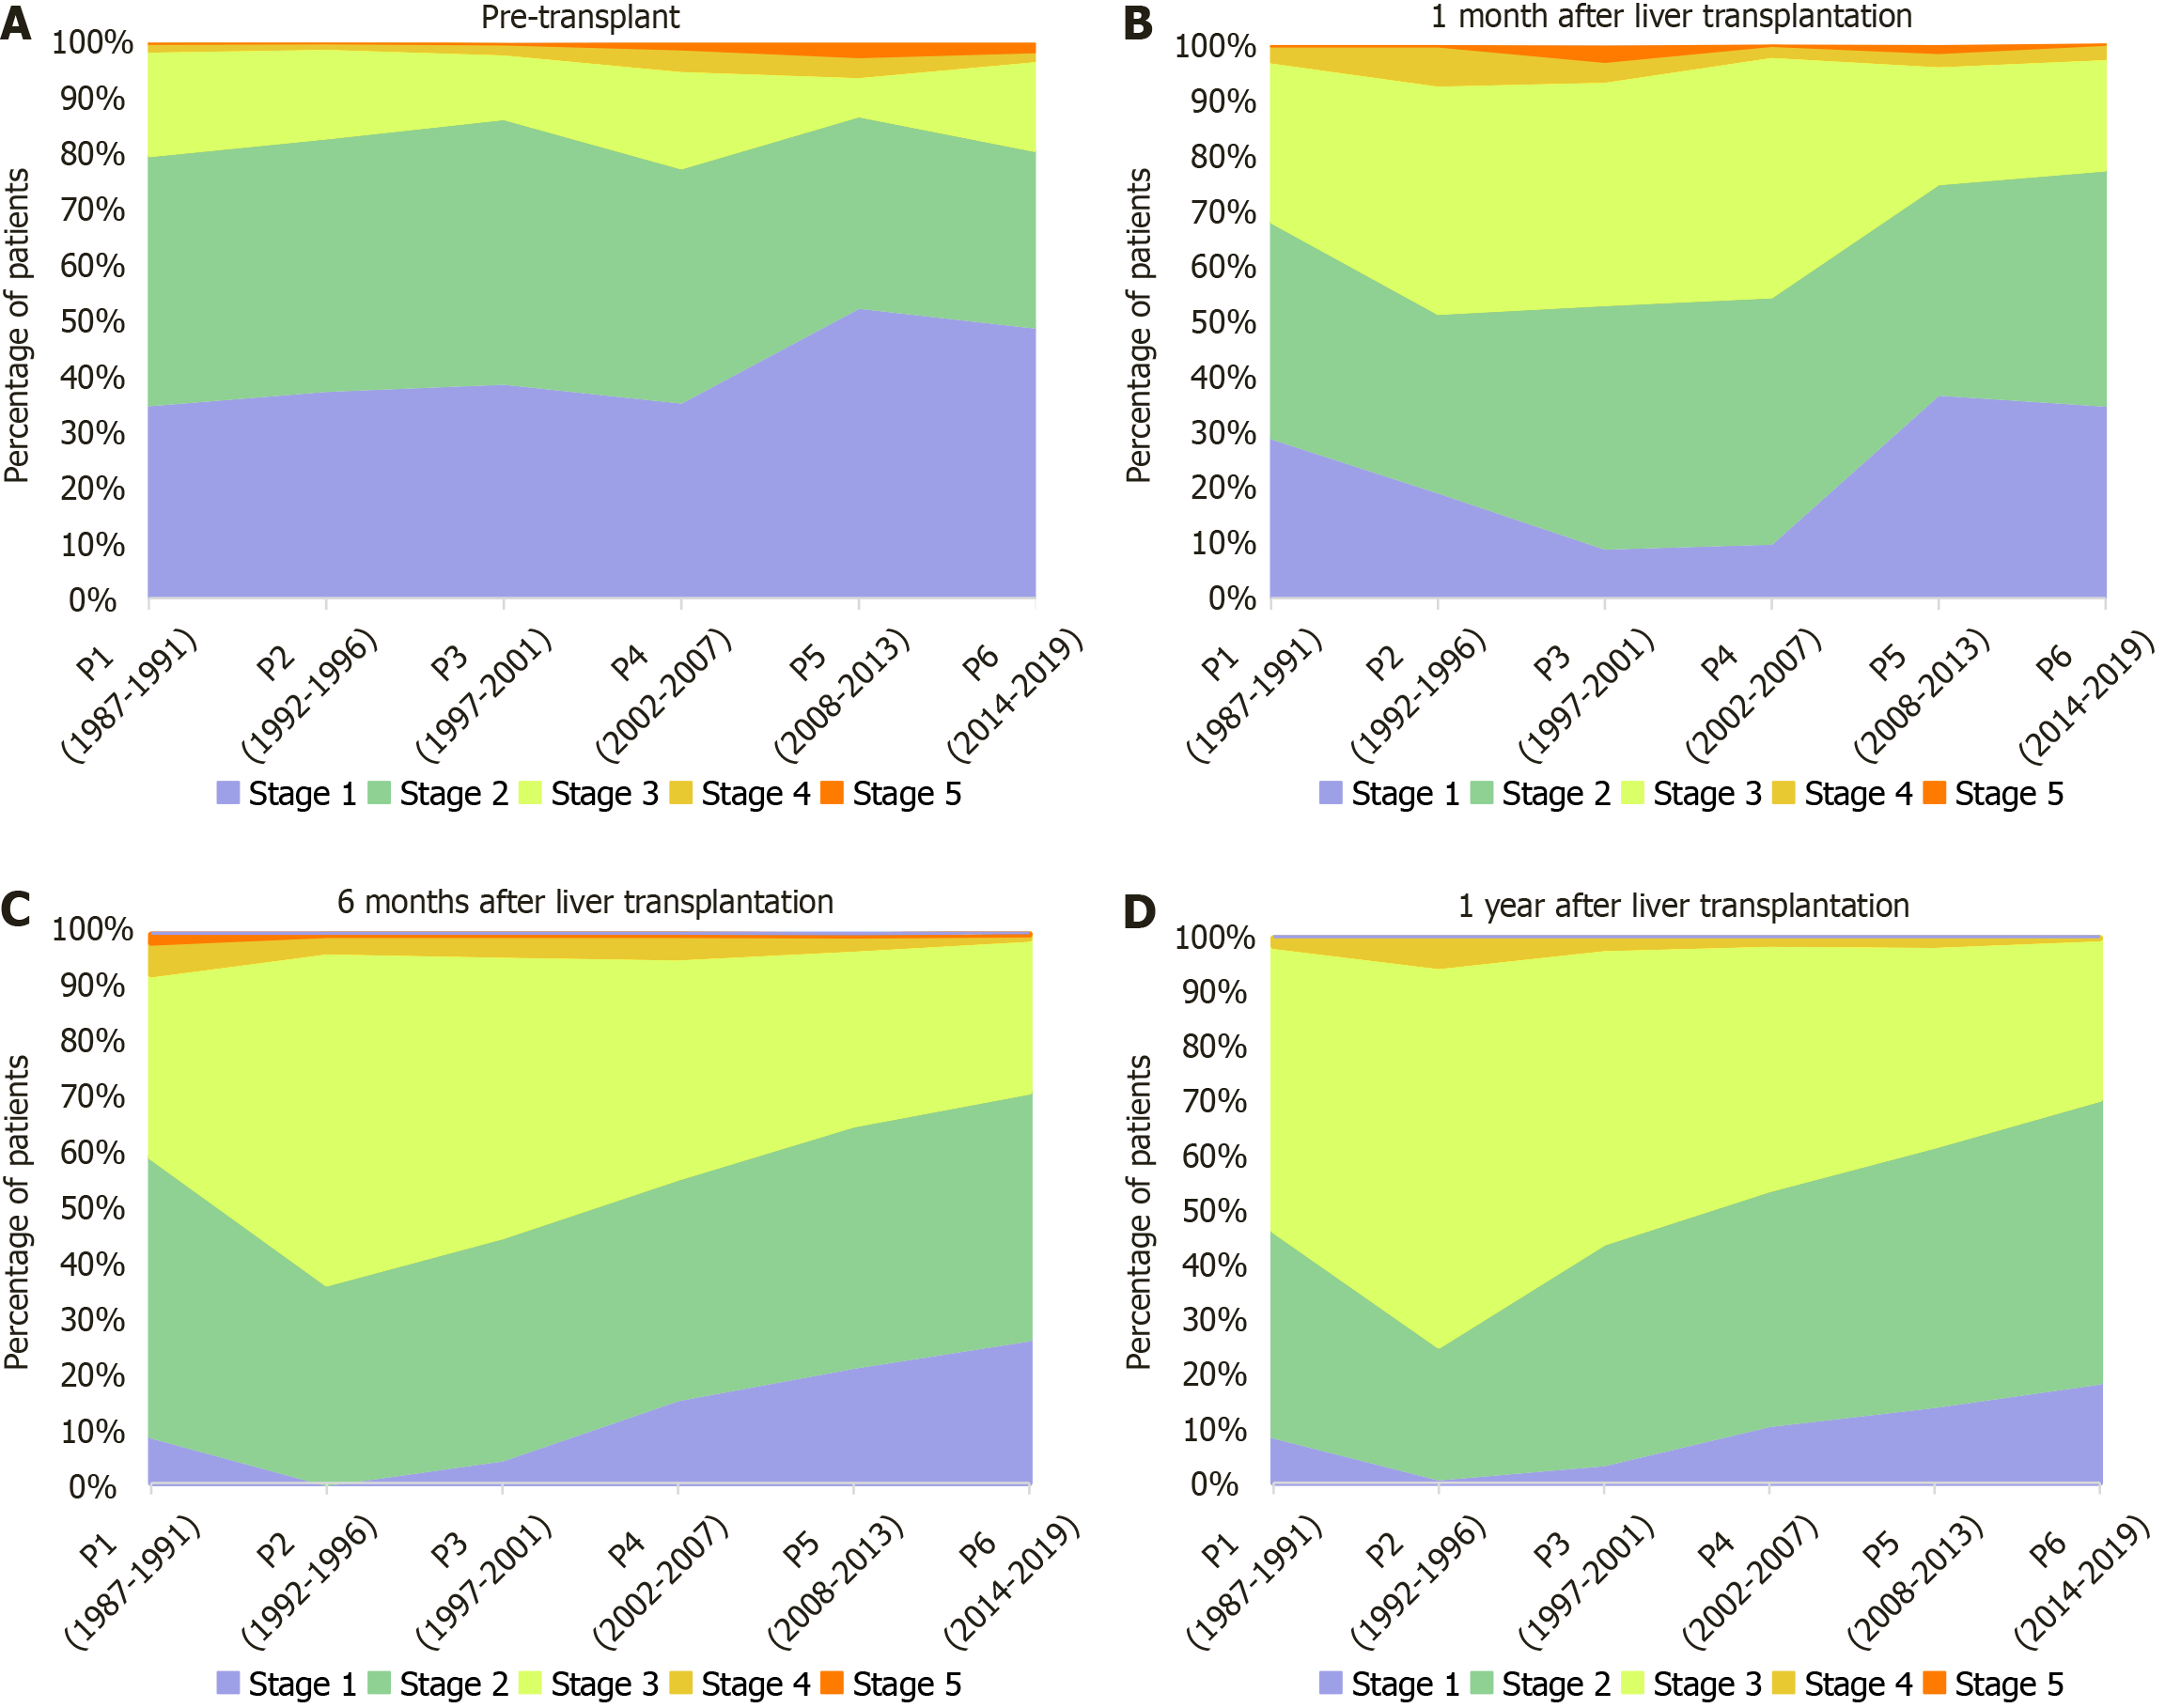
Figure 3 Comparison of the glomerular filtration stages in each period of liver transplantation.
Percentage of patients presenting with each of the five glomerular filtration rates among the different study periods is shown at four different time points during the first year. A: Before liver transplant (LT); B: 1 month post-LT; C: 6 months post-LT; D: 1 year post-LT.
Figure 4 Evolution of renal dysfunction between the tacrolimus group and the cyclosporine A group during the first year post-trans
- Citation: Muñoz-Serrano A, Citores MJ, Gutiérrez-Villanueva A, Moreno-Torres V, López-Ibor JV, Vicente N, Cuervas-Mons V. Chronic kidney disease at one year after liver transplantation: Role of changes in immunosuppression over three decades. World J Transplant 2025; 15(4): 108791
- URL: https://www.wjgnet.com/2220-3230/full/v15/i4/108791.htm
- DOI: https://dx.doi.org/10.5500/wjt.v15.i4.108791


