Copyright
©The Author(s) 2025.
World J Transplant. Dec 18, 2025; 15(4): 108728
Published online Dec 18, 2025. doi: 10.5500/wjt.v15.i4.108728
Published online Dec 18, 2025. doi: 10.5500/wjt.v15.i4.108728
Figure 1 Kaplan-Meier curves for patient survival in long and short dialysis duration (log-rank test, P < 0.
001). The solid line represents Group short-term dialysis, and the dotted line represents Group long-term dialysis. LTD: Long-term dialysis; STD: Short-term dialysis.
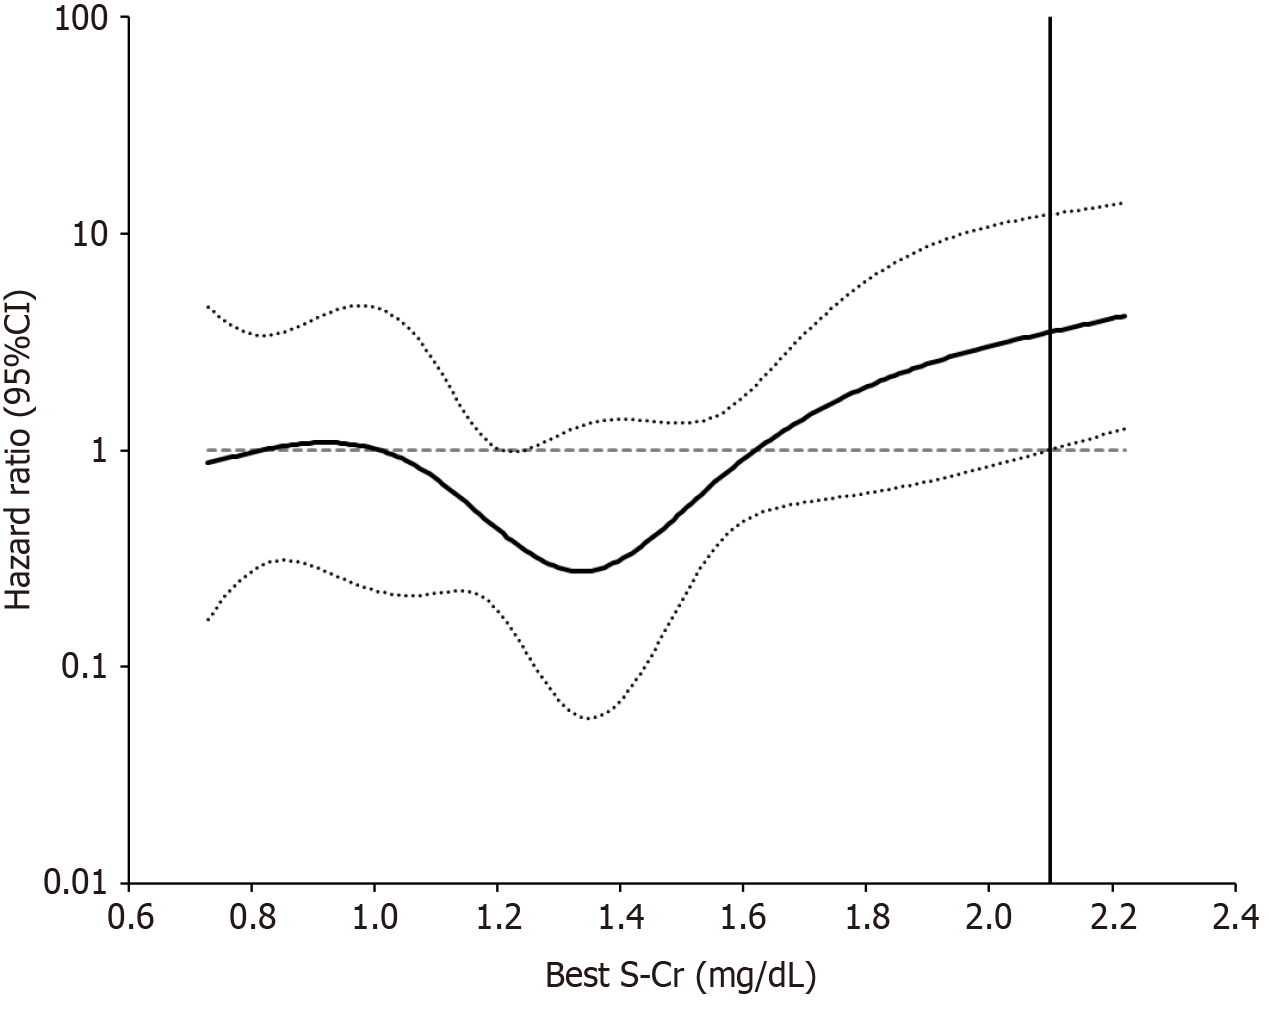
Figure 2 Effect of best S-Cr level on death after kidney transplantation.
Cubic spline analysis demonstrating nonlinear effect of best S-Cr level on death after transplantation using Cox regression adjusted for age and post-transplant cardiovascular disease. Hazard ratio by best S-Cr is indicated by solid line and 95% confidence interval is indicated by dotted lines.
- Citation: Shimada H, Iwai T, Uchida J. Clinical impact of early graft function in kidney transplant recipients on long-term dialysis: A retrospective cohort study. World J Transplant 2025; 15(4): 108728
- URL: https://www.wjgnet.com/2220-3230/full/v15/i4/108728.htm
- DOI: https://dx.doi.org/10.5500/wjt.v15.i4.108728


