Copyright
©The Author(s) 2025.
World J Transplant. Dec 18, 2025; 15(4): 107462
Published online Dec 18, 2025. doi: 10.5500/wjt.v15.i4.107462
Published online Dec 18, 2025. doi: 10.5500/wjt.v15.i4.107462
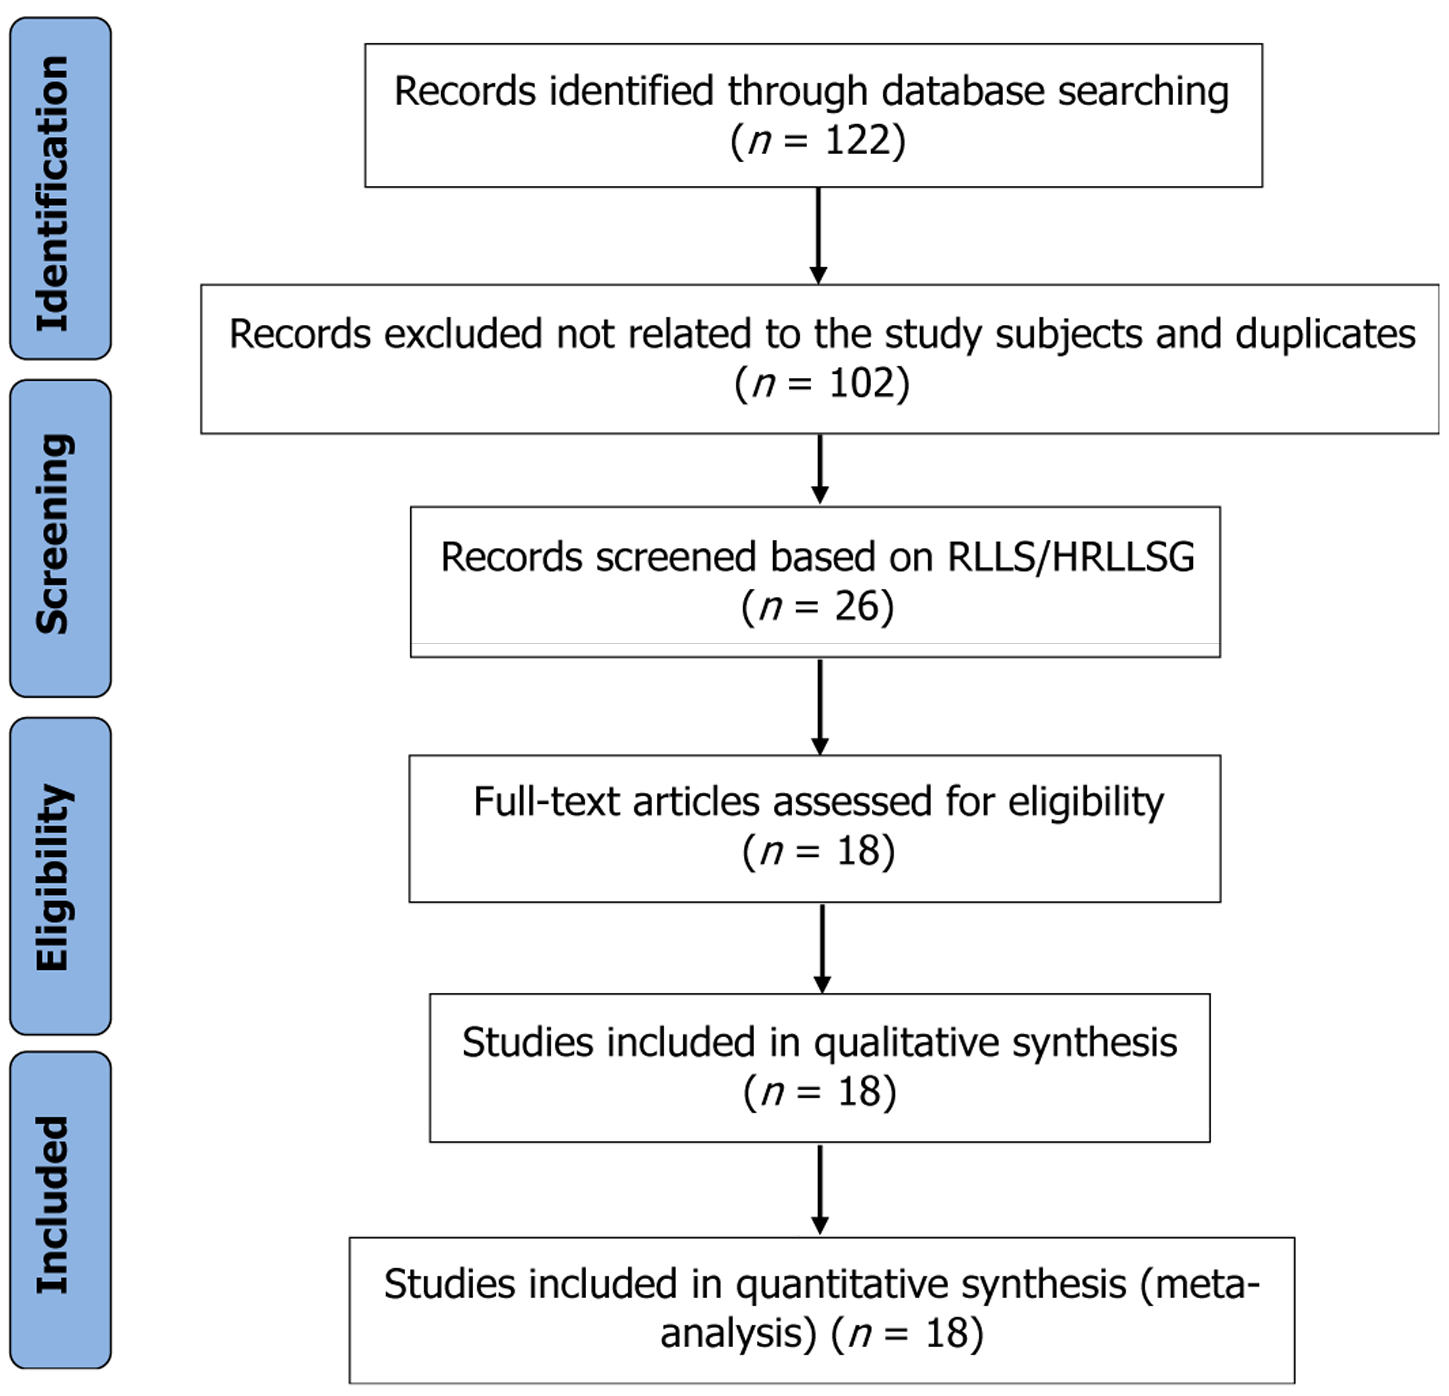
Figure 1 PRISMA flow diagram for search strategies.
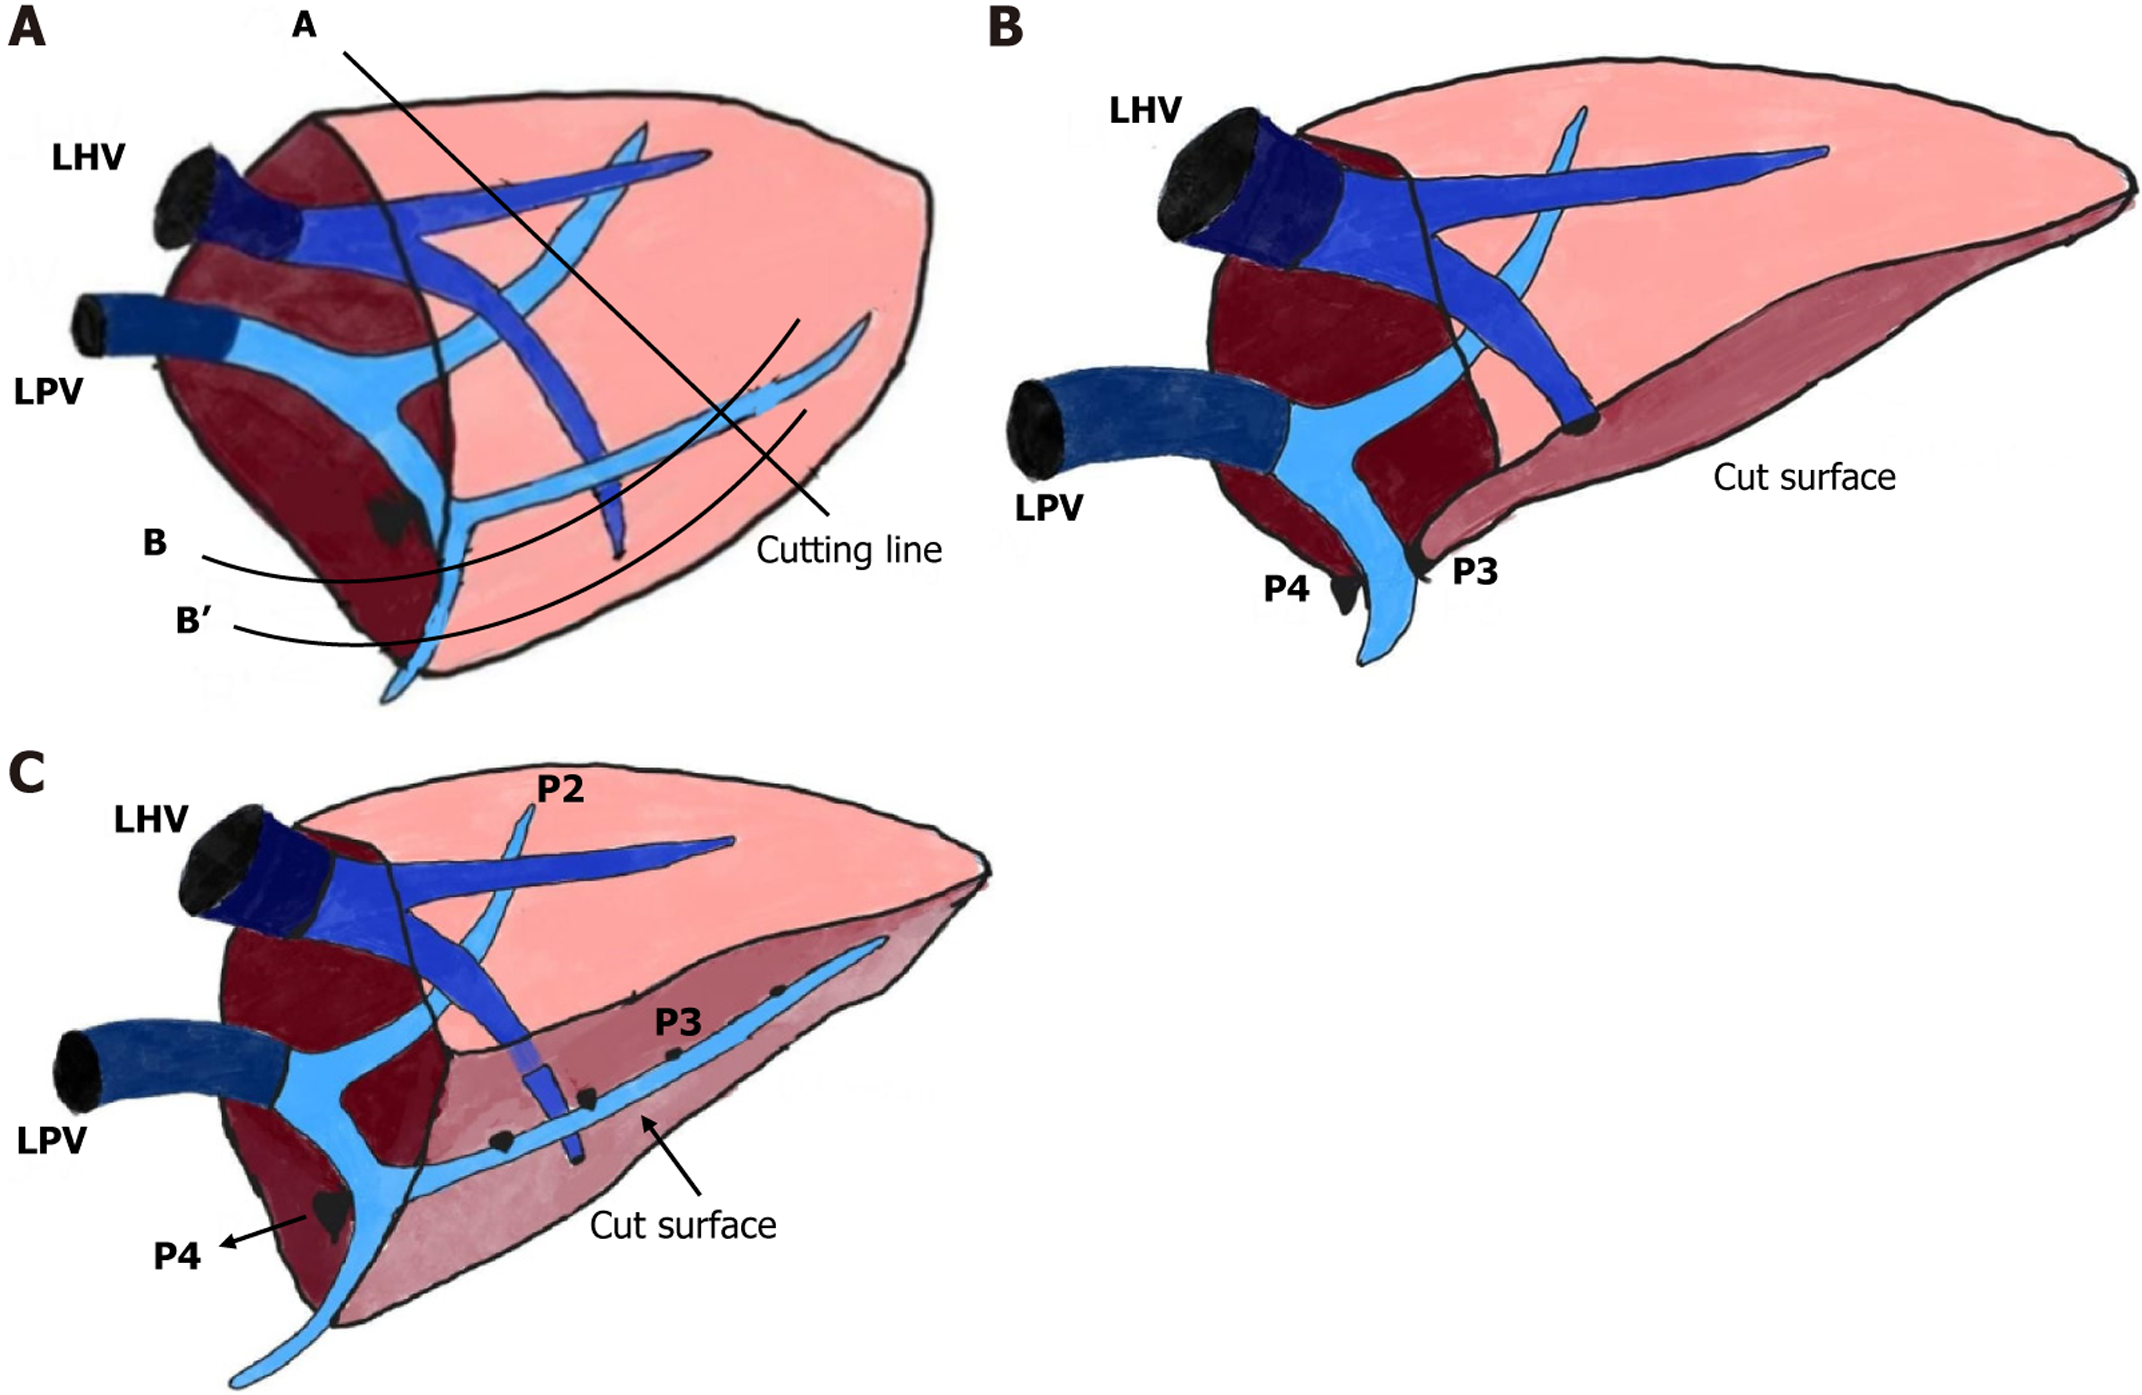
Figure 2 A reduced left lateral segement graft involves excision of the lateral portion.
A: Left lateral segmental graft; Line A – Vertical line drawn on the lateral part of the segment II graft to form “reduced LLS” graft; Line B and B’- Horizontal line on the ventral aspect of the segment III graft to form a “hyper reduced LLS” graft. The cutting surface modified (B or B’) according the weight reduction achieved following reduction through Line A; B: Monosegment II- To create demarcation lines on the surface between S2 and S3, each portal vein (PV) branch feeding S2 and Segment 3 (S3) was exposed independently, and the pertinent PV branches feeding the reduced portion of S3 were blocked; C: P3 preserving modified segment II graft. Resection plain just above the main P3 Located horizontally on the level of the segment III branches of the PV. LHV: Left hepatic vein; LPV: Left portal vein.
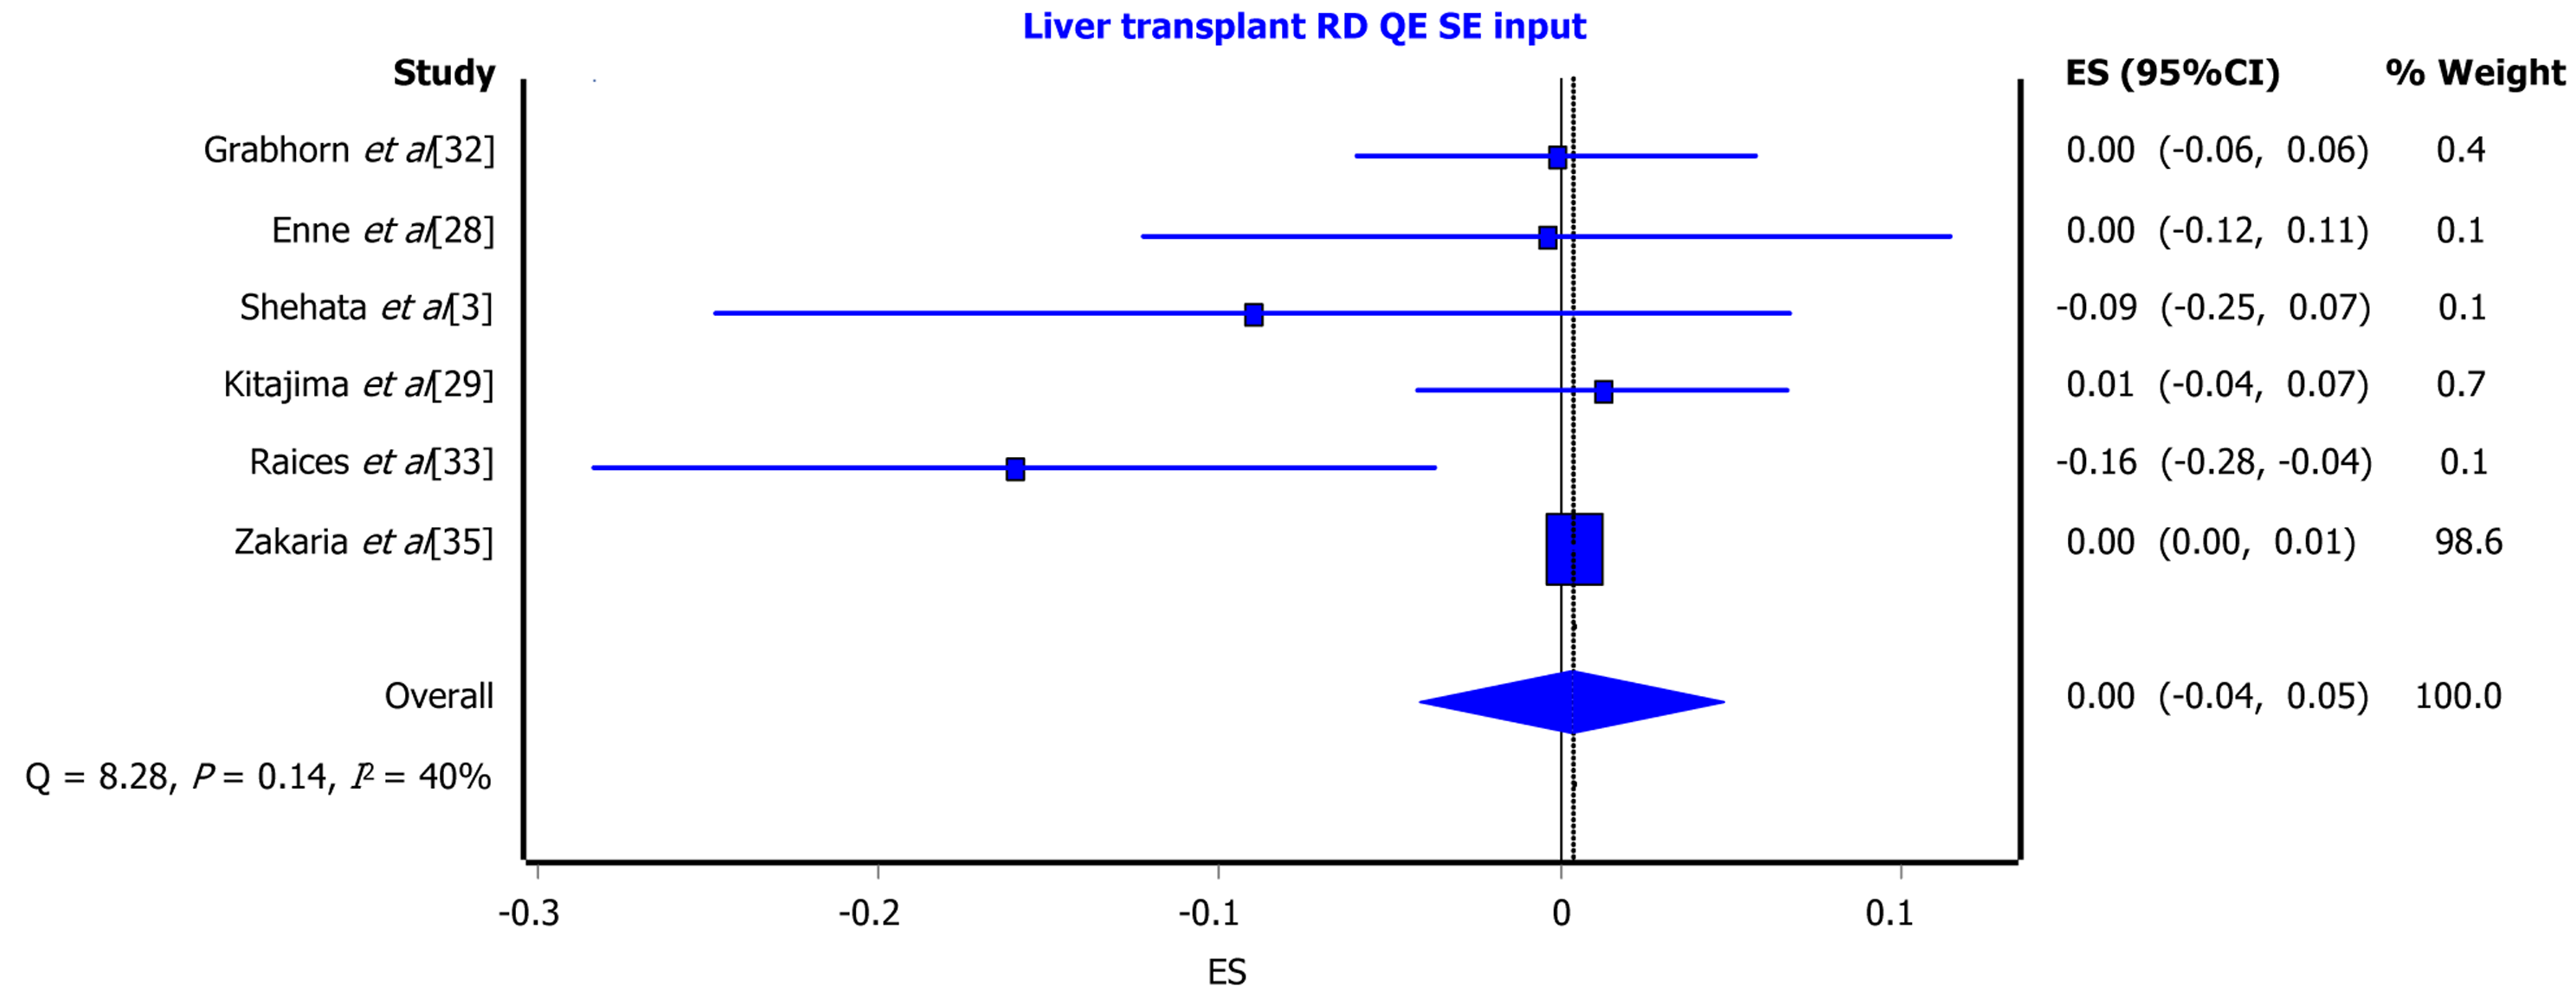
Figure 3 Forest plot for study outcomes especially one year survivability rate after liver transplantation.
RD: Rsk difference; QE: Cochran Q-test.
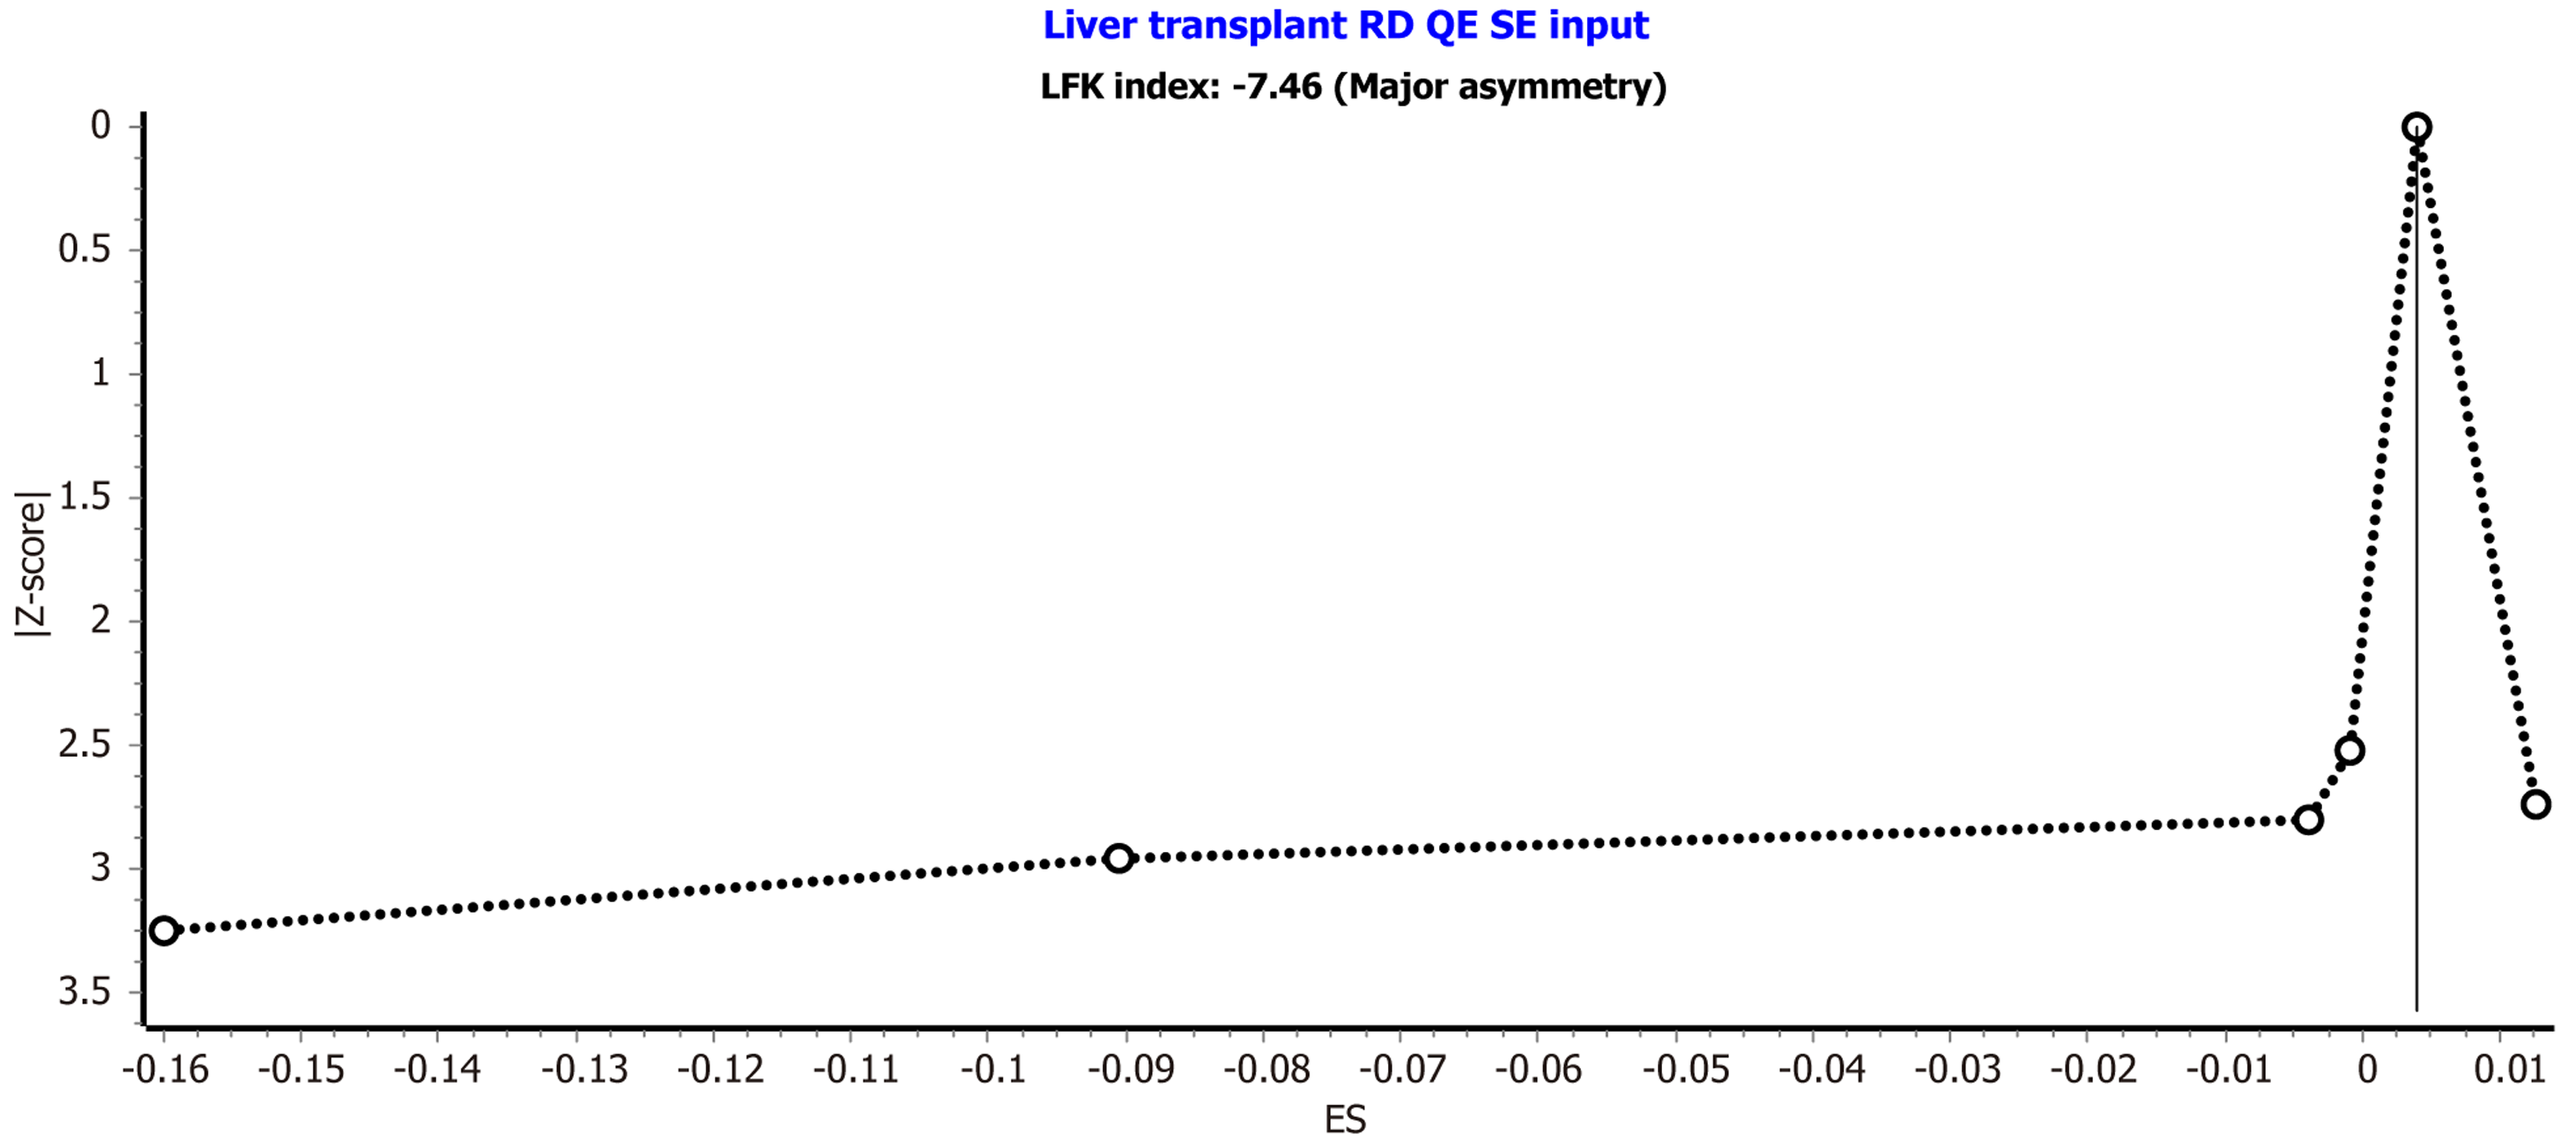
Figure 4 Doi plot for study outcomes especially one year survivability rate after liver transplantation.
RD: Rsk difference; QE: Cochran Q-test; ES: Effect size.
- Citation: Sain S, Pahari H, Tripathi S, Singhvi SK, Dhir U. Hyper-reduced grafts in living donor liver transplant: Techniques and outcomes. World J Transplant 2025; 15(4): 107462
- URL: https://www.wjgnet.com/2220-3230/full/v15/i4/107462.htm
- DOI: https://dx.doi.org/10.5500/wjt.v15.i4.107462


