Published online Sep 19, 2025. doi: 10.5498/wjp.v15.i9.108359
Revised: May 16, 2025
Accepted: June 30, 2025
Published online: September 19, 2025
Processing time: 136 Days and 13.3 Hours
Optical coherence tomography (OCT) enables high-resolution, non-invasive visualization of retinal structures. Recent evidence suggests that retinal layer alterations may reflect central nervous system changes associated with psychiatric disorders such as schizophrenia (SZ).
To develop an advanced deep learning model to classify OCT images and distinguish patients with SZ from healthy controls using retinal biomarkers.
A novel convolutional neural network, Self-AttentionNeXt, was designed by integrating grouped self-attention mechanisms, residual and inverted bottleneck blocks, and a final 1 × 1 convolution for feature refinement. The model was trained and tested on both a custom OCT dataset collected from patients with SZ and a publicly available OCT dataset (OCT2017).
Self-AttentionNeXt achieved 97.0% accuracy on the collected SZ OCT dataset and over 95% accuracy on the public OCT2017 dataset. Gradient-weighted class activation mapping visualizations confirmed the model’s attention to clinically relevant retinal regions, suggesting effective feature localization.
Self-AttentionNeXt effectively combines transformer-inspired attention mechanisms with convolutional neural networks architecture to support the early and accurate detection of SZ using OCT images. This approach offers a promising direction for artificial intelligence-assisted psychiatric diagnostics and clinical decision support.
Core Tip: This study presents Self-AttentionNeXt, a novel deep learning architecture that integrates self-attention mechanisms from transformer models with convolutional neural networks for the classification of optical coherence tomography images. By focusing on retinal image regions most relevant to schizophrenia, the model achieves high diagnostic accuracy. The integration of inverted bottleneck attention blocks and residual connections enhances both feature representation and training stability. Self-AttentionNeXt demonstrates that combining attention mechanisms with convolutional neural networks can offer a powerful tool for supporting ophthalmic evaluation in patients with schizophrenia.
- Citation: Kaya MK, Arslan S, Kaya S, Tasci G, Tasci B, Ozsoy F, Dogan S, Tuncer T. Self-AttentionNeXt: Exploring schizophrenic optical coherence tomography image detection investigations. World J Psychiatry 2025; 15(9): 108359
- URL: https://www.wjgnet.com/2220-3206/full/v15/i9/108359.htm
- DOI: https://dx.doi.org/10.5498/wjp.v15.i9.108359
Optical coherence tomography (OCT) is a non-invasive imaging technique that provides high-spatial-resolution tomographic slices of two-dimensional transverse layers of the retina[1]. When light emitted from the OCT device is directed toward the eye, it is reflected by intraocular structures with varying optical properties. OCT utilizes laser light to scan the retina, analyzing light reflected from its layers, thus providing high-quality resolution information about all retina layers. It can be considered as an in vivo biopsy of the retina[2,3]. OCT enables both qualitative (localization, shape, structure) and quantitative analyses (retinal measurements, particularly retinal thickness), and the retinal nerve fiber layer (RNFL)[4-6]. The retina serves as a crucial link between our visual perception and the brain, acting as a window to the brain. In many ways, it mirrors the central nervous system (CNS), sharing not only anatomical similarities but also functional and immunological connections with brain tissue[7]. Remarkably, changes in the retina often parallel alterations in brain structure and function, making it a valuable indicator of progressive brain tissue loss. Consequently, the retina plays a pivotal role in understanding and diagnosing vision-related disorders and can even serve as a proxy tissue for gaining insights into broader brain functions[8]. Recent studies have emphasized the potential of retinal structural changes particularly in the RNFL as indicators of CNS abnormalities in schizophrenia (SZ). The RNFL, composed of unmyelinated axons of ganglion cells, is structurally and functionally connected to the lateral geniculate nucleus and visual cortex. Thinning of the peripapillary RNFL and macular volume reductions have been consistently reported in chronic SZ, correlating with illness duration[9,10]. These alterations may reflect underlying neurodegeneration and highlight the promise of OCT as a non-invasive biomarker for disease monitoring and stratification[11-13]. Research on neurodegeneration in the visual pathway has grown in recent years[14]. The retina sits in the CNS as its first visual processing stage[14]. It sends signals to the lateral geniculate nucleus, mesencephalon, pretectum, and hypothalamus via nerve fibers[15]. This network makes the retina an extension of the CNS[16]. Ganglion cells transmit visual information along the optic nerve and tract[17]. The RNFL lacks myelin. This feature links it to neurodegenerative diseases such as Alzheimer’s and Parkinson’s[18,19]. Magnetic resonance imaging studies confirm that SZ affects brain structure and function[20-23]. The retina’s unique anatomy therefore offers a way to detect SZ early.
Advances in OCT have led to more studies on retinal neurodegeneration in psychiatric disorders[24]. An OCT study of patients with SZ found reduced RNFL thickness, macular volume, and overall retinal layer thickness. Total RNFL volume showed a clear correlation with illness duration[25]. Another report noted retinal thinning in patients with diabetes or hypertension. Optic disk degeneration may indicate CNS anomalies and cognitive decline[26]. OCT provides a non-invasive method for diagnosing and tracking diseases like SZ[10]. This paper explores artificial intelligence (AI) algorithms for early SZ detection from OCT images. AI can identify retinal structural changes and link them to clinical symptoms. Early neurodegenerative signs in SZ may appear in retinal scans. AI analysis of OCT data could enable faster, more accurate, and earlier diagnosis than current methods. AI-supported OCT may thus play a key role in diagnosing and managing SZ and related neurological disorders.
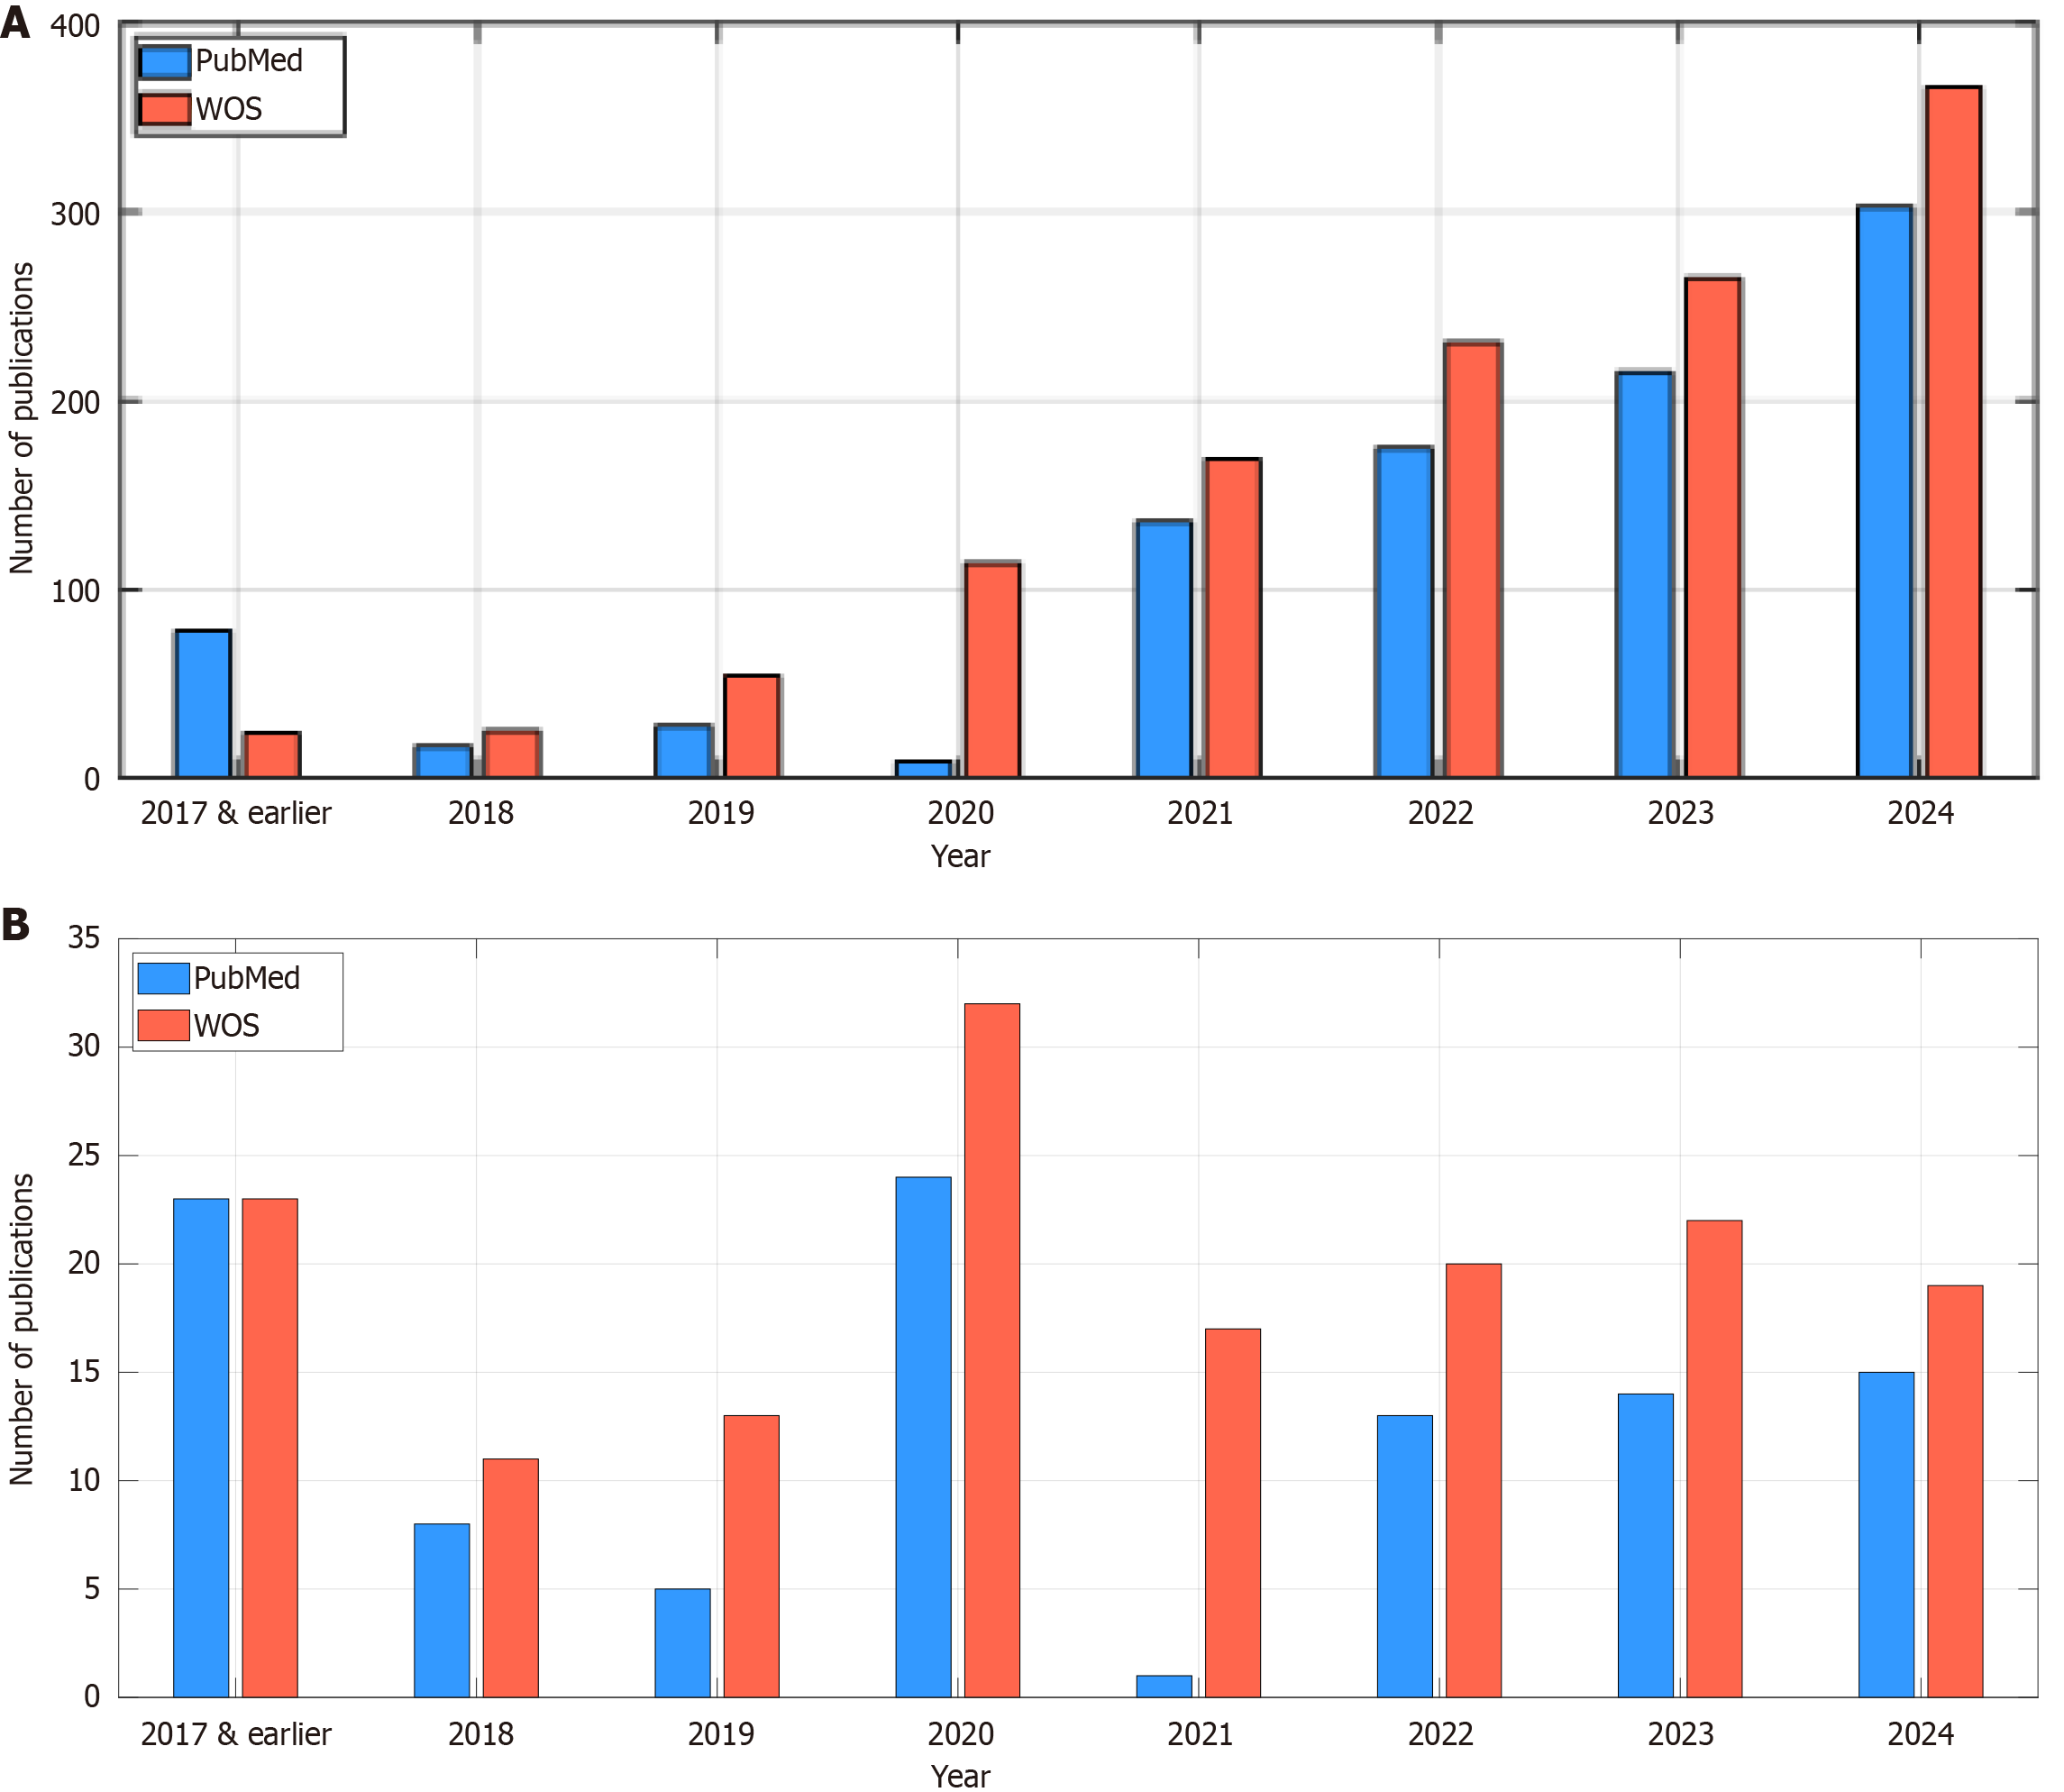
We conducted a literature review on Web of Science and PubMed using the keywords “OCT”, “AI”, and “schizophrenia”. This literature review maps research trends and highlights gaps in SZ studies (Figure 1). AI shapes modern technology and benefits medicine[27]. Recent works apply deep learning to OCT images and signals[28-30]. De Fauw et al[31] built a deep model for retinal disorders with 14884 OCT images and achieved a 5.5% error rate. The dataset was limited. Asaoka et al[32] designed a glaucoma detection model on 4316 spectral-domain OCT (SDOCT) images and reached an area under the curve of 93.70%. Their computed results are relatively low. Christopher et al[33] fine-tuned ResNet50 on 9765 visual field-SDOCT pairs from 1194 subjects and obtained an area under the curve of 82.00%. This performance was relatively low and they only presented an application of the ResNet50. Heisler et al[34] ensembled visual geometry group-19 networks on OCTA and structural images and reported 92.00% accuracy by majority voting and 90.00% by stacking. The results were suboptimal and their model was not innovative. Tsuji et al[35] applied capsule network to four OCT classes and reached 99.60 % accuracy. They did not propose a new convolutional neural network (CNN) model. Thomas et al[36] extracted the retinal pigment epithelium layer from SDOCT images and measured drusen elevation to achieve 96.66% accuracy. They only tested their model one a single dataset. Kim and Tran[37] classified four OCT categories and achieved 98.70% accuracy, 98.70% sensitivity, and 99.60% specificity. They only illustrated that deep learning could classify OCT images. Yoon et al[38] built a model for central serous chorioretinopathy subtypes on 3209 images and saw 70% cross-validation accuracy and 76.80% test accuracy. Their results trailed other studies. Ko et al[39] created a CNN-long short-term memory model for central serous chorioretinopathy and reported 94.20% average accuracy. They used a small dataset. Li et al[40] detected diabetic macular edema and achieved 96.00% sensitivity and 99.30% specificity. They did not innovate on the CNN design. Karthik and Mahadevappa[41] adapted ResNet34, ResNet50, and ResNet101 and reached 92.40%, 90.30%, and 86.10% accuracy. Their class samples were limited and they did not present innovative deep learning approximation.
In accordance with the literature review conducted, the identified gaps were as follows: (1) The utilized datasets were comparatively small, necessitating a larger dataset for the effective detection of SZ using OCT; (2) The authors predominantly employed well-established models to attain high classification results. Consequently, numerous studies lacked innovation in their selection of CNN models; (3) The majority of the examined OCT-based machine learning models predominantly relied on single datasets. Consequently, the outcomes of these studies cannot be extrapolated or generalized; and (4) To address these identified gaps, we introduced an innovative CNN and subsequently evaluated its performance using two distinct datasets.
In this research, we present several significant contributions that underscore the potential of harnessing technology to enhance psychiatric diagnoses, particularly in the context of SZ. The innovations and contributions of this study are outlined below. Novelties: (1) We curated a novel OCT image dataset specifically for detecting SZ and delineated two distinct cases utilizing this collected dataset; and (2) Proposing an attention-based CNN named Self-AttentionNeXt, designed to be both attentive and lightweight; and (3) Demonstrating the efficacy of Self-AttentionNeXt by achieving high classification performance on a publicly available OCT image dataset. Contributions: (1) We investigated whether OCT images of patients with SZ differ from those of normal participants. To test this, we compiled an OCT image dataset with two cases. Our deep learning model, Self-AttentionNeXt, achieved over 97% test accuracy on this dataset; and (2) We analyzed the use of CNNs and transformers in computer vision. Inspired by attention blocks in transformers, we developed a new attention-based CNN, called Self-AttentionNeXt. We tested the model on both a collected dataset and a public dataset. Self-AttentionNeXt achieved over 95% test accuracy on both. These results show its strong classification performance and potential for other computer vision tasks.
The advanced machine learning models have been utilized for diagnosis and detection. However, the automated biomedical image/signal classification models can be utilized to create precision medicine applications and discovering new findings[42]. Traditional models, though effective, often struggle to focus on specific regions of interest (ROIs) critical for accurate results[43]. Transformers, particularly those with self-attention mechanisms, have demonstrated strong performance in various domains, including natural language processing[44]. Motivated by these successes, we aim to integrate self-attention into CNNs to bridge the gap between conventional CNNs and modern transformer-based models.
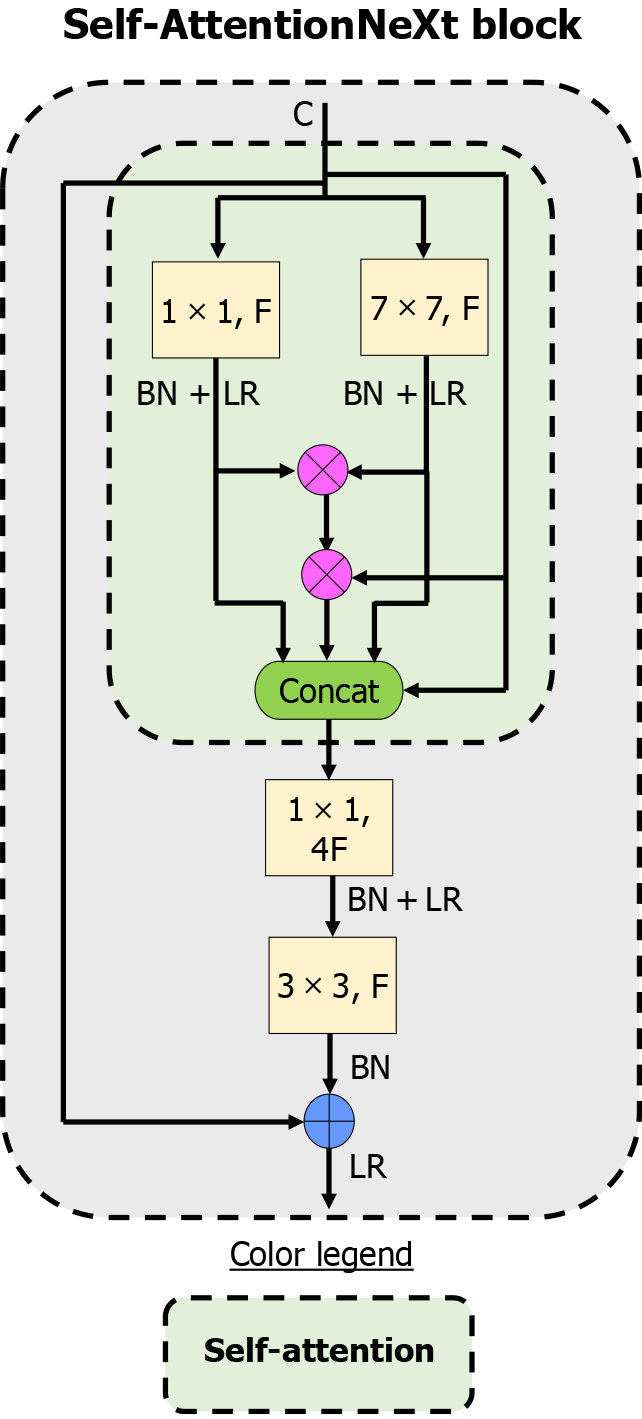
In this study, we propose a CNN model featuring the Self-AttentionNeXt block. This block combines self-attention mechanisms with residual connections, resembling transformer architectures. The self-attention component helps the model focus on key ROIs, while residual connections mitigate the vanishing gradient problem. Figure 2 illustrates the Self-AttentionNeXt block. We provide the mathematical formulation governing this block and emphasize the role of the inverted bottleneck-based attention block in improving classification accuracy. The integration of multiplication operators, merge and addition blocks, and a final 1 × 1 convolution ensures optimal performance, maintaining focus on ROIs and addressing potential training challenges. Inspired by the Swin Transformer[45], a patch-based block is incorporated in the root block of the network. This approach enhances subsampling and contributes to generating a comprehensive feature map.
In this section, the used datasets and the proposed CNN have been presented.
In this study, the success of the proposed method is demonstrated using two distinct OCT datasets.
Collected SZ OCT dataset: In this research, individuals diagnosed with SZ, undergoing treatment at Elazig Fethi Sekin City Hospital and Elazig Mental and Neurological Diseases Hospital constituted the study cohort. In this regard, we have conducted a multicenter study by obtaining OCT image datasets from two separate medical centers. The average year of illness of the patients was calculated as 7.68 ± 5.22. The medications used by the patients are as follows, olanzapine with a rate of 59.7%, risperidone with a rate of 14.92%, amisulpride with a rate of 8.95%, aripiprazole with a rate of 8.95%, and clozapine with a rate of 7.46%. Some patients were taking both depot antipsychotics and oral medications. However, all the drugs used were in the atypical antipsychotic group.
The research employed the Huvitz HOCT-1F (Huvitz Co., Ltd., Republic of Korea) OCT apparatus for data acquisition. The OCT image datasets of patients who have SZ were acquired by meticulously scanning the RNFL and the macular regions. These regions were scanned in a horizontal orientation, generating cross-sectional slices at consistent intervals. The study encompassed 67 patients diagnosed with SZ, alongside 46 individuals serving as healthy controls. In some studies, it has been reported that there is no difference in OCT findings between sexes[46,47]. However, some studies have shown that men’s calculated values are higher than women’s[48]. In our study, women in the patient group were included to determine whether there was such a difference. However, the need for equal distribution between sexes can be considered among the limitations of our study.
Patients who were aged between 18 and 50 and diagnosed with SZ. Alcohol/substance use disorder, chronic disease, renal-liver dysfunction, chronic heart disease, mental retardation, poor general condition, metabolic syndrome, and patients with malignancies were excluded from this study. Healthy individuals with matching demographic characteristics such as age, sex, marital status, and education level who did not have any current or previous psychiatric disorder requiring treatment were included as control group. These individuals were selected among patients’ relatives and people who came to the psychiatric outpatient clinic and were not diagnosed with mental illness. The patient group smoked 1.5 packs of cigarettes per day. Healthy controls were selected accordingly. There was no alcohol use in either group. Pertinent sociodemographic particulars of the participants have been systematically presented in Table 1.
| Feature | Schizophrenia (n = 67) | Healthy control (n = 46) |
| Sex (female/male) | 15/52 | 10/36 |
| Mean age, years | Female: 45.10 ± 7.72, male: 41.74 ± 9.00 | Female: 30.60 ± 6.45, male: 36.82 ± 5.24 |
| Age range, years | Female: 33-54, male: 18-59 | Female: 25-45, male: 20-52 |
| Education, years | Female: 5.90 ± 1.44, male: 17.00 ± 21.01 | Female: 8.60 ± 1.25, male: 16.75 ± 3.12 |
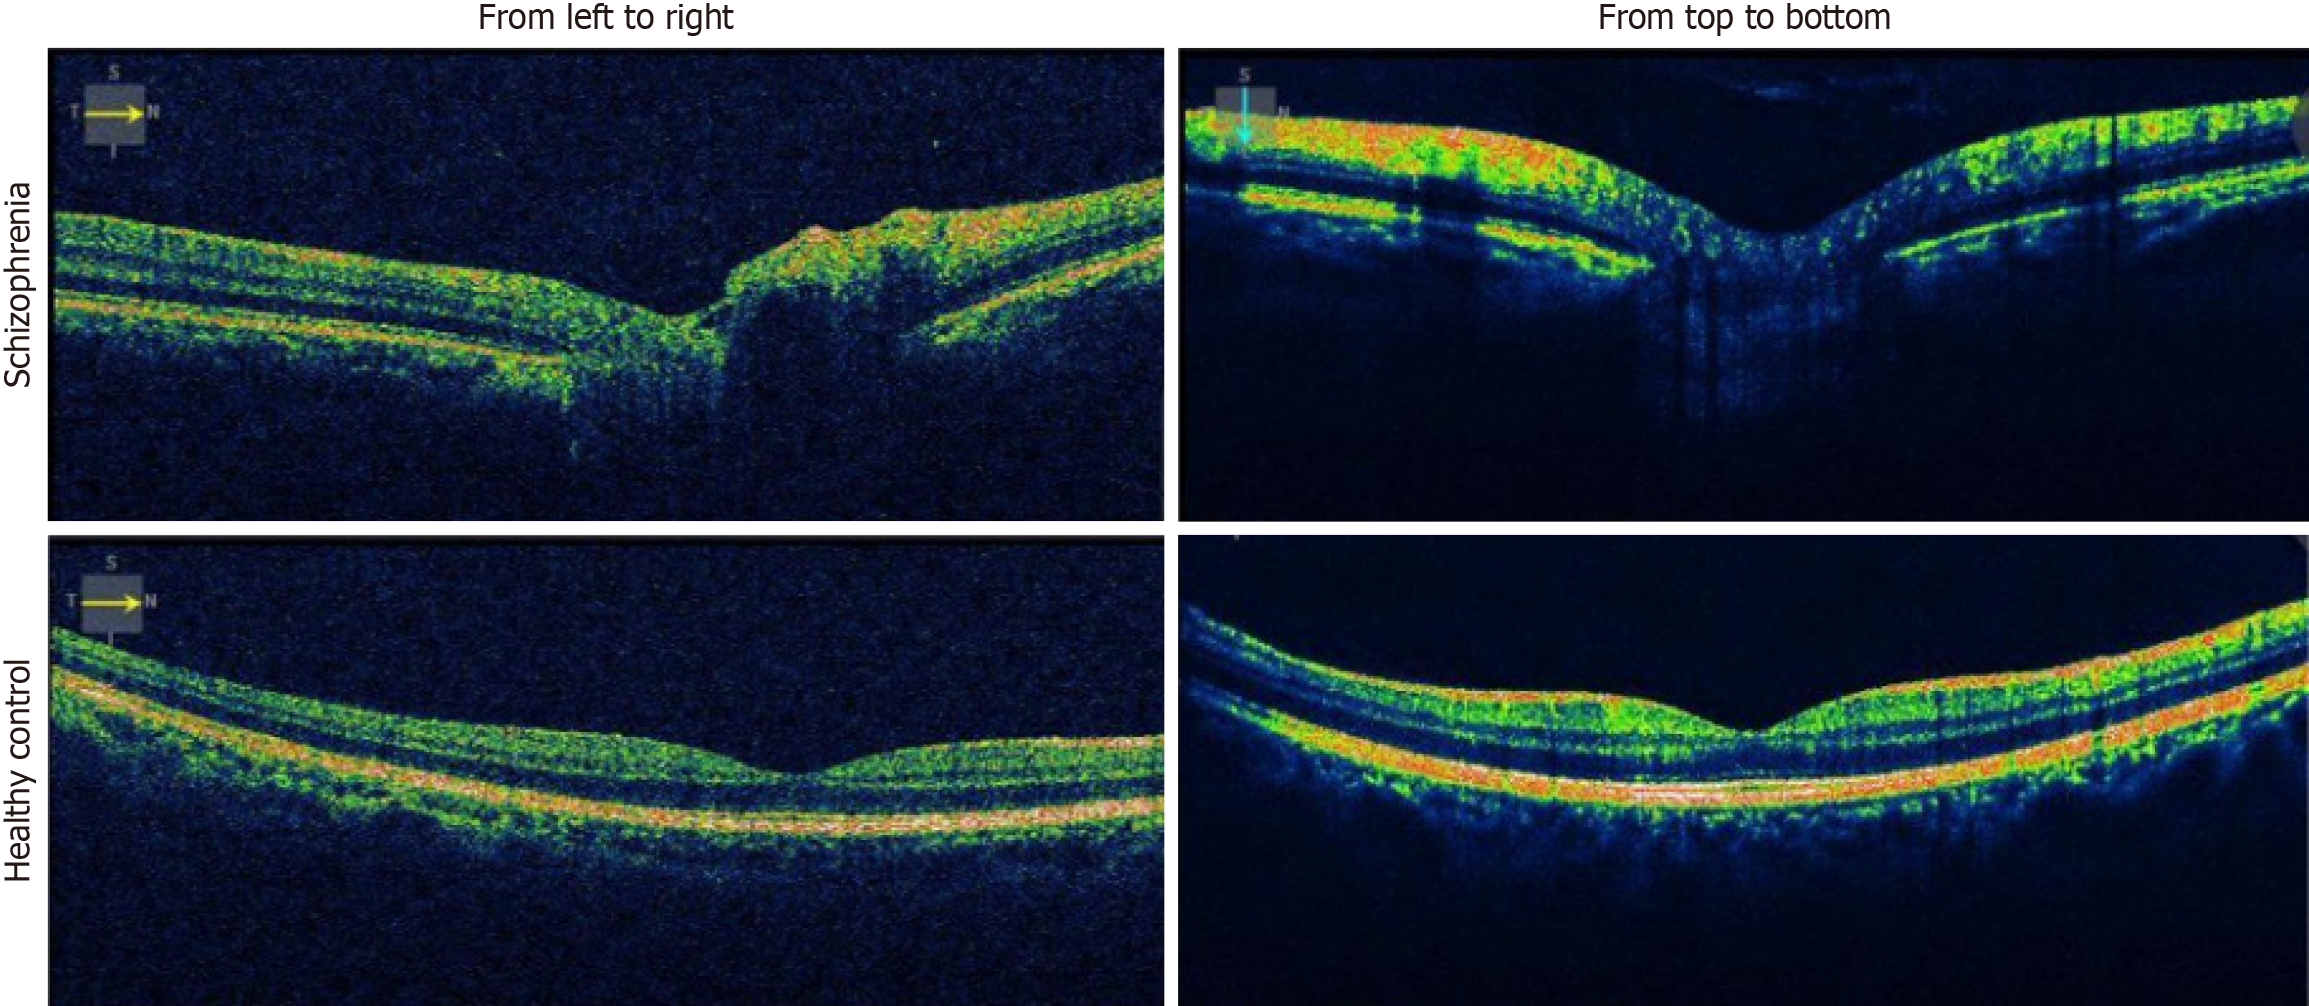
Sample images from the collected OCT dataset of patients with SZ are shown in Figure 3. The collected dataset encompasses 6098 images, partitioned into two categories: 3049 images originating from “left to right” OCT scans and an additional 3049 images derived from “top to bottom” OCT scans. The allocation of these OCT images into distinct training and testing sets is succinctly outlined in Table 2. As can be seen from Table 2, the collected OCT image dataset is an imbalanced dataset and the train and test separation is about 78:22.
| Diagnosis | Orientation | Train images | Test images | Total images |
| Schizophrenia | Left to right | 1461 | 416 | 1877 |
| Healthy control | Left to right | 912 | 260 | 1172 |
| Schizophrenia | Top to bottom | 1461 | 416 | 1877 |
| Healthy control | Top to bottom | 912 | 260 | 1172 |
Mendeley OCT dataset: Heidelberg Engineering, Germany sourced OCT images from the Spectralis OCT machine. The retrospective cohorts for these images were selected from multiple institutions, including the Shiley Eye Institute at the University of California San Diego, the California Retinal Research Foundation, and the Medical Center Ophthalmology Associates in Shanghai. The dataset comprises four distinct classes: Diabetic macular edema, choroidal neovascularization, drusen, and normal[49]. (https://data.mendeley.com/datasets/rscbjbr9sj/3, accessed on July 20, 2023). Demographic information about this dataset is listed in Table 3. The dataset, comprising four classes, contains a total of 84484 images. The distribution of these images into training and testing sets is tabulated in Table 4. This dataset is also named OCT2017. All OCT images from both datasets were resized to 224 × 224 pixels prior to model input. No additional preprocessing or image enhancement was performed.
| Diagnosis | DME | CNV | Drusen | Normal |
| Number of patients | 709 | 791 | 713 | 3548 |
| Mean age, years | 57 | 83 | 82 | 60 |
| Age range, years | 20-90 | 58-97 | 40-95 | 21-86 |
| Male, n (%) | 38.3 | 54.2 | 44.4 | 59.2 |
| Female, n (%) | 61.7 | 45.8 | 55.6 | 40.8 |
| Diagnosis | Train images | Test images | Total |
| CNV | 37213 | 242 | 37455 |
| DME | 11356 | 242 | 11598 |
| Drusen | 8624 | 242 | 8866 |
| Normal | 26323 | 242 | 26565 |
In this study, we introduced a novel self-attention CNN model. Our primary goal was to design a CNN akin to transformers. The self-attention block is a prominent feature of transformers. Consequently, we integrated self-attention and residual blocks to formulate a unique block. Utilizing the self-attention block allows our model to concentrate on the ROI. Additionally, we employed residual blocks to address the vanishing gradient problem. The design of the proposed block is illustrated in Figure 2.
In this research, we introduced a block named Self-AttentionNeXt (it is the main block of our proposed model). Utilizing this newly proposed Self-AttentionNeXt block, we developed a network, which is also referred to as Self-AttentionNeXt. The mathematical definition of the Self-AttentionNeXt has been given below:
Out1 = L(B(C(X(t-1),1,f)))(1),
where out means outputs, Xt-1 is the used input at t-1 time, L(.) means of Leaky ReLU, B(.) defines batch normalization (BN), 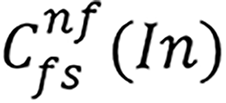 is the convolution and the used parameters for these functions are input (In), filter size (fs) and the number of the filters [nf, in Equation (1), we defined it as F]. Also,
  : Grouped convolution. We used grouped convolution to optimize number of learnable parameters.
In this equation, we used pixel-wise convolution. This step extracts local channel features without changing spatial size:
Out2= L(B(C(X(t-1),7,f)))(2).
In this equation, a 7 × 7 convolution gathers information from a wider neighborhood (like ConvNeXt) with BN and Leaky ReLU.
In Equations (1) and (2), we aimed to created Keyword (K) and Query (Q). To create K and Q, the mask was created using the equation below:
Out3 = Out1 × Out2 (3).
We multiplied the two feature maps element-wise. Regions strong in both maps become more prominent, acting like an implicit attention mask. Instead of addition, we used concatenation to create a rich feature map:
Out4 = concat(X(t-1), out1, out2, out3)(4).
This preserves raw, local, contextual, and fused information for the next stage. Here, concat(.) means the depth concatenation function.
After these steps, we implemented an inverted bottleneck as below:
Out5 = L(B(C(out4,1,4f)))(5)
Out6 = L(B(C(out5,3,f)))(6).
Above, the inverted bottleneck was defined:
Xt = L(X(t-1) + out6)(7).
The big shortcut was defined above. Xt defines the ultimate output.
In our self-attention design, grouped convolutions generate query and key feature maps without a softmax layer. Equations (1) and (2) apply 1 × 1 and 7 × 7 grouped convolutions to split the input channels into groups that act like attention heads, each followed by BN and Leaky ReLU. Equation (3) multiplies these maps element-wise, highlighting positions where both activations are strong and creating a raw attention mask. Equation (4) concatenates the original input, local features, contextual features, and the attention mask along the channel axis, merging all information streams into a richer representation. Finally, Equations (5)-(7) apply an inverted bottleneck: A grouped 1 × 1 convolution expands channels, a 3 × 3 convolution refines spatial details, and a residual addition restores the original input, balancing parameter efficiency and feature quality. This compact design tightly integrates convolution and a simple attention mask to produce robust, meaningful feature maps.
We used a simple Q × K × V projection instead of full softmax (Q × K) × V. This reduces computation while still reweighting feature channels. In this research, we presented a convolution-based attention model with an inverted bottleneck to generate robust and meaningful features. Utilizing these equations, we proposed an inverted bottleneck-based attention block to achieve high classification accuracy. This is attributed to our ability to generate meaningful feature maps through the proposed attention structure. Additionally, we employed the multiplication operator to emphasize the ROI. We adopted concatenation and addition blocks to address the vanishing gradient problem. Furthermore, the final 1 × 1 convolution operator was used for scaling.
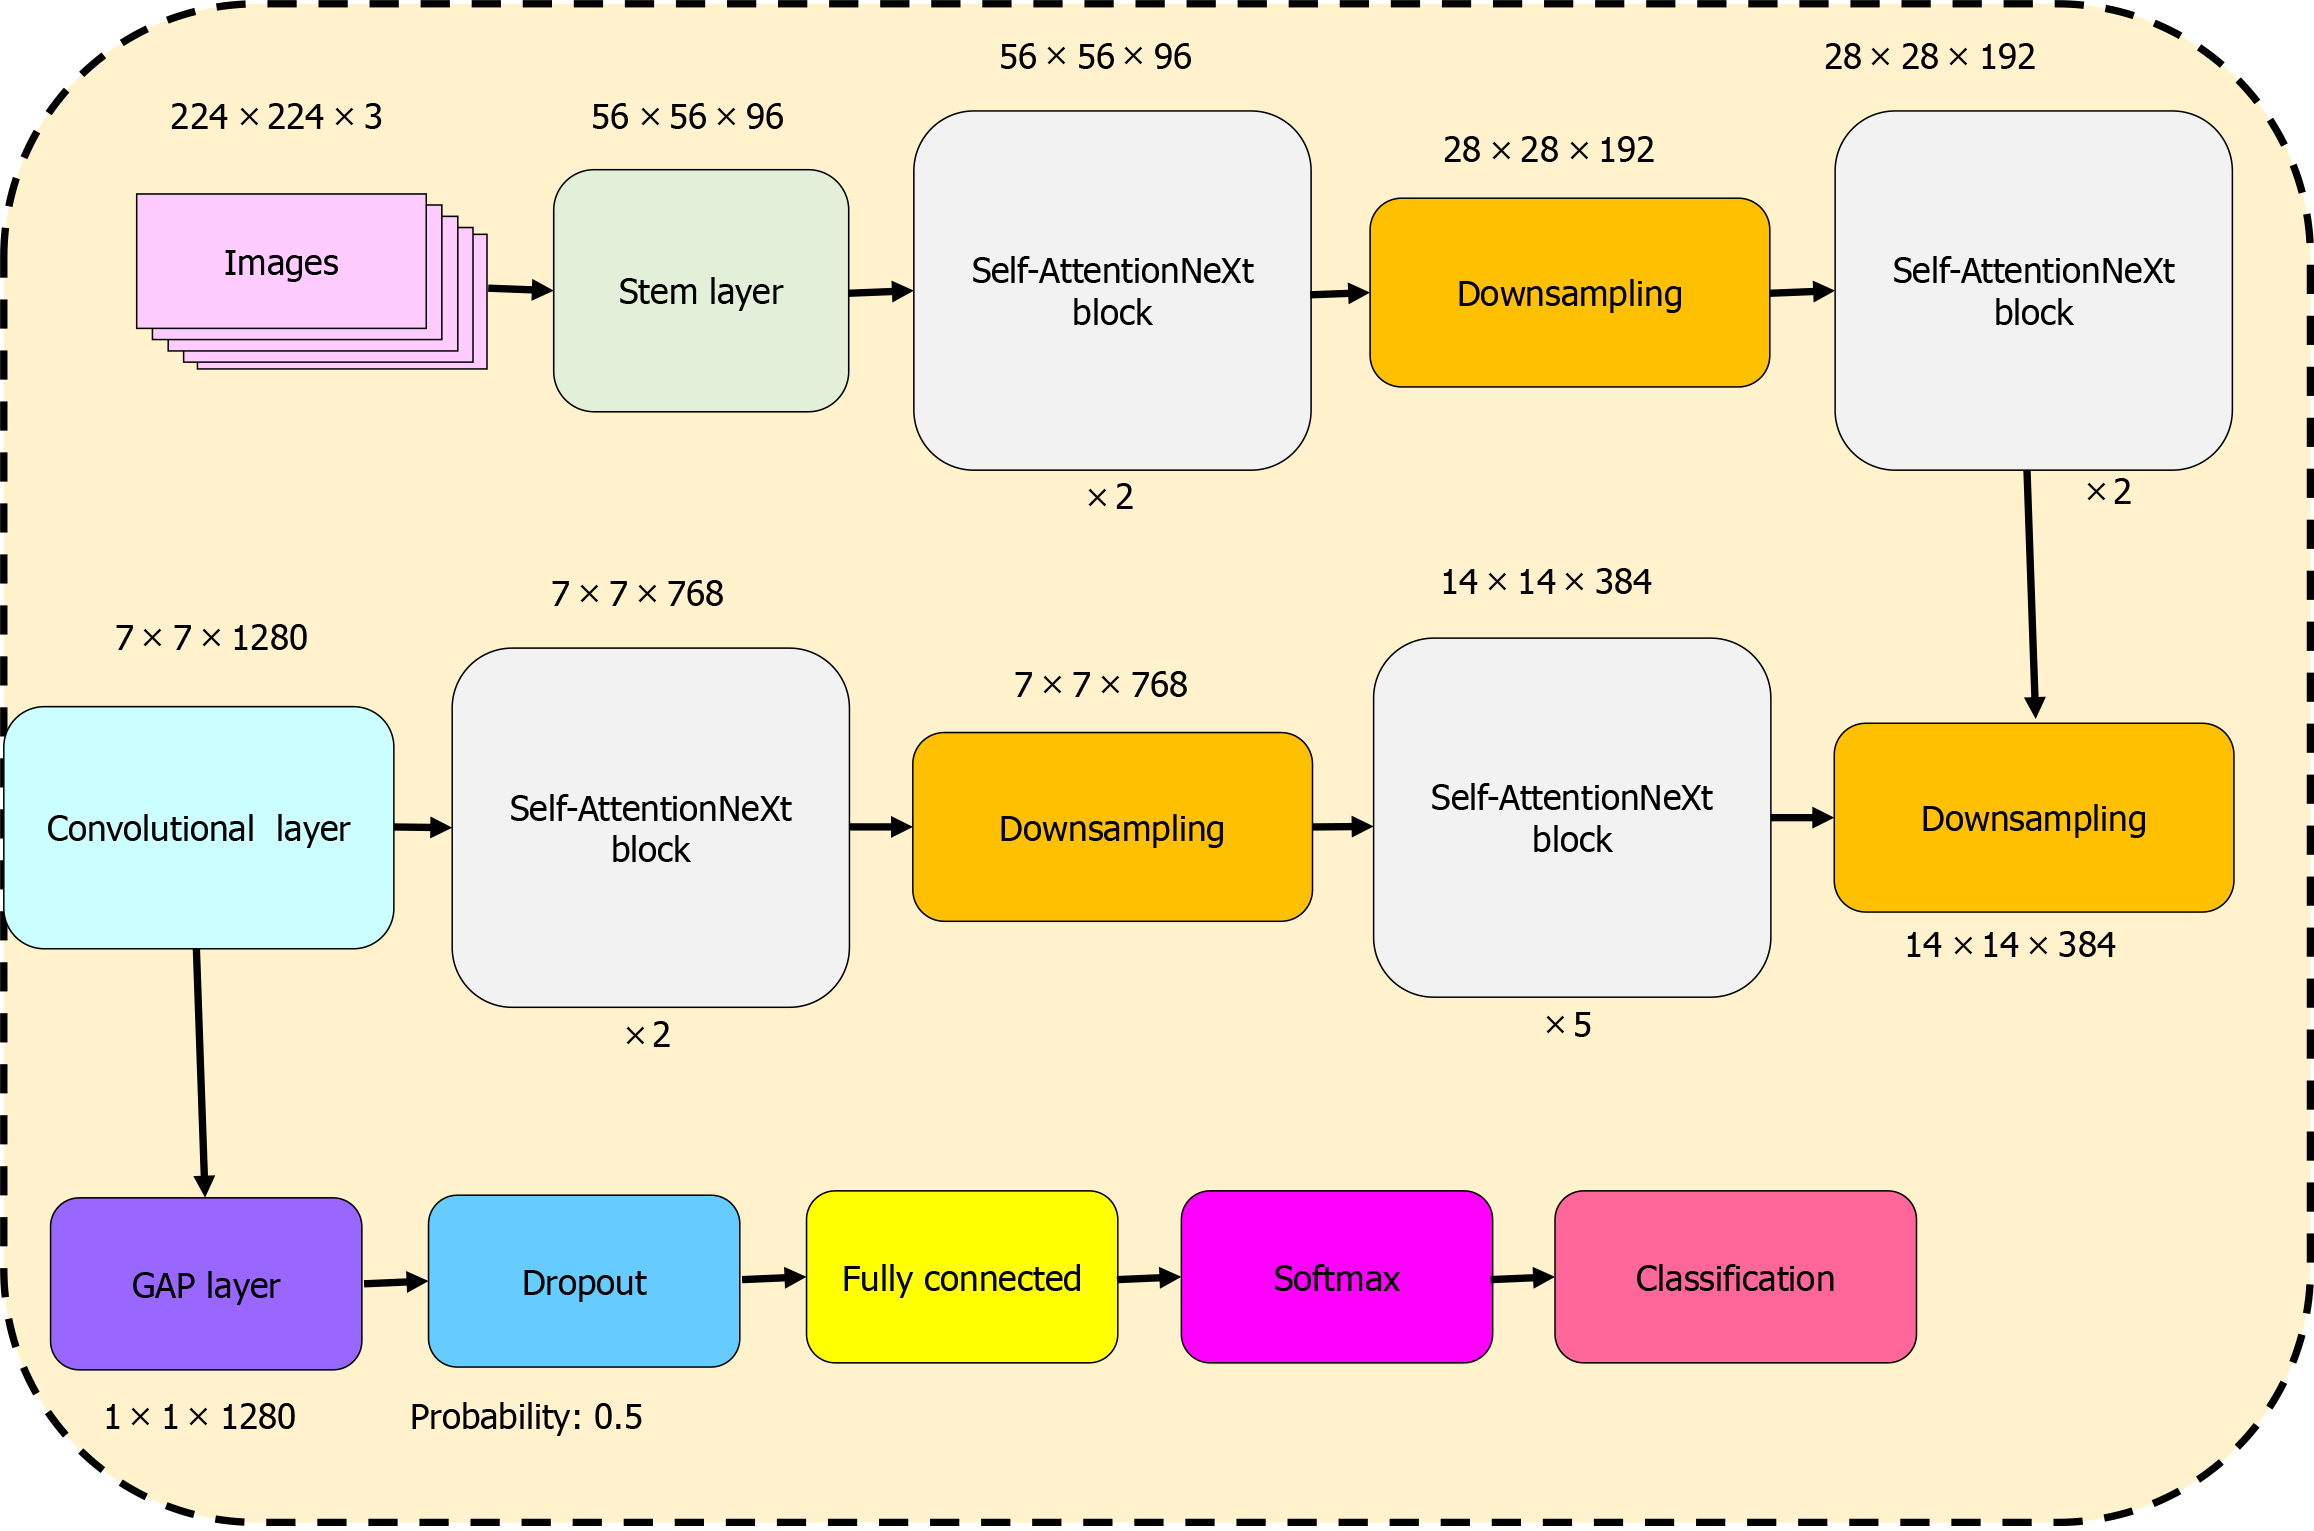
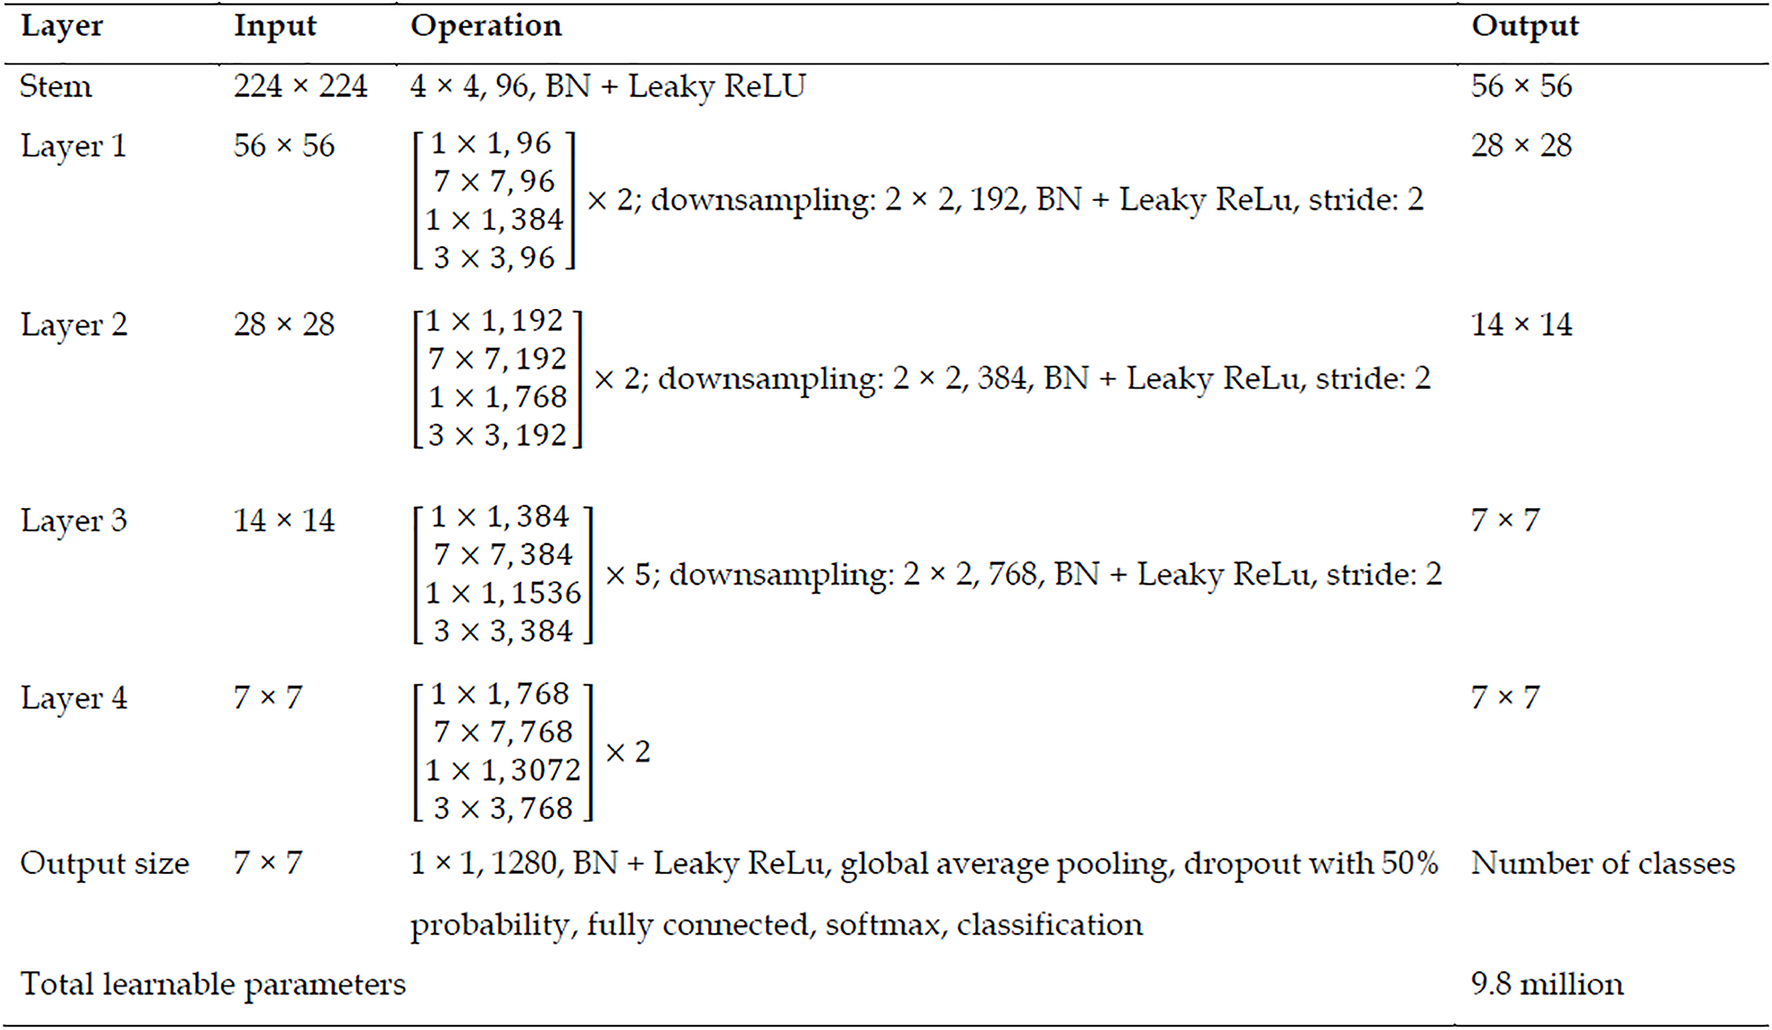
The mathematical within the stem block of the proposed network, we incorporated a patchify block similar to the Swin Transformer. Furthermore, this patchify strategy was employed during downsampling. Subsequently, we used the proposed blocks to generate a feature map. To elucidate the design of our proposed model, we present a graphical diagram of the CNN in Figure 4. The graphical representation of the proposed Self-AttentionNeXt is depicted in Figure 4. Referring to Figure 4, the configuration of the suggested Self-AttentionNeXt is C = (96,192,384,768) and B = (2,2,5,2), where C represents the number of filters and B denotes the number of repeats. Given this configuration, the total number of trainable parameters stands at 9.8 million. In this context, our proposed CNN qualifies as a lightweight model. The comprehensive architecture of the introduced Self-AttentionNeXt is detailed in Figure 5. Figure 5 provides a detailed specification of the recommended Self-AttentionNeXt architecture, outlining each layer’s input size, operations, and corresponding output dimensions.
Stem layer: The initial stem layer takes an input size of 224 × 224 and undergoes a 4 × 4 convolution operation with 96 filters, followed by BN and Leaky ReLu activation, resulting in an output size of 56 × 56. Layer 1: With an input size of 56 × 56, layer 1 consists of two sets of operations, each involving a sequence of convolutions with different filter sizes (1 × 1, 7 × 7, 1 × 1, 3 × 3), resulting in an output size of 28 × 28. Subsequently, a downsampling operation with a 2 × 2 kernel, 192 filters, BN, and Leaky ReLu activation is applied, reducing the output size to 28 × 28. Layer 2: Building upon the 28 × 28 output from the previous layer, layer 2 follows a similar pattern, incorporating two sets of operations and a downsampling step with a 2 × 2 kernel, 384 filters, BN, and Leaky ReLu activation, resulting in an output size of 14 × 14. Layer 3: Layer 3, with an input size of 14 × 14, features five sets of operations similar to the previous layers, along with a downsampling operation employing a 2 × 2 kernel, 768 filters, BN, and Leaky ReLu activation, leading to an output size of 7 × 7. Layer 4: Continuing the pattern, layer 4 operates on a 7 × 7 input with two sets of operations and a downsampling step, resulting in a final output size of 7 × 7. Output layer: The output layer takes the 7 × 7 feature map, applying a 1 × 1 convolution operation with 1280 filters, BN, Leaky ReLu activation, global average pooling, a dropout with 50% probability, followed by a fully connected layer, softmax activation, and classification. This layer yields the number of classes as the final output. We have presented the application of the proposed CNN deploying steps and these steps are: Step 1: Train the used datasets by deploying the proposed Self-AttentionNeXt. Step 2: Calculate results of the test images deploying the obtained trained Self-AttentionNeXt.
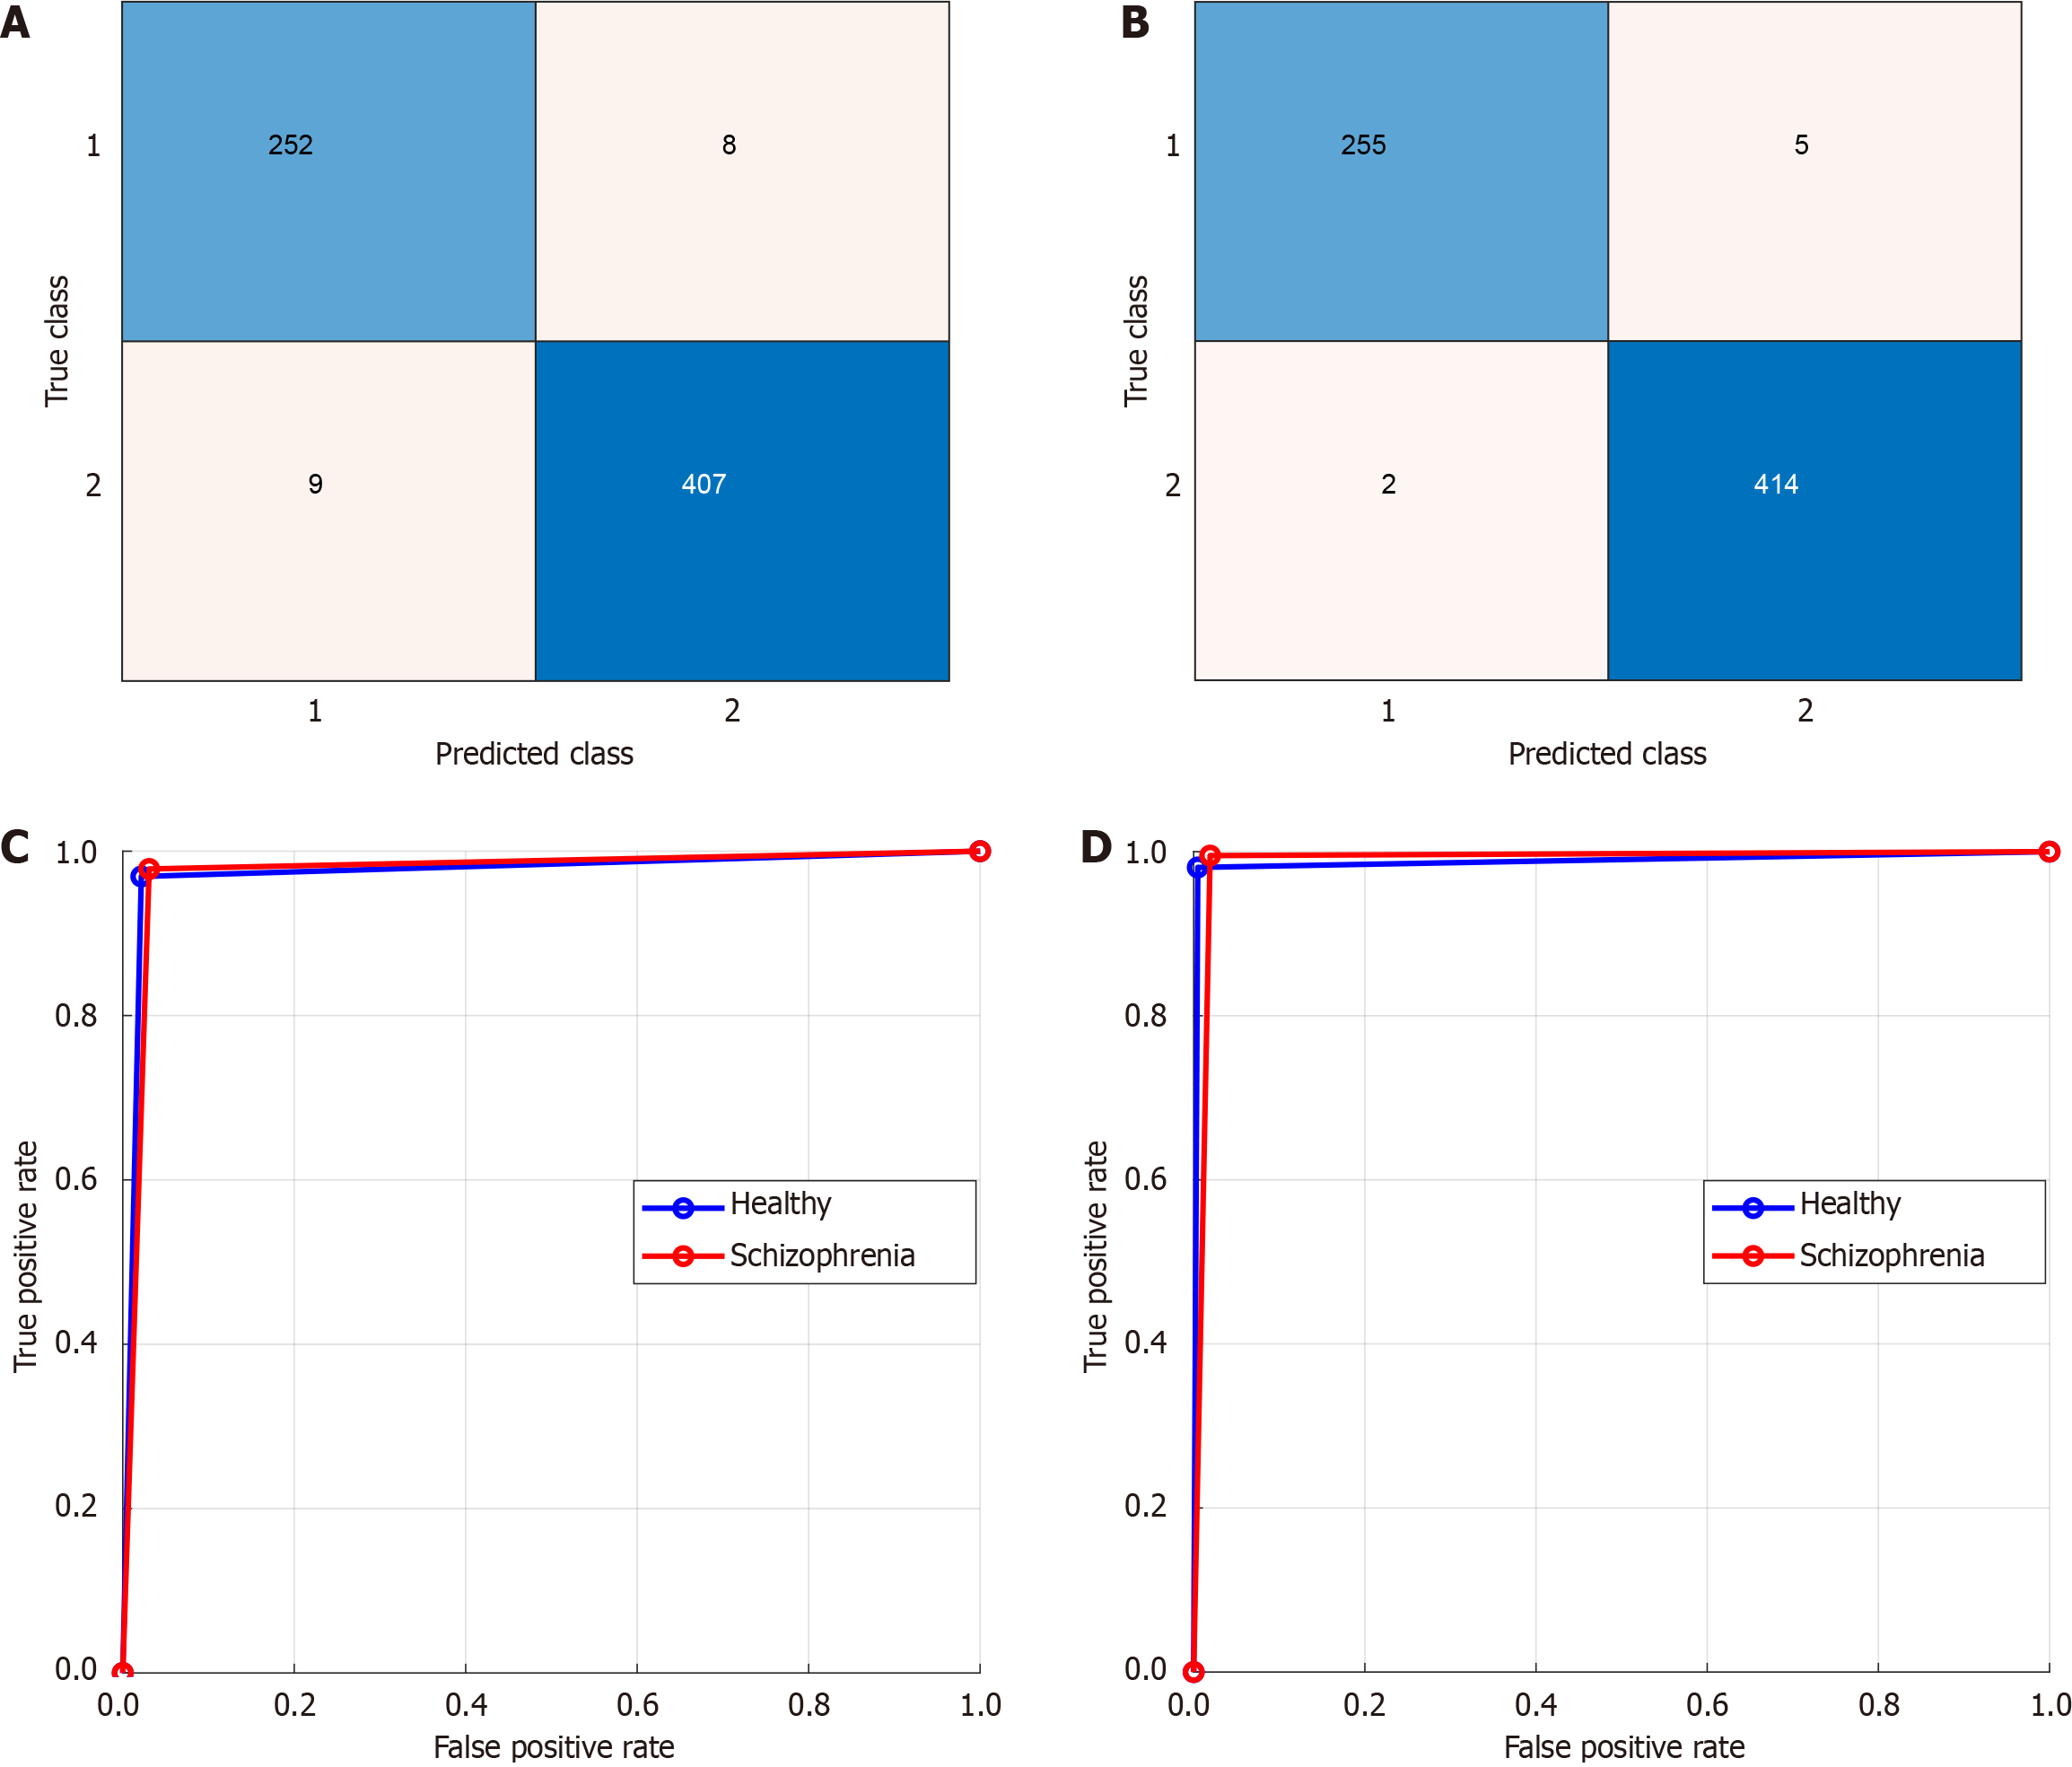
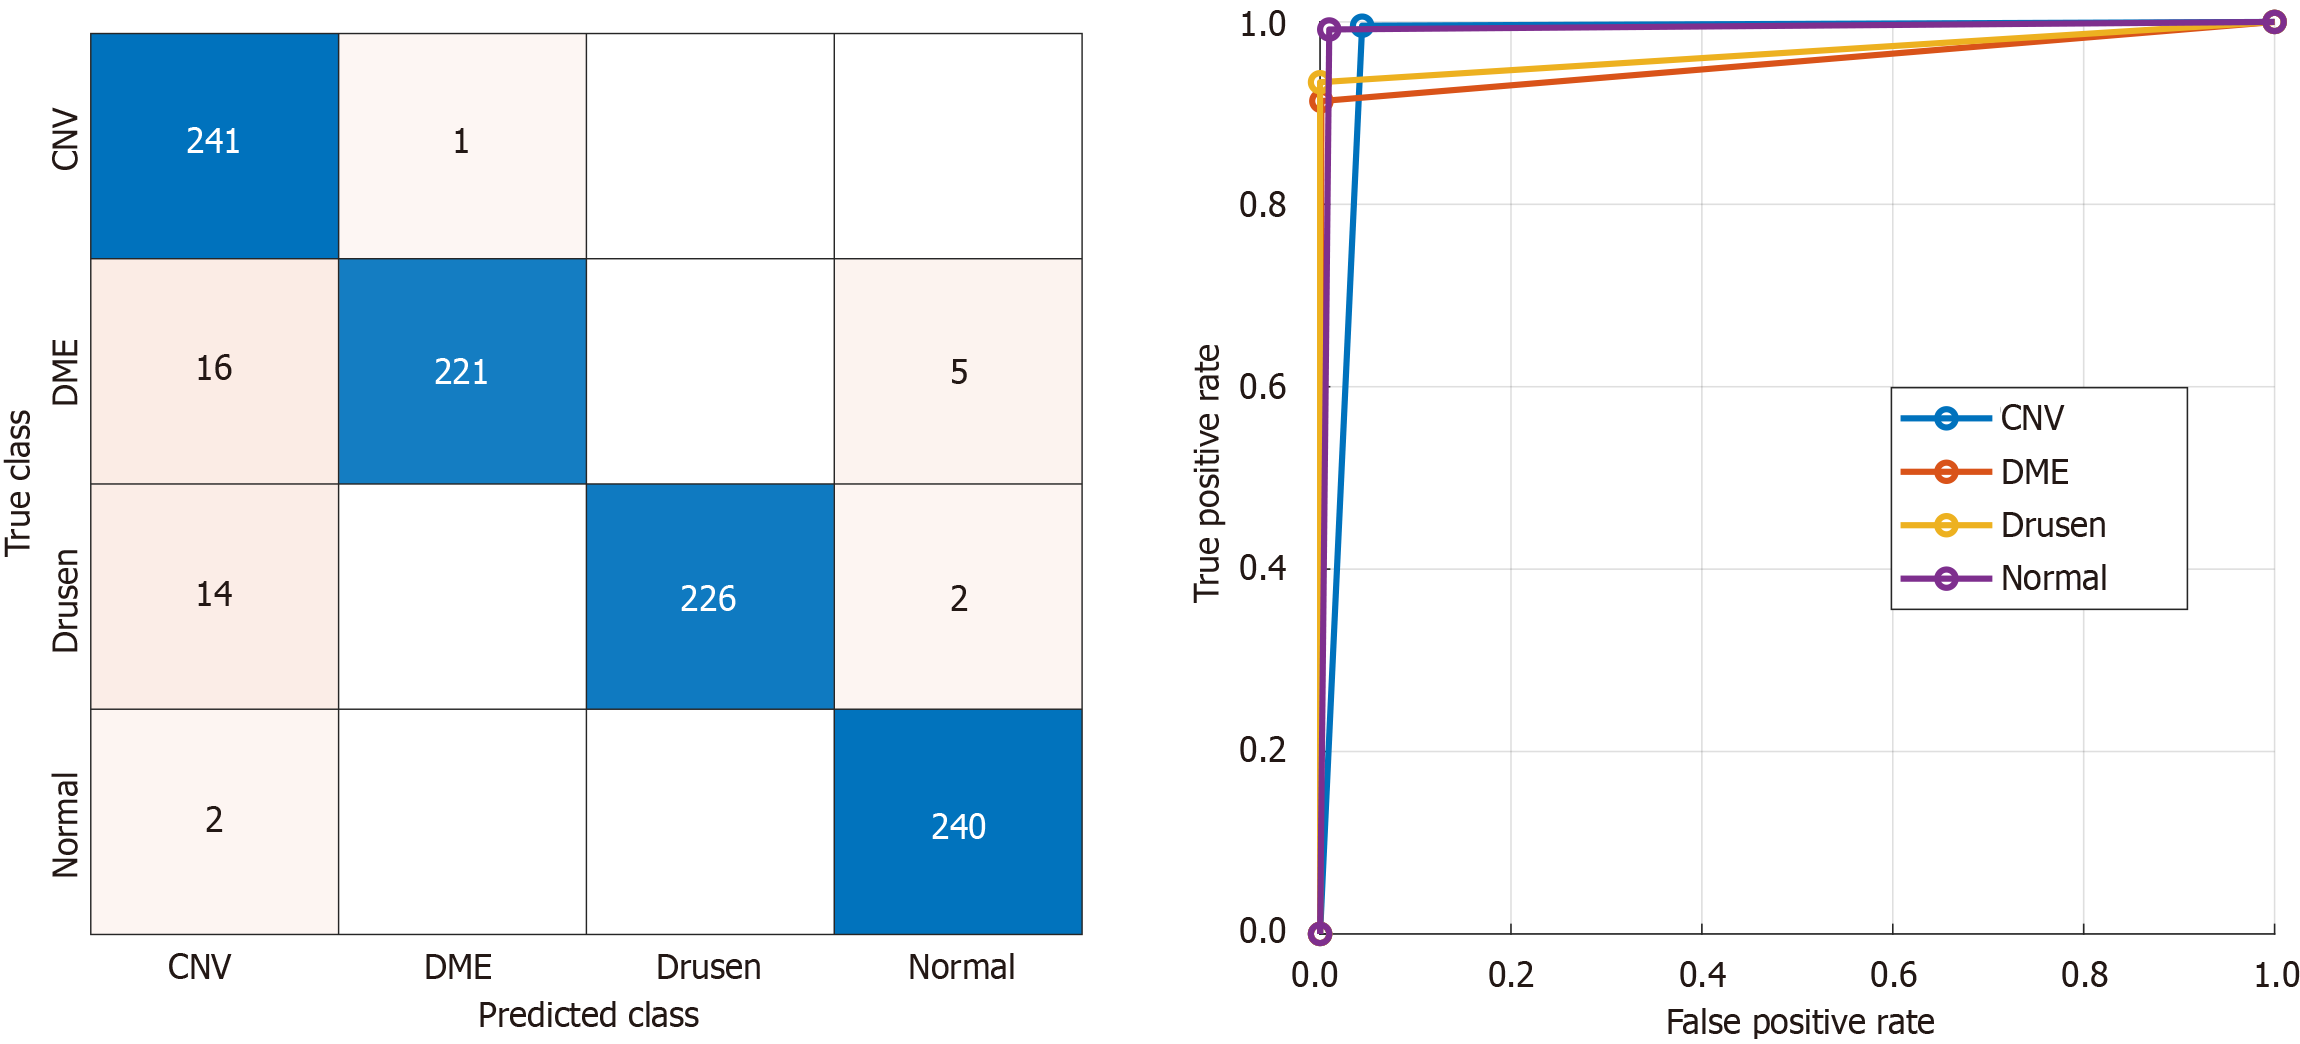
In this study, we developed a specialized model for classifying OCT images using the Self-AttentionNeXt CNN architecture. The model was implemented and trained using MATLAB 2023. The training processes were carried out on a Windows 11 Professional computer powered by an Intel i9 13900 central processing unit with a turbo processor speed of 5.80 GHz, boasting 128 GB of main memory. To evaluate performance, we utilized two datasets. The first is a dataset we collected, comprising two specific orientations: From left to right and from top to bottom. Additionally, we incorporated the widely recognized Mendeley dataset. All three datasets were trained using the proposed Self-AttentionNeXt. During the training phase, we maintained a split ratio of 70:30 for training to validation data. The training and validation performance curves for these datasets are presented in Figure 6. To train these datasets, the utilized hyperparameters have been given below. Solver: Stochastic gradient descend momentum, learning rate: 0.01, mini batch size: 128, number of epochs: 30, training and validation separation ratio: 70:30. Using the trained dataset, we obtained the test results. We employed performance metrics for evaluation including accuracy, sensitivity, specificity, precision, and F1-score. The test results are presented in Tables 5 and 6. The confusion matrices corresponding to these test results are illustrated in Figures 7 and 8.
| Dataset | Class | Accuracy | Sensitivity | Specificity | Precision | F1-score | AUROC |
| From left to right | Healthy control | 97.49 | 96.92 | 97.84 | 96.55 | 96.74 | 97.38 |
| Schizophrenia | 97.84 | 96.92 | 98.07 | 97.95 | 97.38 | ||
| Overall | 97.38 | 97.38 | 97.31 | 97.35 | 97.38 | ||
| From top to bottom | Healthy control | 98.96 | 98.08 | 99.52 | 99.22 | 98.65 | 98.80 |
| Schizophrenia | 99.52 | 98.08 | 98.81 | 99.16 | 98.80 | ||
| Overall | 98.80 | 98.80 | 99.02 | 98.91 | 98.80 |
| Classes | Accuracy | Sensitivity | Specificity | Precision | F1-score | AUROC |
| CNV | 95.87 | 99.59 | 95.59 | 88.28 | 93.59 | 97.59 |
| DME | 91.32 | 99.86 | 99.55 | 95.26 | 95.59 | |
| Drusen | 93.39 | 100 | 100 | 96.58 | 96.69 | |
| Normal | 99.17 | 99.04 | 97.17 | 98.16 | 99.10 | |
| Overall | 95.87 | 98.63 | 96.25 | 95.90 | 97.25 |
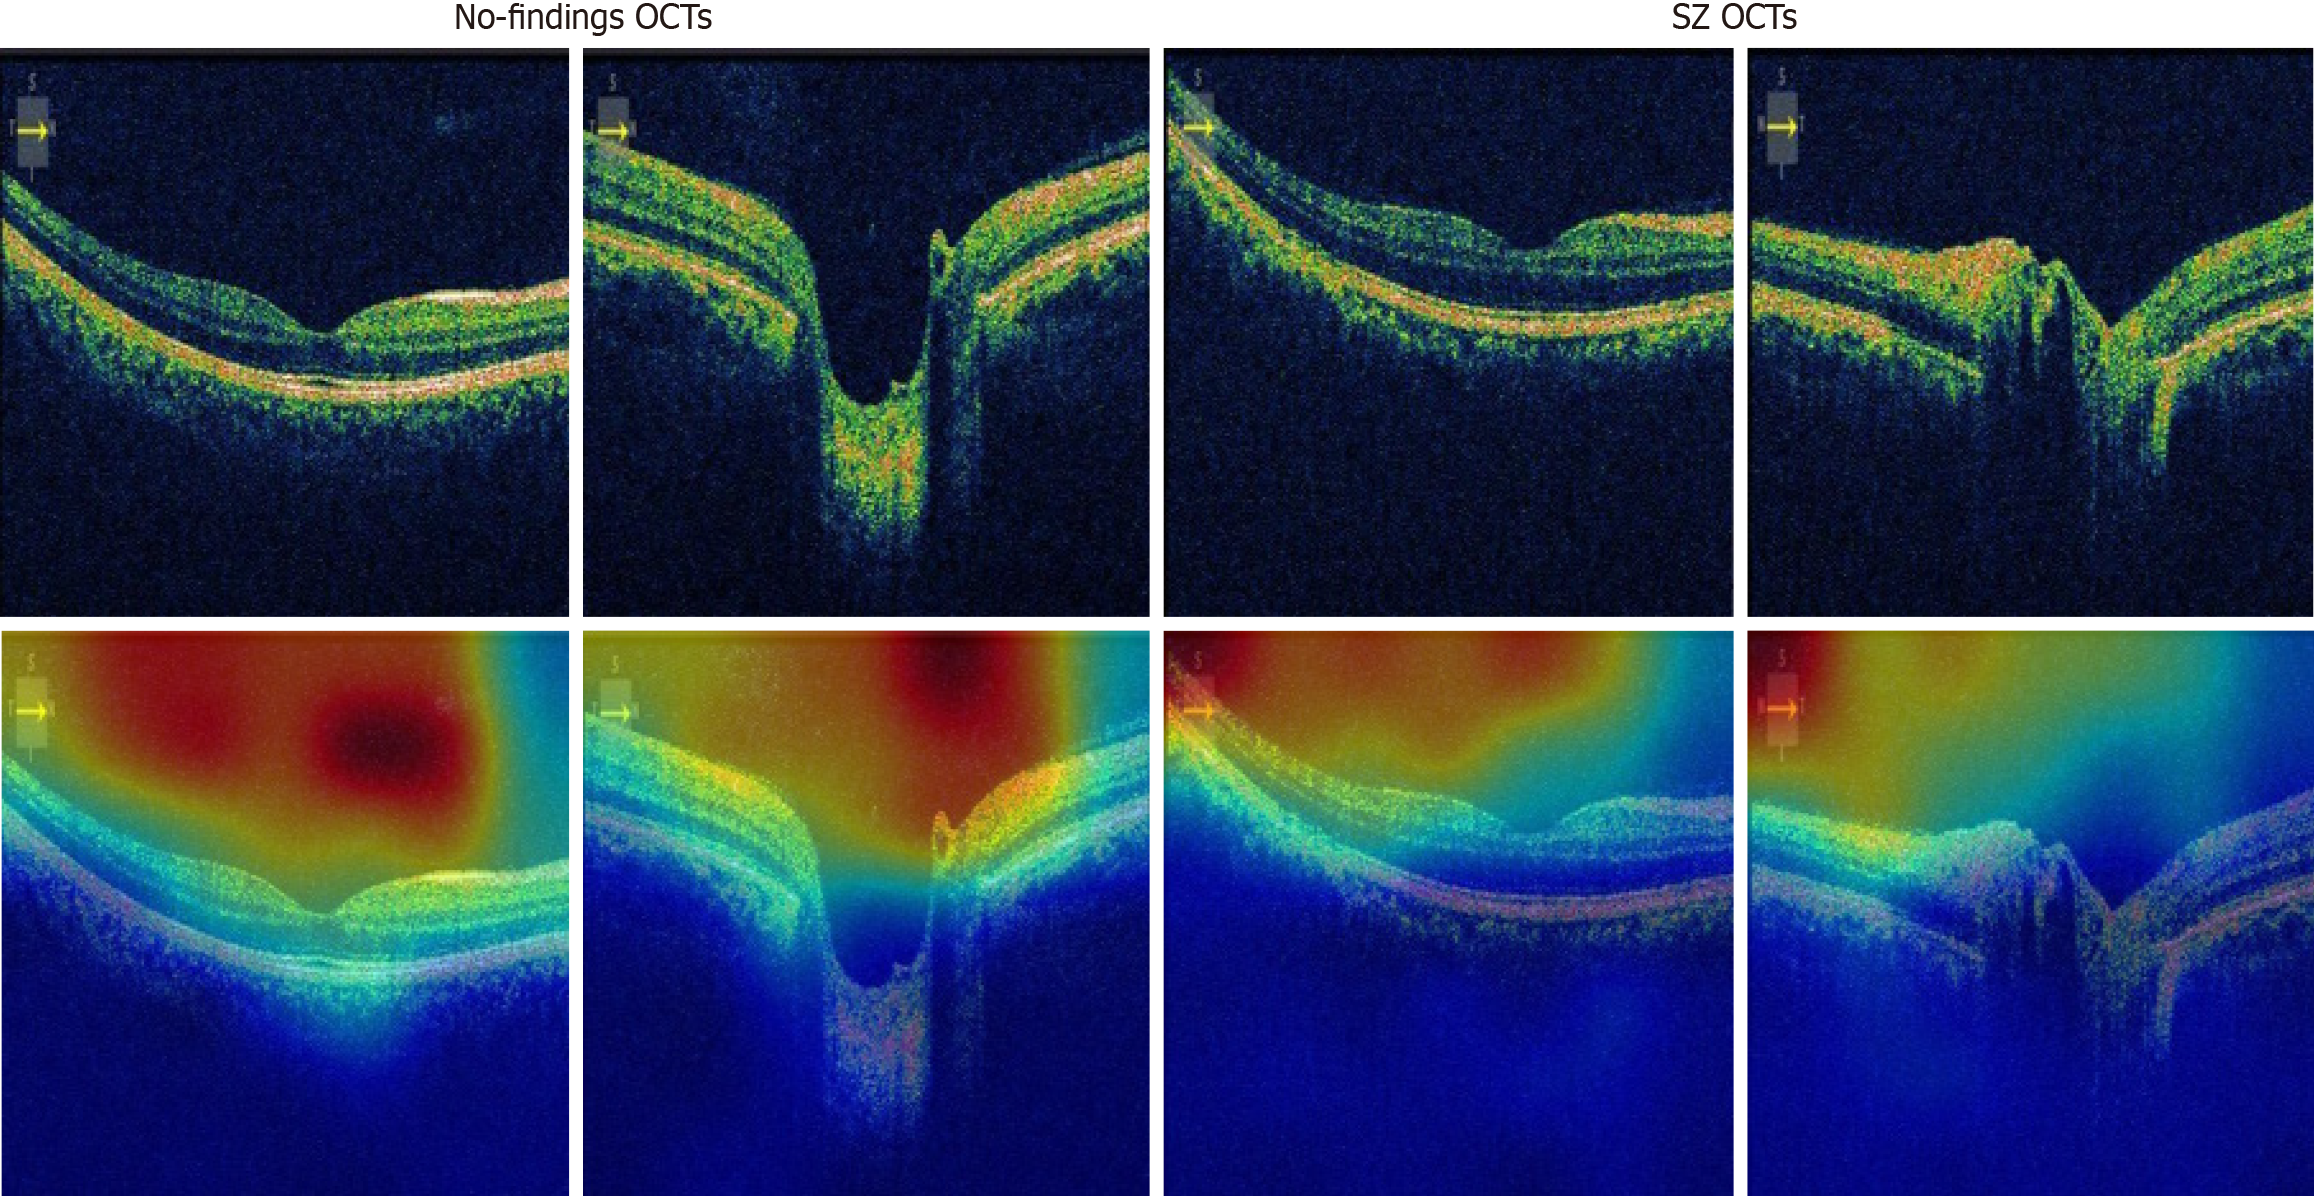
The second dataset utilized is the Mendeley OCT (OCT2017) dataset, frequently employed for OCT image studies in the literature. We used this dataset to obtain comparative results. The test results for the Mendeley OCT dataset are presented in Table 6. To corroborate the results presented in Table 5, the computed confusion matrix for the Mendeley dataset is depicted in Figure 8. Based on the test results, our proposed model achieved test accuracies of 97.49% and 98.96% for from left to right and from top to bottom cases, respectively. Additionally, using the OCT2017 dataset, our model reached a test accuracy of 95.87%. We employed gradient-weighted class activation mapping (Grad-CAM) activation to obtain interpretable results[50]. Grad-CAM generates heatmaps, effectively illustrating the areas of interest within the images, commonly referred to as ROI areas. Given the attention-oriented nature of our model, we anticipated the focus on these ROIs. The corresponding results are visualized in Figure 9. As depicted in Figure 9, the proposed model directs its focus towards the lower-right areas of the SZ OCTs. In contrast, for control images, the ROI encompasses the entirety of the bottom and middle areas. In this study, while Grad-CAM heatmaps highlight relevant retinal regions, no statistical correlation analyses with quantitative RNFL thickness were performed, which will be addressed in future work.
Timely detection and treatment of psychiatric disorders is of great importance in improving the quality of life of individuals and stopping the progression of these diseases. This study exemplifies the potential of a new approach to the diagnosis of psychiatric disorders that involves the integration of different disciplines such as OCT and machine learning. More specifically, emphasis is placed on examining microscopic changes in the layers of the retina to diagnose complex conditions such as SZ. Traditional methods often try to diagnose the disease after its symptoms appear. In conclusion, this study offers a different approach to the detection of SZ than previous studies. It also highlights the gap in extensive research conducted at the intersection of disciplines such as AI and OCT. Therefore, this study can be considered a step that can form a basis for future research and offer new perspectives in diagnosing and treating psychiatric diseases. It has been determined that there is no study in the literature for diagnosing SZ with OCT images. Therefore, the Mendeley OCT dataset was used to validate the effectiveness of our proposed model. Current studies with the Mendeley OCT dataset in the literature are tabulated in Table 7 as state-of-the-art technology[51-54].
| Ref. | Model | Dataset | Results, n (%) |
| He et al[51] | Swin-poly transformer network | OCT2017 | Accuracy: 99.80; precision: 99.80; recall: 99.80; F1-score: 99.80; AUC: 99.99 |
| Yoo et al[52] | Few-shot learning, generative adversarial network | OCT2017 | Accuracy: 93.90 |
| Huang et al[53] | Novel layer guided CNN | OCT2017 | Accuracy: 93.30; sensitivity: 93.30; specificity: 93.30; precision: 91.50 |
| Rajagopalan et al[54] | CNN, Kuan filter | OCT2017 | Accuracy: 95.70 |
| Self-AttentionNeXt | OCT2017 | Accuracy: 95.87; sensitivity: 95.86; specificity: 98.62; F1-score: 96.25; precision: 95.89 | |
He et al[51] introduced a transformer-based framework and used the OCT2017 dataset for testing. They achieved nearly 100% classification accuracy by applying fine-tuning operations and they showcased the efficiency of transformers in medical image classification. However, we didn’t use any fine-tuning. Yoo et al[52] used few-shot learning with generative adversarial networks and obtained 93.90% accuracy. Huang et al[53] developed a CNN model and reached 93.30% accuracy on the OCT2017 dataset.
Our recommended Self-AttentionNeXt combines CNNs with self-attention blocks. Our presented self-attention block is a fully convolutional block. Our CNN achieved 95.87% accuracy on the OCT dataset and we demonstrated that the used convolutional self-attention increased classification performance with fewer learnable parameters. Additionally, using our collected dataset, the introduced Self-AttentionNeXt architecture attained over 97% test accuracy in both cases. The test results confirmed that Self-AttentionNeXt consistently achieved over 95% accuracy across all datasets.
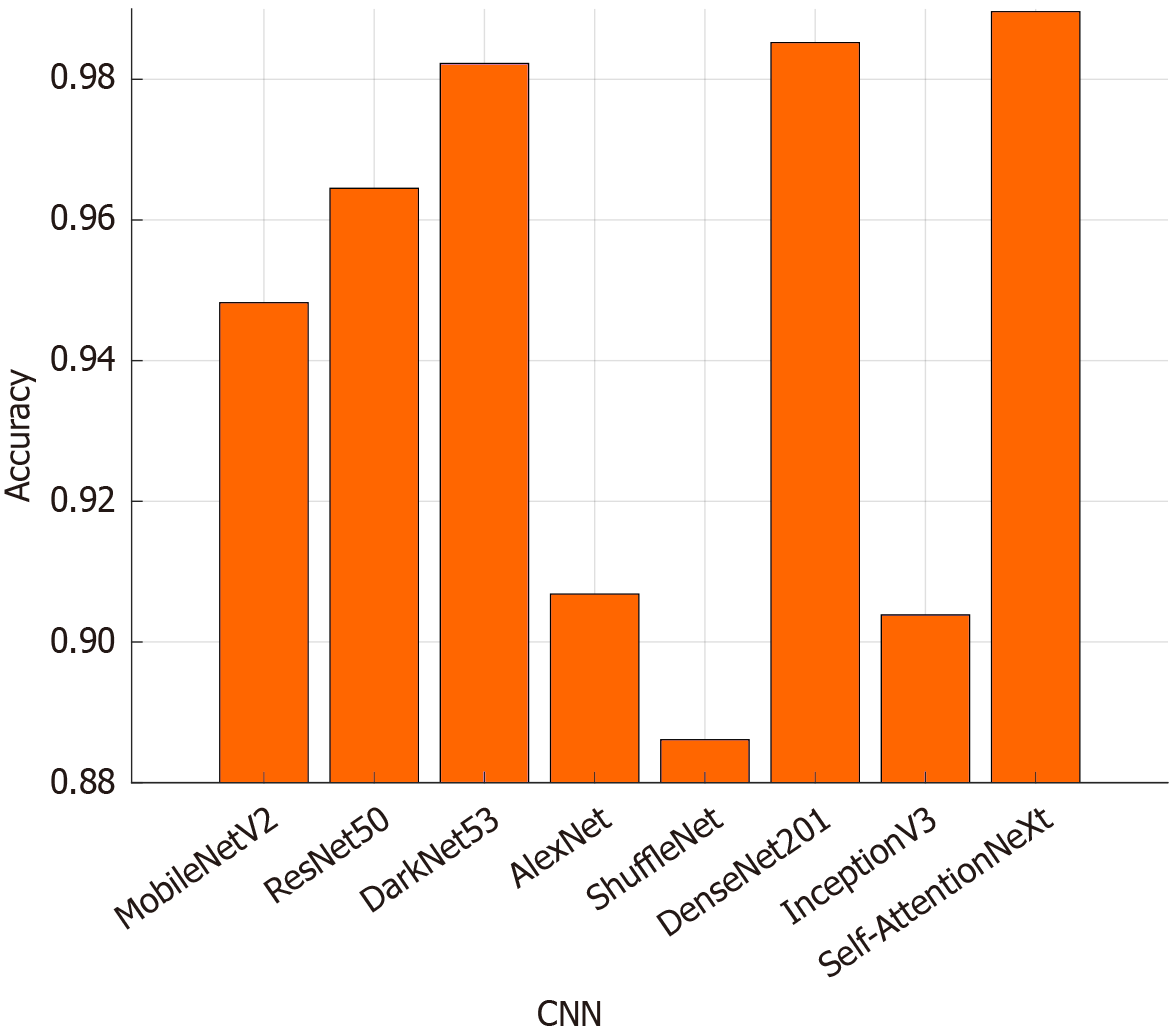
We also compared Self-AttentionNeXt with seven well-known CNN models: MobileNetV2[55], ResNet50[56], DarkNet53[57], AlexNet[58], ShuffleNet[59], DenseNet201[60], and InceptionV3[61]. The classification accuracies of these models are shown in Figure 10. Figure 10 showcases that Self-AttentionNeXt achieved 98.96% test accuracy, outperforming DenseNet201 (98.52%) and DarkNet53 (98.22%). ShuffleNet had the lowest performance with 88.61% test accuracy, making it the weakest CNN in this comparison.
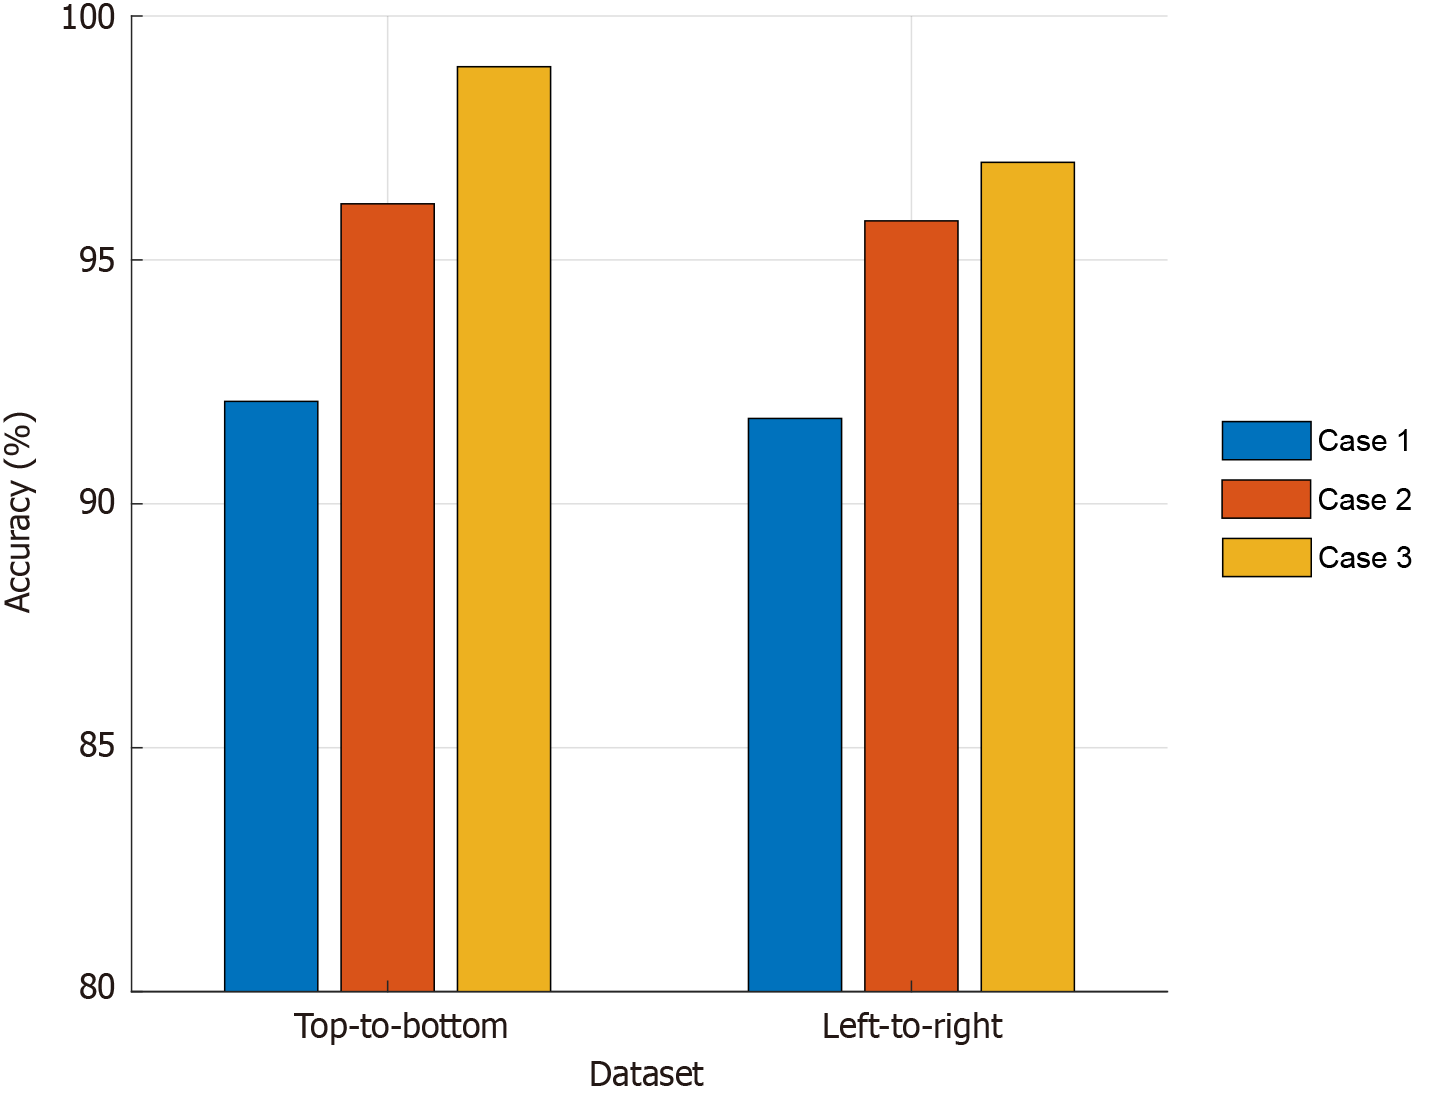
We conducted ablation studies to demonstrate the high classification performance of the recommended model. Three cases were defined and are explained below. Case 1: Only inverted bottleneck; case 2: Only the recommended convolution-based transformer; case 3: The presented Self-AttentionNeXt. For the utilized two datasets (top-to-bottom and left-to-right), the computed test results have been given in Figure 11. Only the inverted bottleneck yields 92.10% on top-to-bottom scans and 91.75% on left-to-right scans. This baseline works well but still leaves room for improvement. Adding the convolution-based transformer raises accuracy to 96.15% and 95.80%. This model uses grouped convolutions for attention and an implicit mask. The full Self-AttentionNeXt then reaches 98.96 % and 97.49 %. It combines the attention mask, inverted-bottleneck, and residual shortcut to gain the best results. The similar gains on both scan directions show that our design handles input variation robustly.
Beyond model performance, it is essential to consider whether the observed retinal changes are specific to SZ or reflect more generalized neurodegenerative alterations. In Alzheimer’s disease, RNFL thinning especially in superior and inferior quadrants and macular changes have been consistently linked with disease severity and hippocampal atrophy[62-66] In glaucoma, RNFL and ganglion cell layer thinning is also prominent but tends to present with more localized and asymmetric patterns[62]. In SZ, studies report significant thinning of the peripapillary RNFL, macular ganglion cell inner plexiform layer, and choroid, with correlations to illness duration, symptom severity, and antipsychotic exposure[67-71]. Moreover, electrophysiological alterations such as reduced ERG amplitudes have been noted[68,70]. While certain OCT findings overlap across neurological diseases, SZ presents a distinct pattern of retinal alterations with potential diagnostic and prognostic utility[72].
The findings and advantages of this research have been discussed below. Findings: (1) The proposed Self-AttentionNeXt architecture achieved high classification performances on the utilized two OCT image datasets; (2) Using a well-known dataset, the performance comparison results have been computed; (3) The self-attention mechanism demonstrated that the introduced Self-AttnetionNeXt architecture focus on key ROI; (4) Testing on two datasets further validated the model’s robustness; and (5) The results with our curated dataset and Self-AttentionNeXt indicate that OCT images could be useful for SZ detection. Advantages: (1) Self-AttentionNeXt combines self-attention with traditional CNN structures; (2) The model is specifically designed for OCT image classification; (3) With only 9.8 million trainable parameters, the model is efficient and suitable for real-time applications; and (4) The study highlights OCT images as a promising tool for SZ detection.
In this section, limitations and future works have been presented. Limitations: (1) Although the dataset (67 patients, 46 controls) offers a solid foundation, its limited size and class imbalance may affect generalizability; future studies could benefit from larger, age-matched samples; (2) Differences in age and the influence of antipsychotic medications were not fully accounted for, which may have impacted the results; (3) While the model showed encouraging performance during testing, further validation in real-world clinical settings is needed; (4) We evaluated the Swin Transformer on our dataset and achieved 100% accuracy. Our model reached 98.96% accuracy. Our model is lightweight, while the Swin Transformer is not. This performance gap is acceptable; and (5) Additionally, the potential confounding effects of different antipsychotic medication types (e.g., olanzapine, risperidone, amisulpride, aripiprazole, clozapine) and treatment duration were not stratified in the current analysis. Since certain medications may induce retinal changes independent of SZ pathology, this represents an important limitation. In future studies, we plan to perform stratified analyses based on medication type, dosage, and treatment duration, to better disentangle medication effects from disease-related retinal alterations.
Future works: (1) We will expand the dataset by collaborating with multiple clinical centers and including diverse ethnicities, age groups, and regions to improve generalizability and reduce demographic bias; (2) Our team’s research plan is to optimize Self-AttentionNeXt and explore new self-attention techniques; (3) The presented CNN can be tested in clinical environments to assess its real-world applicability; (4) The model can be tested in clinical environments to assess its real-world applicability; (5) The detection ability of Self-AttentionNeXt for other psychiatric or neurological disorders using OCT images can be investigated; (6) We will collaborate with psychiatry, neuroscience, and radiology experts to gain interdisciplinary insights; (7) We plan to explore OCT images for a broader range of psychiatric conditions to enhance early diagnostics; (8) Clinical metrics such as RNFL thickness and illness duration will be incorporated into future datasets to enable correlation analyses and strengthen model interpretability; (9) Future work could explore new convolution-based attention models; (10) Our dataset has a class imbalance. Healthy controls make up about 60% of samples. We plan to address this by adding synthetic minority samples with synthetic minority over-sampling technique, by undersampling the majority class, and by using class-weighted loss during training. We also lack quantitative efficiency metrics. In future work, we will report inference speed in frames per second and measure average energy consumption per image. These metrics will help evaluate the model’s clinical feasibility and deployment requirements; and (11) We plan to implement and compare both early fusion (feature-level concatenation) and late fusion (decision-level ensemble) strategies for combining OCT, magnetic resonance imaging, and cognitive data. Attention-based fusion layers or co-attention modules will be explored to enhance cross-modal feature interactions.
In this study, we applied Self-AttentionNeXt to OCT images to detect differences in schizophrenic OCT scans. This research examines the use of OCT images in psychiatric studies. We evaluated Self-AttentionNeXt on two OCT datasets, where it consistently showed high test accuracy and performed well in detecting SZ. These results demonstrate its potential for psychiatric diagnosis. Self-AttentionNeXt maintained strong accuracy across different OCT datasets, confirming its reliability for detecting psychiatric disorders, especially SZ. Its high performance in identifying SZ suggests that it can help improve diagnostic accuracy. This study also shows that OCT images can be useful for machine learning applications in psychiatric research. Combining imaging technologies with machine learning provides a practical approach for SZ detection. Our findings suggest that Self-AttentionNeXt and OCT images can support early diagnosis of psychiatric disorders. The results highlight how medical imaging and machine learning can work together to improve psychiatric diagnostics.
| 1. | Kim JS, Ishikawa H, Sung KR, Xu J, Wollstein G, Bilonick RA, Gabriele ML, Kagemann L, Duker JS, Fujimoto JG, Schuman JS. Retinal nerve fibre layer thickness measurement reproducibility improved with spectral domain optical coherence tomography. Br J Ophthalmol. 2009;93:1057-1063. [RCA] [PubMed] [DOI] [Full Text] [Full Text (PDF)] [Cited by in Crossref: 94] [Cited by in RCA: 101] [Article Influence: 5.9] [Reference Citation Analysis (0)] |
| 2. | Fujimoto JG. Optical coherence tomography for ultrahigh resolution in vivo imaging. Nat Biotechnol. 2003;21:1361-1367. [RCA] [PubMed] [DOI] [Full Text] [Cited by in Crossref: 719] [Cited by in RCA: 579] [Article Influence: 26.3] [Reference Citation Analysis (9)] |
| 3. | Ahlers C, Schmidt-Erfurth U. Three-dimensional high resolution OCT imaging of macular pathology. Opt Express. 2009;17:4037-4045. [RCA] [PubMed] [DOI] [Full Text] [Cited by in Crossref: 9] [Cited by in RCA: 7] [Article Influence: 0.4] [Reference Citation Analysis (0)] |
| 4. | Sakata LM, Deleon-Ortega J, Sakata V, Girkin CA. Optical coherence tomography of the retina and optic nerve - a review. Clin Exp Ophthalmol. 2009;37:90-99. [RCA] [PubMed] [DOI] [Full Text] [Cited by in Crossref: 155] [Cited by in RCA: 176] [Article Influence: 10.4] [Reference Citation Analysis (0)] |
| 5. | Shoba LK, Kumar PM. An Ophthalmic Evaluation of Central Serous Chorioretinopathy. Comput Syst Sci Eng. 2023;44:613-628. [DOI] [Full Text] |
| 6. | Kumar P, Dhara S, Gope A, Chatterjee J, Mandal S. Deep Learning based Skin-layer Segmentation for Characterizing Cutaneous Wounds from Optical Coherence Tomography Images. Annu Int Conf IEEE Eng Med Biol Soc. 2023;2023:1-4. [RCA] [PubMed] [DOI] [Full Text] [Cited by in RCA: 2] [Reference Citation Analysis (0)] |
| 7. | London A, Benhar I, Schwartz M. The retina as a window to the brain-from eye research to CNS disorders. Nat Rev Neurol. 2013;9:44-53. [RCA] [PubMed] [DOI] [Full Text] [Cited by in Crossref: 586] [Cited by in RCA: 933] [Article Influence: 66.6] [Reference Citation Analysis (0)] |
| 8. | Hosak L, Sery O, Sadykov E, Studnicka J. Retinal abnormatilites as a diagnostic or prognostic marker of schizophrenia. Biomed Pap Med Fac Univ Palacky Olomouc Czech Repub. 2018;162:159-164. [RCA] [PubMed] [DOI] [Full Text] [Cited by in Crossref: 17] [Cited by in RCA: 18] [Article Influence: 2.3] [Reference Citation Analysis (0)] |
| 9. | Sheehan N, Bannai D, Silverstein SM, Lizano P. Neuroretinal Alterations in Schizophrenia and Bipolar Disorder: An Updated Meta-analysis. Schizophr Bull. 2024;50:1067-1082. [RCA] [PubMed] [DOI] [Full Text] [Full Text (PDF)] [Cited by in Crossref: 13] [Cited by in RCA: 16] [Article Influence: 8.0] [Reference Citation Analysis (0)] |
| 10. | Lee WW, Tajunisah I, Sharmilla K, Peyman M, Subrayan V. Retinal nerve fiber layer structure abnormalities in schizophrenia and its relationship to disease state: evidence from optical coherence tomography. Invest Ophthalmol Vis Sci. 2013;54:7785-7792. [RCA] [PubMed] [DOI] [Full Text] [Cited by in Crossref: 97] [Cited by in RCA: 122] [Article Influence: 9.4] [Reference Citation Analysis (0)] |
| 11. | Schönfeldt-Lecuona C, Kregel T, Schmidt A, Pinkhardt EH, Lauda F, Kassubek J, Connemann BJ, Freudenmann RW, Gahr M. From Imaging the Brain to Imaging the Retina: Optical Coherence Tomography (OCT) in Schizophrenia. Schizophr Bull. 2016;42:9-14. [RCA] [PubMed] [DOI] [Full Text] [Cited by in Crossref: 7] [Cited by in RCA: 26] [Article Influence: 2.6] [Reference Citation Analysis (0)] |
| 12. | Jerotic S, Ignjatovic Z, Silverstein SM, Maric NP. Structural imaging of the retina in psychosis spectrum disorders: current status and perspectives. Curr Opin Psychiatry. 2020;33:476-483. [RCA] [PubMed] [DOI] [Full Text] [Cited by in Crossref: 3] [Cited by in RCA: 4] [Article Influence: 0.7] [Reference Citation Analysis (0)] |
| 13. | Silverstein SM. Invited Session V: The eye as a window to systemic and neurodegenerative health: Disturbances of retinal structure in schizophrenia spectrum disorders and their clinical implications. J Vis. 2023;23:28. [RCA] [DOI] [Full Text] [Cited by in RCA: 1] [Reference Citation Analysis (0)] |
| 14. | Kashani AH, Asanad S, Chan JW, Singer MB, Zhang J, Sharifi M, Khansari MM, Abdolahi F, Shi Y, Biffi A, Chui H, Ringman JM. Past, present and future role of retinal imaging in neurodegenerative disease. Prog Retin Eye Res. 2021;83:100938. [RCA] [PubMed] [DOI] [Full Text] [Cited by in Crossref: 28] [Cited by in RCA: 102] [Article Influence: 20.4] [Reference Citation Analysis (0)] |
| 15. | Nieuwenhuys R, Voogd J, Huijzen C. The Human Central Nervous System. 4th ed. New York: Springer, 2008. [DOI] [Full Text] |
| 16. | Erskine L, Herrera E. Connecting the retina to the brain. ASN Neuro. 2014;6:1759091414562107. [RCA] [PubMed] [DOI] [Full Text] [Full Text (PDF)] [Cited by in Crossref: 135] [Cited by in RCA: 146] [Article Influence: 12.2] [Reference Citation Analysis (0)] |
| 17. | Margalit E, Sadda SR. Retinal and optic nerve diseases. Artif Organs. 2003;27:963-974. [RCA] [PubMed] [DOI] [Full Text] [Cited by in Crossref: 72] [Cited by in RCA: 77] [Article Influence: 3.3] [Reference Citation Analysis (0)] |
| 18. | Yeap S, Kelly SP, Sehatpour P, Magno E, Garavan H, Thakore JH, Foxe JJ. Visual sensory processing deficits in Schizophrenia and their relationship to disease state. Eur Arch Psychiatry Clin Neurosci. 2008;258:305-316. [RCA] [PubMed] [DOI] [Full Text] [Cited by in Crossref: 65] [Cited by in RCA: 67] [Article Influence: 3.7] [Reference Citation Analysis (0)] |
| 19. | Chu EM, Kolappan M, Barnes TR, Joyce EM, Ron MA. A window into the brain: an in vivo study of the retina in schizophrenia using optical coherence tomography. Psychiatry Res. 2012;203:89-94. [RCA] [PubMed] [DOI] [Full Text] [Cited by in Crossref: 88] [Cited by in RCA: 107] [Article Influence: 7.6] [Reference Citation Analysis (0)] |
| 20. | Vujosevic S, Parra MM, Hartnett ME, O'Toole L, Nuzzi A, Limoli C, Villani E, Nucci P. Optical coherence tomography as retinal imaging biomarker of neuroinflammation/neurodegeneration in systemic disorders in adults and children. Eye (Lond). 2023;37:203-219. [RCA] [PubMed] [DOI] [Full Text] [Full Text (PDF)] [Cited by in Crossref: 27] [Cited by in RCA: 70] [Article Influence: 23.3] [Reference Citation Analysis (0)] |
| 21. | Silverstein SM, Rosen R. Schizophrenia and the eye. Schizophr Res Cogn. 2015;2:46-55. [RCA] [PubMed] [DOI] [Full Text] [Full Text (PDF)] [Cited by in Crossref: 106] [Cited by in RCA: 148] [Article Influence: 13.5] [Reference Citation Analysis (0)] |
| 22. | Hong H, Kim BS, Im HI. Pathophysiological Role of Neuroinflammation in Neurodegenerative Diseases and Psychiatric Disorders. Int Neurourol J. 2016;20:S2-S7. [RCA] [PubMed] [DOI] [Full Text] [Full Text (PDF)] [Cited by in Crossref: 147] [Cited by in RCA: 196] [Article Influence: 19.6] [Reference Citation Analysis (0)] |
| 23. | Kim GW, Kim YH, Jeong GW. Whole brain volume changes and its correlation with clinical symptom severity in patients with schizophrenia: A DARTEL-based VBM study. PLoS One. 2017;12:e0177251. [RCA] [PubMed] [DOI] [Full Text] [Full Text (PDF)] [Cited by in Crossref: 29] [Cited by in RCA: 39] [Article Influence: 4.3] [Reference Citation Analysis (0)] |
| 24. | Almonte MT, Capellàn P, Yap TE, Cordeiro MF. Retinal correlates of psychiatric disorders. Ther Adv Chronic Dis. 2020;11:2040622320905215. [RCA] [PubMed] [DOI] [Full Text] [Full Text (PDF)] [Cited by in Crossref: 12] [Cited by in RCA: 39] [Article Influence: 6.5] [Reference Citation Analysis (0)] |
| 25. | Schönfeldt-Lecuona C, Kregel T, Schmidt A, Kassubek J, Dreyhaupt J, Freudenmann RW, Connemann BJ, Gahr M, Pinkhardt EH. Retinal single-layer analysis with optical coherence tomography (OCT) in schizophrenia spectrum disorder. Schizophr Res. 2020;219:5-12. [RCA] [PubMed] [DOI] [Full Text] [Cited by in Crossref: 19] [Cited by in RCA: 32] [Article Influence: 5.3] [Reference Citation Analysis (0)] |
| 26. | Silverstein SM, Paterno D, Cherneski L, Green S. Optical coherence tomography indices of structural retinal pathology in schizophrenia. Psychol Med. 2018;48:2023-2033. [RCA] [PubMed] [DOI] [Full Text] [Cited by in Crossref: 50] [Cited by in RCA: 61] [Article Influence: 7.6] [Reference Citation Analysis (0)] |
| 27. | Baydili İ, Tasci B, Tasci G. Artificial Intelligence in Psychiatry: A Review of Biological and Behavioral Data Analyses. Diagnostics (Basel). 2025;15:434. [RCA] [PubMed] [DOI] [Full Text] [Full Text (PDF)] [Cited by in Crossref: 3] [Cited by in RCA: 16] [Article Influence: 16.0] [Reference Citation Analysis (0)] |
| 28. | Erten M, Aydemir E, Barua PD, Baygin M, Dogan S, Tuncer T, Tan R, Hafeez-Baig A, Rajendra Acharya U. Novel tiny textural motif pattern-based RNA virus protein sequence classification model. Expert Syst Appl. 2024;242:122781. [DOI] [Full Text] |
| 29. | Tatli S, Macin G, Tasci I, Tasci B, Barua PD, Baygin M, Tuncer T, Dogan S, Ciaccio EJ, Acharya UR. Transfer-transfer model with MSNet: An automated accurate multiple sclerosis and myelitis detection system. Expert Syst Appl. 2024;236:121314. [RCA] [DOI] [Full Text] [Cited by in Crossref: 11] [Cited by in RCA: 9] [Article Influence: 4.5] [Reference Citation Analysis (0)] |
| 30. | Kilic M, Barua PD, Keles T, Yildiz AM, Tuncer I, Dogan S, Baygin M, Tuncer T, Kuluozturk M, Tan R, Acharya UR. GCLP: An automated asthma detection model based on global chaotic logistic pattern using cough sounds. Eng Appl Artif Intell. 2024;127:107184. [DOI] [Full Text] |
| 31. | De Fauw J, Ledsam JR, Romera-Paredes B, Nikolov S, Tomasev N, Blackwell S, Askham H, Glorot X, O'Donoghue B, Visentin D, van den Driessche G, Lakshminarayanan B, Meyer C, Mackinder F, Bouton S, Ayoub K, Chopra R, King D, Karthikesalingam A, Hughes CO, Raine R, Hughes J, Sim DA, Egan C, Tufail A, Montgomery H, Hassabis D, Rees G, Back T, Khaw PT, Suleyman M, Cornebise J, Keane PA, Ronneberger O. Clinically applicable deep learning for diagnosis and referral in retinal disease. Nat Med. 2018;24:1342-1350. [RCA] [PubMed] [DOI] [Full Text] [Cited by in Crossref: 1420] [Cited by in RCA: 1271] [Article Influence: 158.9] [Reference Citation Analysis (12)] |
| 32. | Asaoka R, Murata H, Hirasawa K, Fujino Y, Matsuura M, Miki A, Kanamoto T, Ikeda Y, Mori K, Iwase A, Shoji N, Inoue K, Yamagami J, Araie M. Using Deep Learning and Transfer Learning to Accurately Diagnose Early-Onset Glaucoma From Macular Optical Coherence Tomography Images. Am J Ophthalmol. 2019;198:136-145. [RCA] [PubMed] [DOI] [Full Text] [Cited by in Crossref: 112] [Cited by in RCA: 151] [Article Influence: 21.6] [Reference Citation Analysis (0)] |
| 33. | Christopher M, Bowd C, Belghith A, Goldbaum MH, Weinreb RN, Fazio MA, Girkin CA, Liebmann JM, Zangwill LM. Deep Learning Approaches Predict Glaucomatous Visual Field Damage from OCT Optic Nerve Head En Face Images and Retinal Nerve Fiber Layer Thickness Maps. Ophthalmology. 2020;127:346-356. [RCA] [PubMed] [DOI] [Full Text] [Cited by in Crossref: 64] [Cited by in RCA: 128] [Article Influence: 18.3] [Reference Citation Analysis (0)] |
| 34. | Heisler M, Karst S, Lo J, Mammo Z, Yu T, Warner S, Maberley D, Beg MF, Navajas EV, Sarunic MV. Ensemble Deep Learning for Diabetic Retinopathy Detection Using Optical Coherence Tomography Angiography. Transl Vis Sci Technol. 2020;9:20. [RCA] [PubMed] [DOI] [Full Text] [Full Text (PDF)] [Cited by in Crossref: 38] [Cited by in RCA: 56] [Article Influence: 9.3] [Reference Citation Analysis (0)] |
| 35. | Tsuji T, Hirose Y, Fujimori K, Hirose T, Oyama A, Saikawa Y, Mimura T, Shiraishi K, Kobayashi T, Mizota A, Kotoku J. Classification of optical coherence tomography images using a capsule network. BMC Ophthalmol. 2020;20:114. [RCA] [PubMed] [DOI] [Full Text] [Full Text (PDF)] [Cited by in Crossref: 16] [Cited by in RCA: 38] [Article Influence: 6.3] [Reference Citation Analysis (0)] |
| 36. | Thomas A, Sunija AP, Manoj R, Ramachandran R, Ramachandran S, Varun PG, Palanisamy P. RPE layer detection and baseline estimation using statistical methods and randomization for classification of AMD from retinal OCT. Comput Methods Programs Biomed. 2021;200:105822. [RCA] [PubMed] [DOI] [Full Text] [Cited by in Crossref: 20] [Cited by in RCA: 17] [Article Influence: 3.4] [Reference Citation Analysis (0)] |
| 37. | Kim J, Tran L. Retinal Disease Classification from OCT Images Using Deep Learning Algorithms. 2021 IEEE Conference on Computational Intelligence in Bioinformatics and Computational Biology (CIBCB); 2021 Oct 13-15; Melbourne, Australia. United States: IEEE Xplore, 2021: 1-6. [DOI] [Full Text] |
| 38. | Yoon J, Han J, Ko J, Choi S, Park JI, Hwang JS, Han JM, Jang K, Sohn J, Park KH, Hwang DD. Classifying central serous chorioretinopathy subtypes with a deep neural network using optical coherence tomography images: a cross-sectional study. Sci Rep. 2022;12:422. [RCA] [PubMed] [DOI] [Full Text] [Full Text (PDF)] [Cited by in RCA: 8] [Reference Citation Analysis (0)] |
| 39. | Ko J, Han J, Yoon J, Park JI, Hwang JS, Han JM, Park KH, Hwang DD. Assessing central serous chorioretinopathy with deep learning and multiple optical coherence tomography images. Sci Rep. 2022;12:1831. [RCA] [PubMed] [DOI] [Full Text] [Full Text (PDF)] [Cited by in Crossref: 1] [Cited by in RCA: 14] [Article Influence: 3.5] [Reference Citation Analysis (0)] |
| 40. | Li HY, Wang DX, Dong L, Wei WB. Deep learning algorithms for detection of diabetic macular edema in OCT images: A systematic review and meta-analysis. Eur J Ophthalmol. 2023;33:278-290. [RCA] [PubMed] [DOI] [Full Text] [Cited by in RCA: 6] [Reference Citation Analysis (0)] |
| 41. | Karthik K, Mahadevappa M. Convolution neural networks for optical coherence tomography (OCT) image classification. Biomed Signal Process Control. 2023;79:104176. [RCA] [DOI] [Full Text] [Cited by in RCA: 17] [Reference Citation Analysis (0)] |
| 42. | Elbadawi M, Gaisford S, Basit AW. Advanced machine-learning techniques in drug discovery. Drug Discov Today. 2021;26:769-777. [RCA] [PubMed] [DOI] [Full Text] [Cited by in Crossref: 37] [Cited by in RCA: 77] [Article Influence: 12.8] [Reference Citation Analysis (0)] |
| 43. | Coalson TS, Van Essen DC, Glasser MF. The impact of traditional neuroimaging methods on the spatial localization of cortical areas. Proc Natl Acad Sci U S A. 2018;115:E6356-E6365. [RCA] [PubMed] [DOI] [Full Text] [Cited by in Crossref: 169] [Cited by in RCA: 226] [Article Influence: 28.3] [Reference Citation Analysis (0)] |
| 44. | Yang B, Wang L, Wong DF, Shi S, Tu Z. Context-aware Self-Attention Networks for Natural Language Processing. Neurocomputing. 2021;458:157-169. [RCA] [DOI] [Full Text] [Cited by in Crossref: 6] [Cited by in RCA: 12] [Article Influence: 2.4] [Reference Citation Analysis (0)] |
| 45. | Balikov DA, Hu K, Liu CJ, Betz BL, Chinnaiyan AM, Devisetty LV, Venneti S, Tomlins SA, Cani AK, Rao RC. Comparative Molecular Analysis of Primary Central Nervous System Lymphomas and Matched Vitreoretinal Lymphomas by Vitreous Liquid Biopsy. Int J Mol Sci. 2021;22:9992. [RCA] [PubMed] [DOI] [Full Text] [Full Text (PDF)] [Cited by in Crossref: 6] [Cited by in RCA: 14] [Article Influence: 2.8] [Reference Citation Analysis (0)] |
| 46. | Samy MM, Shaaban YM, Badran TAF. Age- and sex-related differences in corneal epithelial thickness measured with spectral domain anterior segment optical coherence tomography among Egyptians. Medicine (Baltimore). 2017;96:e8314. [RCA] [PubMed] [DOI] [Full Text] [Full Text (PDF)] [Cited by in Crossref: 9] [Cited by in RCA: 26] [Article Influence: 2.9] [Reference Citation Analysis (0)] |
| 47. | Gambichler T, Matip R, Moussa G, Altmeyer P, Hoffmann K. In vivo data of epidermal thickness evaluated by optical coherence tomography: effects of age, gender, skin type, and anatomic site. J Dermatol Sci. 2006;44:145-152. [RCA] [PubMed] [DOI] [Full Text] [Cited by in Crossref: 163] [Cited by in RCA: 158] [Article Influence: 7.9] [Reference Citation Analysis (0)] |
| 48. | Adhi M, Aziz S, Muhammad K, Adhi MI. Macular thickness by age and gender in healthy eyes using spectral domain optical coherence tomography. PLoS One. 2012;7:e37638. [RCA] [PubMed] [DOI] [Full Text] [Full Text (PDF)] [Cited by in Crossref: 57] [Cited by in RCA: 83] [Article Influence: 5.9] [Reference Citation Analysis (0)] |
| 49. | Kermany D, Zhang K, Goldbaum M. Labeled Optical Coherence Tomography (OCT) and Chest X-Ray Images for Classification. Mendeley Data. 2018;2:651. [DOI] [Full Text] |
| 50. | Selvaraju RR, Cogswell M, Das A, Vedantam R, Parikh D, Batra D. Grad-CAM: Visual Explanations from Deep Networks via Gradient-Based Localization. 2017 IEEE International Conference on Computer Vision (ICCV); 2017 Oct 22-29; Venice, Italy. United States: IEEE Xplore, 2017: 618-626. [DOI] [Full Text] |
| 51. | He J, Wang J, Han Z, Ma J, Wang C, Qi M. An interpretable transformer network for the retinal disease classification using optical coherence tomography. Sci Rep. 2023;13:3637. [RCA] [PubMed] [DOI] [Full Text] [Full Text (PDF)] [Cited by in RCA: 37] [Reference Citation Analysis (0)] |
| 52. | Yoo TK, Choi JY, Kim HK. Feasibility study to improve deep learning in OCT diagnosis of rare retinal diseases with few-shot classification. Med Biol Eng Comput. 2021;59:401-415. [RCA] [PubMed] [DOI] [Full Text] [Full Text (PDF)] [Cited by in Crossref: 58] [Cited by in RCA: 57] [Article Influence: 11.4] [Reference Citation Analysis (0)] |
| 53. | Huang LF, He XX, Fang LY, Rabbani H, Chen XD. Automatic Classification of Retinal Optical Coherence Tomography Images With Layer Guided Convolutional Neural Network. IEEE Signal Process Lett. 2019;26:1026-1030. [DOI] [Full Text] |
| 54. | Rajagopalan N, Narasimhan V, Kunnavakkam Vinjimoor S, Aiyer J. Deep CNN framework for retinal disease diagnosis using optical coherence tomography images. J Ambient Intell Human Comput. 2021;12:7569-7580. [DOI] [Full Text] |
| 55. | Sandler M, Howard A, Zhu M, Zhmoginov A, Chen LC. MobileNetV2: Inverted Residuals and Linear Bottlenecks. 2018 IEEE/CVF Conference on Computer Vision and Pattern Recognition; 2018 Jun 18-23; Salt Lake City, UT, United States. United States: IEEE Xplore, 2018: 4510-4520. [DOI] [Full Text] |
| 56. | Tank VH, Ghosh R, Gupta V, Sheth N, Gordon S, He W, Modica SF, Prestigiacomo CJ, Gandhi CD. Drug eluting stents versus bare metal stents for the treatment of extracranial vertebral artery disease: a meta-analysis. J Neurointerv Surg. 2016;8:770-774. [RCA] [PubMed] [DOI] [Full Text] [Cited by in Crossref: 24] [Cited by in RCA: 38] [Article Influence: 3.5] [Reference Citation Analysis (0)] |
| 57. | Redmon J, Farhadi A. YOLO9000: Better, Faster, Stronger. 2017 IEEE Conference on Computer Vision and Pattern Recognition (CVPR); 2017 Jul 21-26; Honolulu, HI, United States. United States: IEEE Xplore, 2017: 6517-6525. [DOI] [Full Text] |
| 58. | Krizhevsky A, Sutskever I, Hinton GE. ImageNet classification with deep convolutional neural networks. Commun ACM. 2017;60:84-90. [DOI] [Full Text] |
| 59. | Zhang X, Zhou X, Lin M, Sun J. Shufflenet: An extremely efficient convolutional neural network for mobile devices. 2018 IEEE/CVF Conference on Computer Vision and Pattern Recognition; 2018 Jun 18-23; Salt Lake City, UT, United States. United States: IEEE Xplore, 2018: 6848-6856. [DOI] [Full Text] |
| 60. | Huang G, Liu Z, Van Der Maaten L, Weinberger KQ. Densely Connected Convolutional Networks. 2017 IEEE Conference on Computer Vision and Pattern Recognition (CVPR); 2017 Jul 21-26; Honolulu, HI, United States. United States: IEEE Xplore, 2017: 2261-2269. [DOI] [Full Text] |
| 61. | Szegedy C, Vanhoucke V, Ioffe S, Shlens J, Wojna Z. Rethinking the Inception Architecture for Computer Vision. 2016 IEEE Conference on Computer Vision and Pattern Recognition (CVPR); 2016 Jun 27-30; Las Vegas, NV, United States. United States: IEEE Xplore, 2016: 2818-2826. [DOI] [Full Text] |
| 62. | Jones-Odeh E, Hammond CJ. How strong is the relationship between glaucoma, the retinal nerve fibre layer, and neurodegenerative diseases such as Alzheimer's disease and multiple sclerosis? Eye (Lond). 2015;29:1270-1284. [RCA] [PubMed] [DOI] [Full Text] [Cited by in Crossref: 43] [Cited by in RCA: 58] [Article Influence: 5.3] [Reference Citation Analysis (0)] |
| 63. | Kim JI, Kang BH. Decreased retinal thickness in patients with Alzheimer's disease is correlated with disease severity. PLoS One. 2019;14:e0224180. [RCA] [PubMed] [DOI] [Full Text] [Full Text (PDF)] [Cited by in Crossref: 19] [Cited by in RCA: 43] [Article Influence: 6.1] [Reference Citation Analysis (0)] |
| 64. | Salobrar-García E, de Hoz R, Ramírez AI, López-Cuenca I, Rojas P, Vazirani R, Amarante C, Yubero R, Gil P, Pinazo-Durán MD, Salazar JJ, Ramírez JM. Changes in visual function and retinal structure in the progression of Alzheimer's disease. PLoS One. 2019;14:e0220535. [RCA] [PubMed] [DOI] [Full Text] [Full Text (PDF)] [Cited by in Crossref: 65] [Cited by in RCA: 81] [Article Influence: 11.6] [Reference Citation Analysis (0)] |
| 65. | Chen S, Zhang D, Zheng H, Cao T, Xia K, Su M, Meng Q. The association between retina thinning and hippocampal atrophy in Alzheimer's disease and mild cognitive impairment: a meta-analysis and systematic review. Front Aging Neurosci. 2023;15:1232941. [RCA] [PubMed] [DOI] [Full Text] [Cited by in RCA: 13] [Reference Citation Analysis (0)] |
| 66. | Eppenberger LS, Li C, Wong D, Tan B, Garhöfer G, Hilal S, Chong E, Toh AQ, Venketasubramanian N, Chen CL, Schmetterer L, Chua J. Retinal thickness predicts the risk of cognitive decline over five years. Alzheimers Res Ther. 2024;16:273. [RCA] [PubMed] [DOI] [Full Text] [Cited by in RCA: 6] [Reference Citation Analysis (0)] |
| 67. | Shew W, Zhang DJ, Menkes DB, Danesh-Meyer HV. Optical Coherence Tomography in Schizophrenia Spectrum Disorders: A Systematic Review and Meta-analysis. Biol Psychiatry Glob Open Sci. 2024;4:19-30. [RCA] [PubMed] [DOI] [Full Text] [Full Text (PDF)] [Cited by in RCA: 7] [Reference Citation Analysis (0)] |
| 68. | Komatsu H, Onoguchi G, Silverstein SM, Jerotic S, Sakuma A, Kanahara N, Kakuto Y, Ono T, Yabana T, Nakazawa T, Tomita H. Retina as a potential biomarker in schizophrenia spectrum disorders: a systematic review and meta-analysis of optical coherence tomography and electroretinography. Mol Psychiatry. 2024;29:464-482. [RCA] [PubMed] [DOI] [Full Text] [Full Text (PDF)] [Cited by in Crossref: 2] [Cited by in RCA: 21] [Article Influence: 10.5] [Reference Citation Analysis (0)] |
| 69. | Gonzalez-Diaz JM, Radua J, Sanchez-Dalmau B, Camos-Carreras A, Zamora DC, Bernardo M. Mapping Retinal Abnormalities in Psychosis: Meta-analytical Evidence for Focal Peripapillary and Macular Reductions. Schizophr Bull. 2022;48:1194-1205. [RCA] [PubMed] [DOI] [Full Text] [Cited by in RCA: 21] [Reference Citation Analysis (0)] |
| 70. | Boudriot E, Schworm B, Slapakova L, Hanken K, Jäger I, Stephan M, Gabriel V, Ioannou G, Melcher J, Hasanaj G, Campana M, Moussiopoulou J, Löhrs L, Hasan A, Falkai P, Pogarell O, Priglinger S, Keeser D, Kern C, Wagner E, Raabe FJ. Optical coherence tomography reveals retinal thinning in schizophrenia spectrum disorders. Eur Arch Psychiatry Clin Neurosci. 2023;273:575-588. [RCA] [PubMed] [DOI] [Full Text] [Full Text (PDF)] [Cited by in RCA: 23] [Reference Citation Analysis (0)] |
| 71. | Kango A, Grover S, Gupta V, Sahoo S, Nehra R. A comparative study of retinal layer changes among patients with schizophrenia and healthy controls. Acta Neuropsychiatr. 2023;35:165-176. [RCA] [PubMed] [DOI] [Full Text] [Cited by in RCA: 6] [Reference Citation Analysis (0)] |
| 72. | Kazakos CT, Karageorgiou V. Retinal Changes in Schizophrenia: A Systematic Review and Meta-analysis Based on Individual Participant Data. Schizophr Bull. 2020;46:27-42. [RCA] [PubMed] [DOI] [Full Text] [Cited by in Crossref: 6] [Cited by in RCA: 28] [Article Influence: 4.7] [Reference Citation Analysis (0)] |


