©The Author(s) 2017.
World J Psychiatr. Jun 22, 2017; 7(2): 121-127
Published online Jun 22, 2017. doi: 10.5498/wjp.v7.i2.121
Published online Jun 22, 2017. doi: 10.5498/wjp.v7.i2.121
Figure 1 The three-dimensional stereotactic surface projection results of two representative cases.
A: Female, 59 years old; MMSE 26, HAM-D 18, CGI 3; showed significant reduction of perfusion in the AD-associated region (the superior parietal lobule and posterior cingulate gyrus); B: Female, 64 years old; MMSE 28, HAM-D 9, CGI 2; showed significant reduction of perfusion in the depression-associated region (the inferior frontal gyrus). HAM-D: Hamilton Rating Scale for Depression; MMSE: Minimal Mental State Examination; CGI: Clinical Global Impression; AD: Alzheimer’s disease.
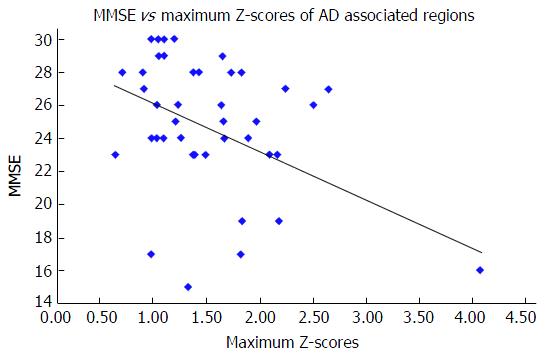
Figure 2 Correlations between Minimal Mental State Examination scores and the maximum Z scores of Alzheimer’s disease-associated regions.
The MMSE scores correlated significantly with the maximum Z-scores of AD-associated regions. MMSE: Minimal Mental State Examination; AD: Alzheimer’s disease.
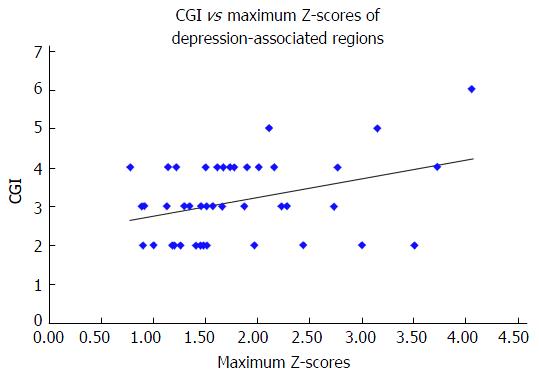
Figure 3 Correlations between Clinical Global Impression-Severity scale scores and the maximum Z scores of depression-associated regions.
The CGI-S scores correlated significantly with the maximum Z-scores of depression-associated regions. CGI: Clinical Global Impression.
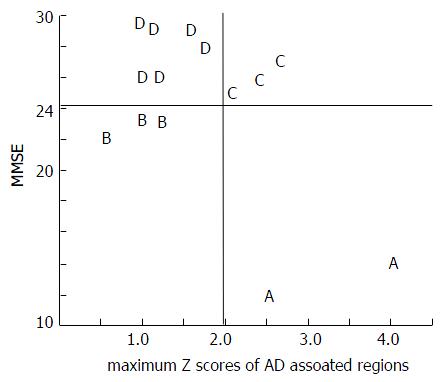
Figure 4 Schematic representation of the classification system.
Types (2 × 2 = 4 types) were determined based on the AD rating (positive/negative) and on the MMSE findings (positive/negative). Data from individual patients are plotted by type (A, B, C, and D) on the graph. The X-axis indicates the AD-associated region Z-scores and the Y-axis indicates the MMSE scores. A: True AD; B: Pseud dementia; C: Occult AD; D: True depression. MMSE: Minimal Mental State Examination; AD: Alzheimer’s disease.
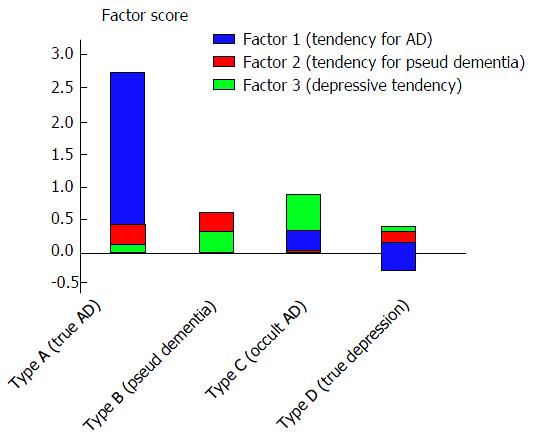
Figure 5 Scores for each factor for each type.
Type A cases (true AD) had high factor scores for Factor 1 (tendency for AD); Type B cases (pseudo-dementia) had high factor scores for Factor 2 (tendency for pseudo-dementia); and Type D cases had high factor scores for Factor 3 (depressive tendency), thus validating the type determination method. Type C cases (occult AD) had high factor scores for Factors 1 and 3, suggesting that this type shows a strong tendency for AD while also presenting with a depressive tendency. AD: Alzheimer’s disease.
- Citation: Kirino E. Three-dimensional stereotactic surface projection in the statistical analysis of single photon emission computed tomography data for distinguishing between Alzheimer’s disease and depression. World J Psychiatr 2017; 7(2): 121-127
- URL: https://www.wjgnet.com/2220-3206/full/v7/i2/121.htm
- DOI: https://dx.doi.org/10.5498/wjp.v7.i2.121


