
















Copyright: ©Author(s) 2026.
World J Psychiatry. Sep 19, 2026; 16(9): 121407
Published online Sep 19, 2026. doi: 10.5498/wjp.121407
Published online Sep 19, 2026. doi: 10.5498/wjp.121407
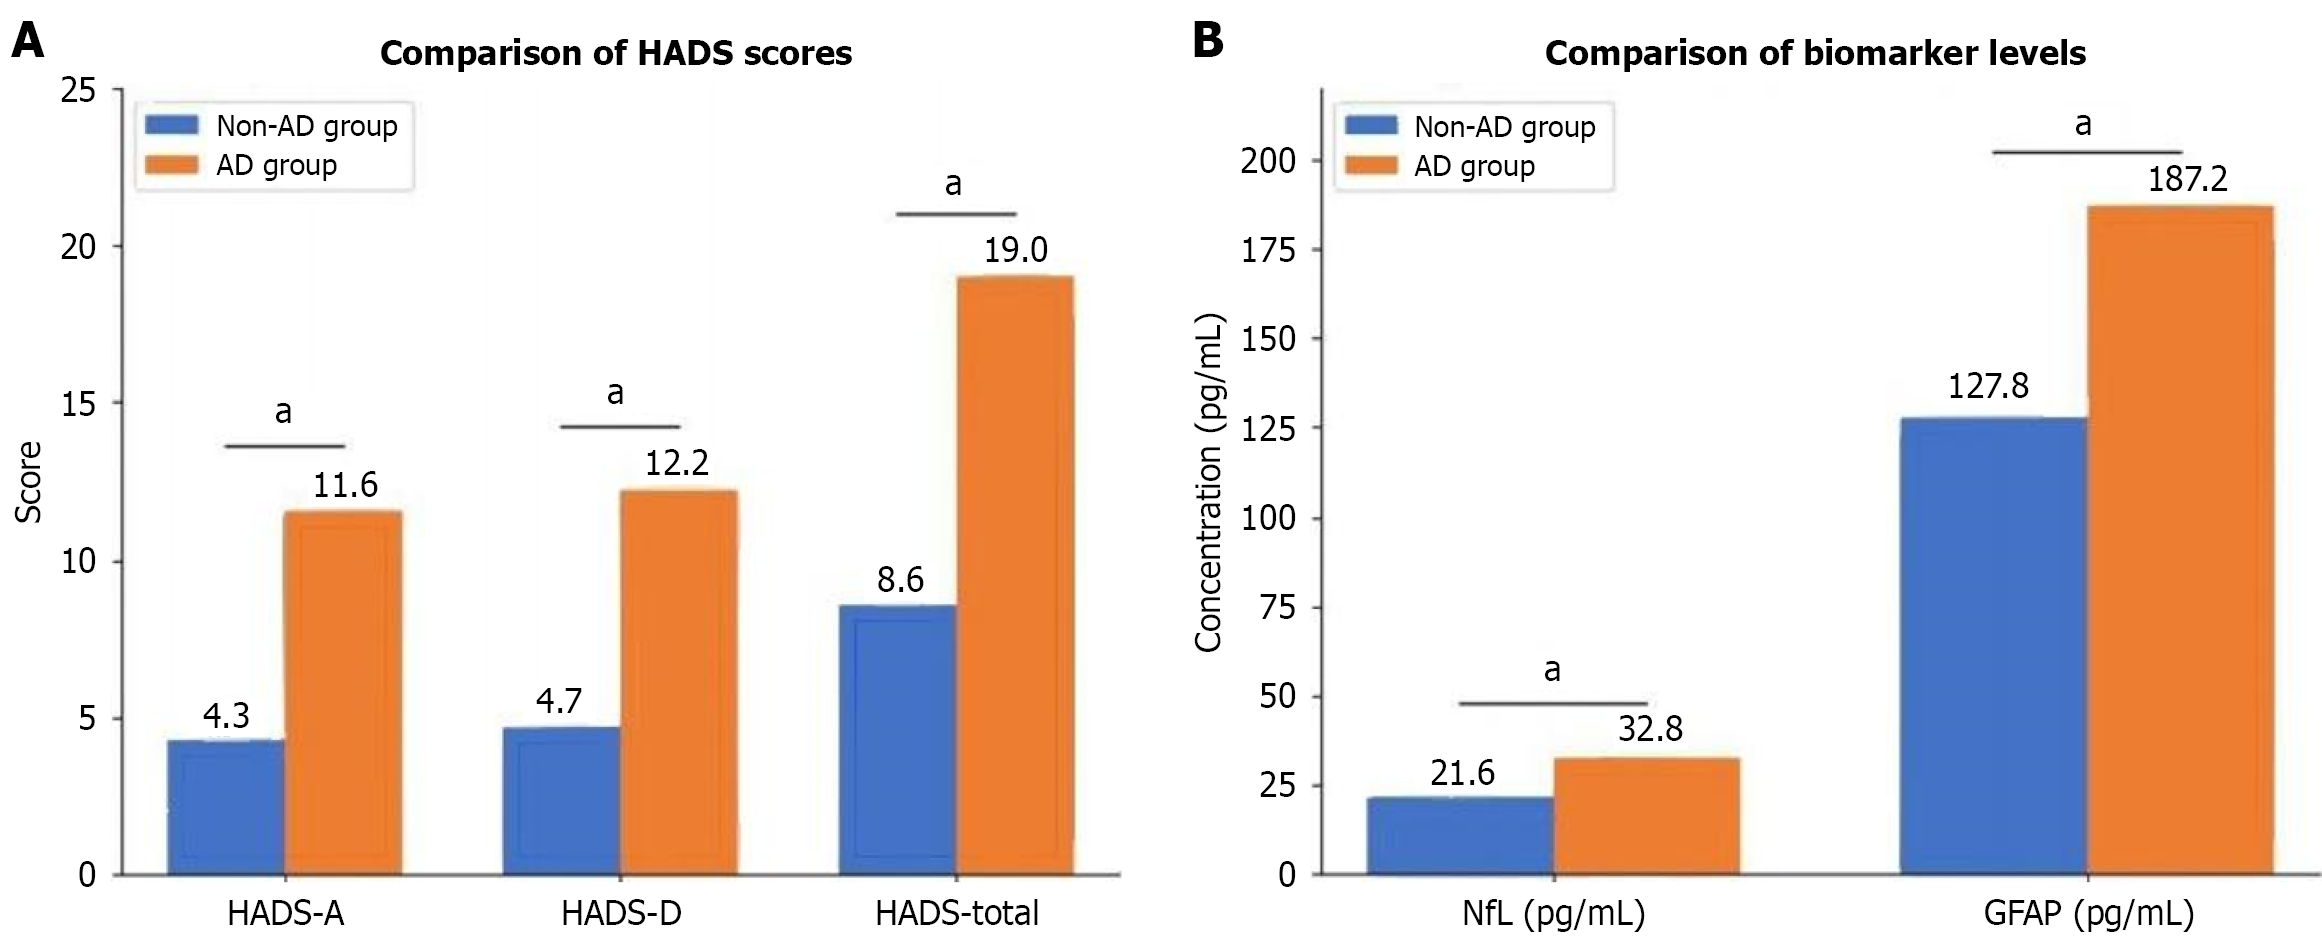
Figure 1 Comparison of different groups.
aP < 0.05. A: Comparison of Hospital Anxiety and Depression Scale scores; B: Comparison of biomarker levels between groups. HADS: Hospital Anxiety and Depression Scale; HADS-A: Hospital Anxiety and Depression Scale-Anxiety subscale; HADS-D: Hospital Anxiety and Depression Scale-Depression subscale; NfL: Neurofilament light chain; GFAP: Glial fibrillary acidic protein; AD: Alzheimer’s disease.
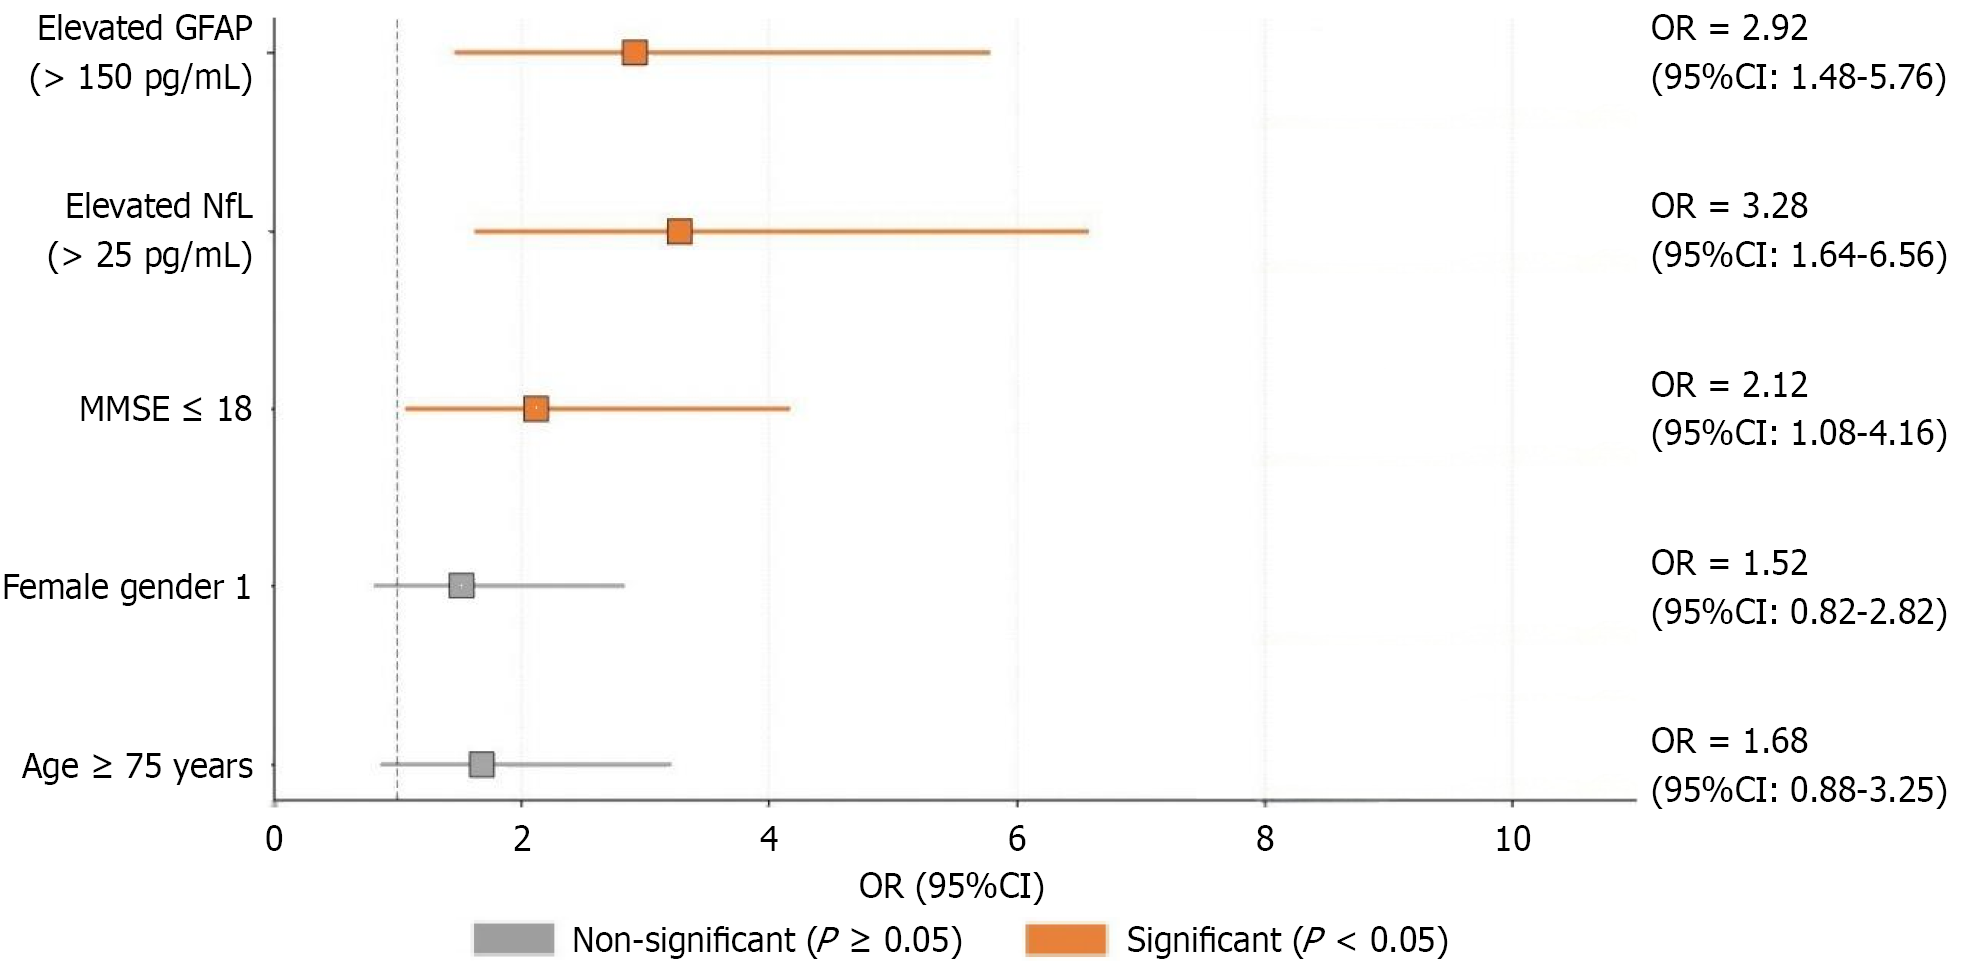
Figure 2 Forest plot of multivariate logistic regression analysis (n = 270).
Orange squares indicate significant associations (P < 0.05); gray squares indicate non-significant associations. NfL: Neurofilament light chain; GFAP: Glial fibrillary acidic protein; MMSE: Mini-Mental State Examination; CI: Confidence interval; OR: Odds ratio.
- Citation: Xu GW, Zhu XL, Yin CH. Serum NfL and GFAP levels and their association with anxiety-depression in Alzheimer’s disease patients: A clinical retrospective study. World J Psychiatry 2026; 16(9): 121407
- URL: https://www.wjgnet.com/2220-3206/full/v16/i9/121407.htm
- DOI: https://dx.doi.org/10.5498/wjp.121407