
















Copyright: ©Author(s) 2026.
World J Psychiatry. Sep 19, 2026; 16(9): 118381
Published online Sep 19, 2026. doi: 10.5498/wjp.118381
Published online Sep 19, 2026. doi: 10.5498/wjp.118381
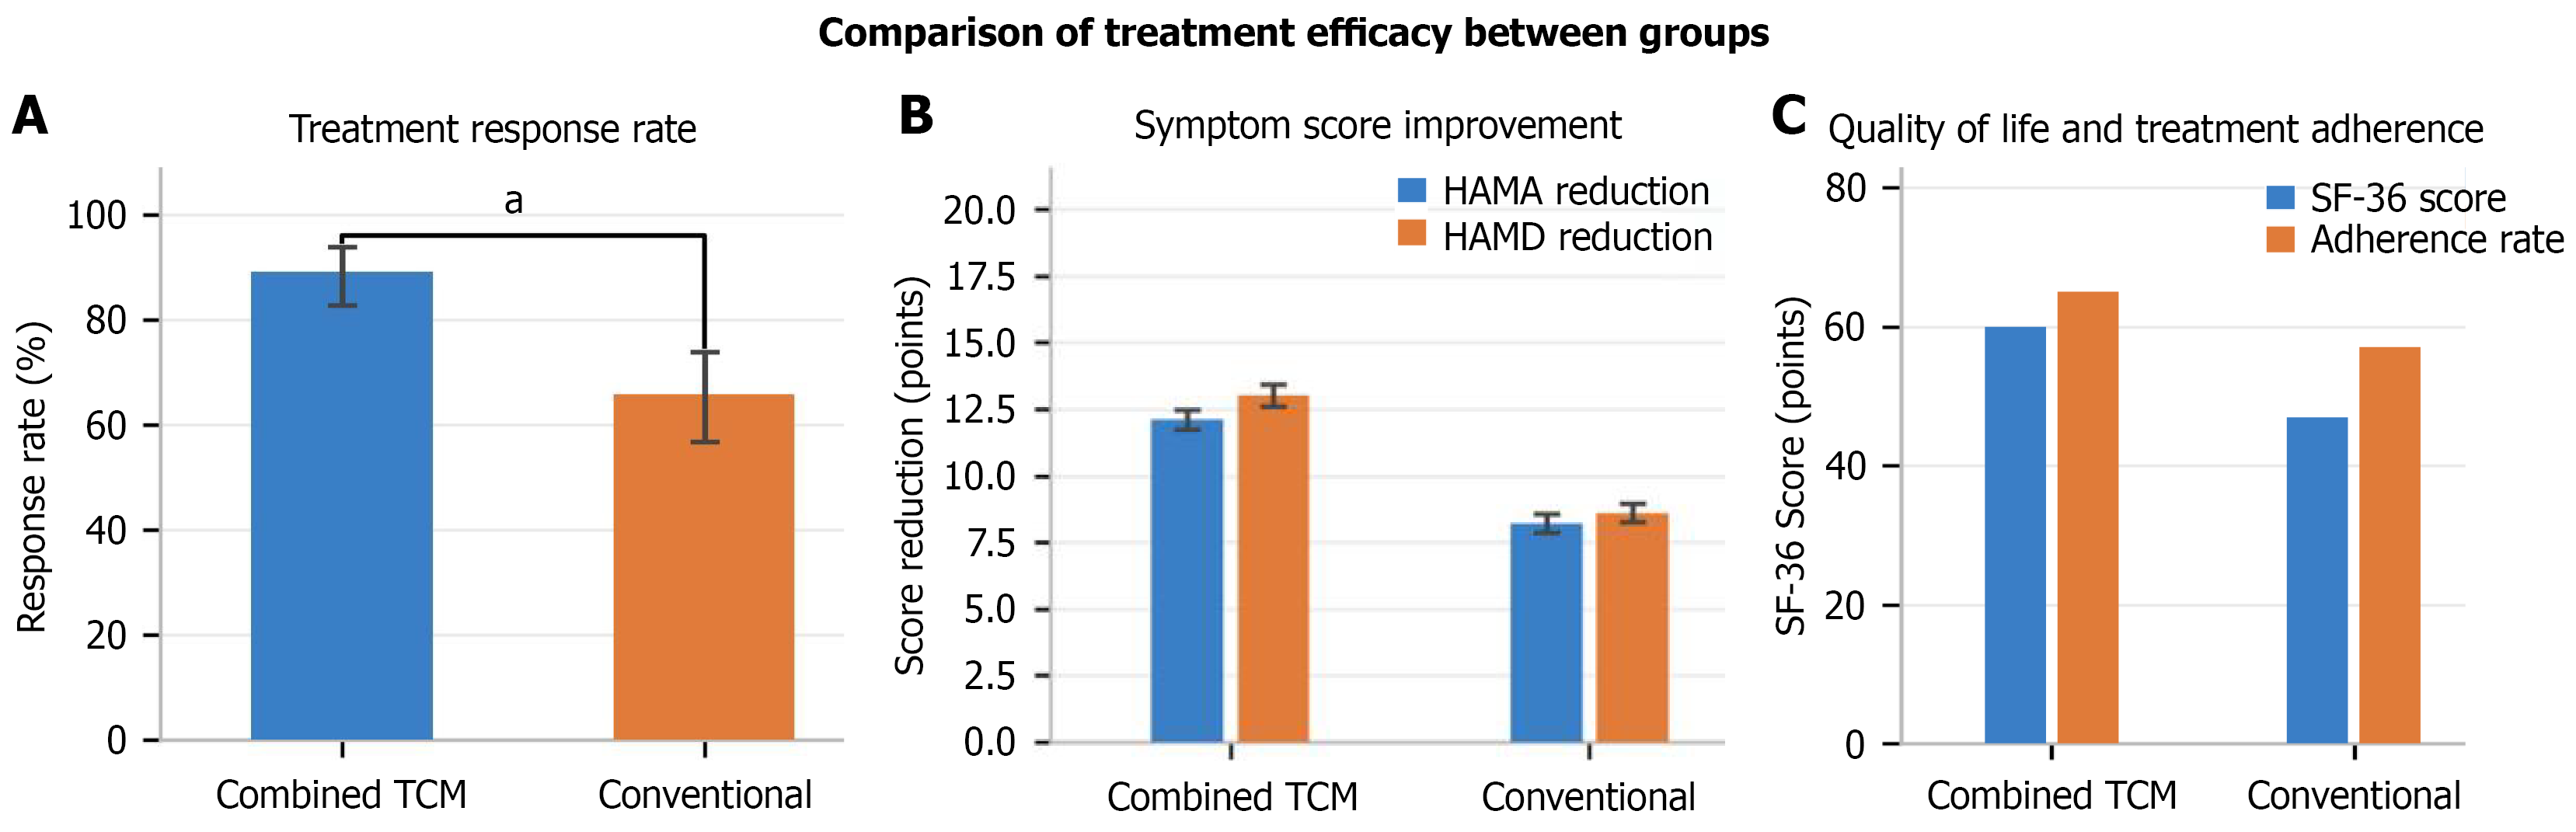
Figure 1 Comparison of treatment efficacy between combined traditional chinese medicine and conventional treatment groups.
A: Treatment response rate: The combined traditional Chinese medicine (TCM) group demonstrated significantly higher response rate (89.1%) compared to conventional group (65.6%), χ2 = 20.48, aP < 0.05; B: Symptom score improvement: Hamilton Anxiety Rating Scale and Hamilton Depression Rating Scale scores showed greater reduction in combined TCM group (12.1 ± 4.2 points and 13.0 ± 4.5 points) vs conventional group (8.2 ± 3.8 points and 8.6 ± 4.0 points), P < 0.01. Error bars represent SD; C: Quality of life and treatment adherence: Combined TCM group exhibited superior SF-36 scores (85.2 ± 12.4 vs 76.8 ± 14.6, P < 0.001) and higher adherence rates (92.2% vs 81.3%, P = 0.012). Data presented as mean ± SD. Combined traditional Chinese medicine group n = 128, Conventional group n = 128. P < 0.001, P < 0.01. HAMA: Hamilton Anxiety Rating Scale; HAMD: Hamilton Depression Rating Scale; TCM: Traditional Chinese medicine.
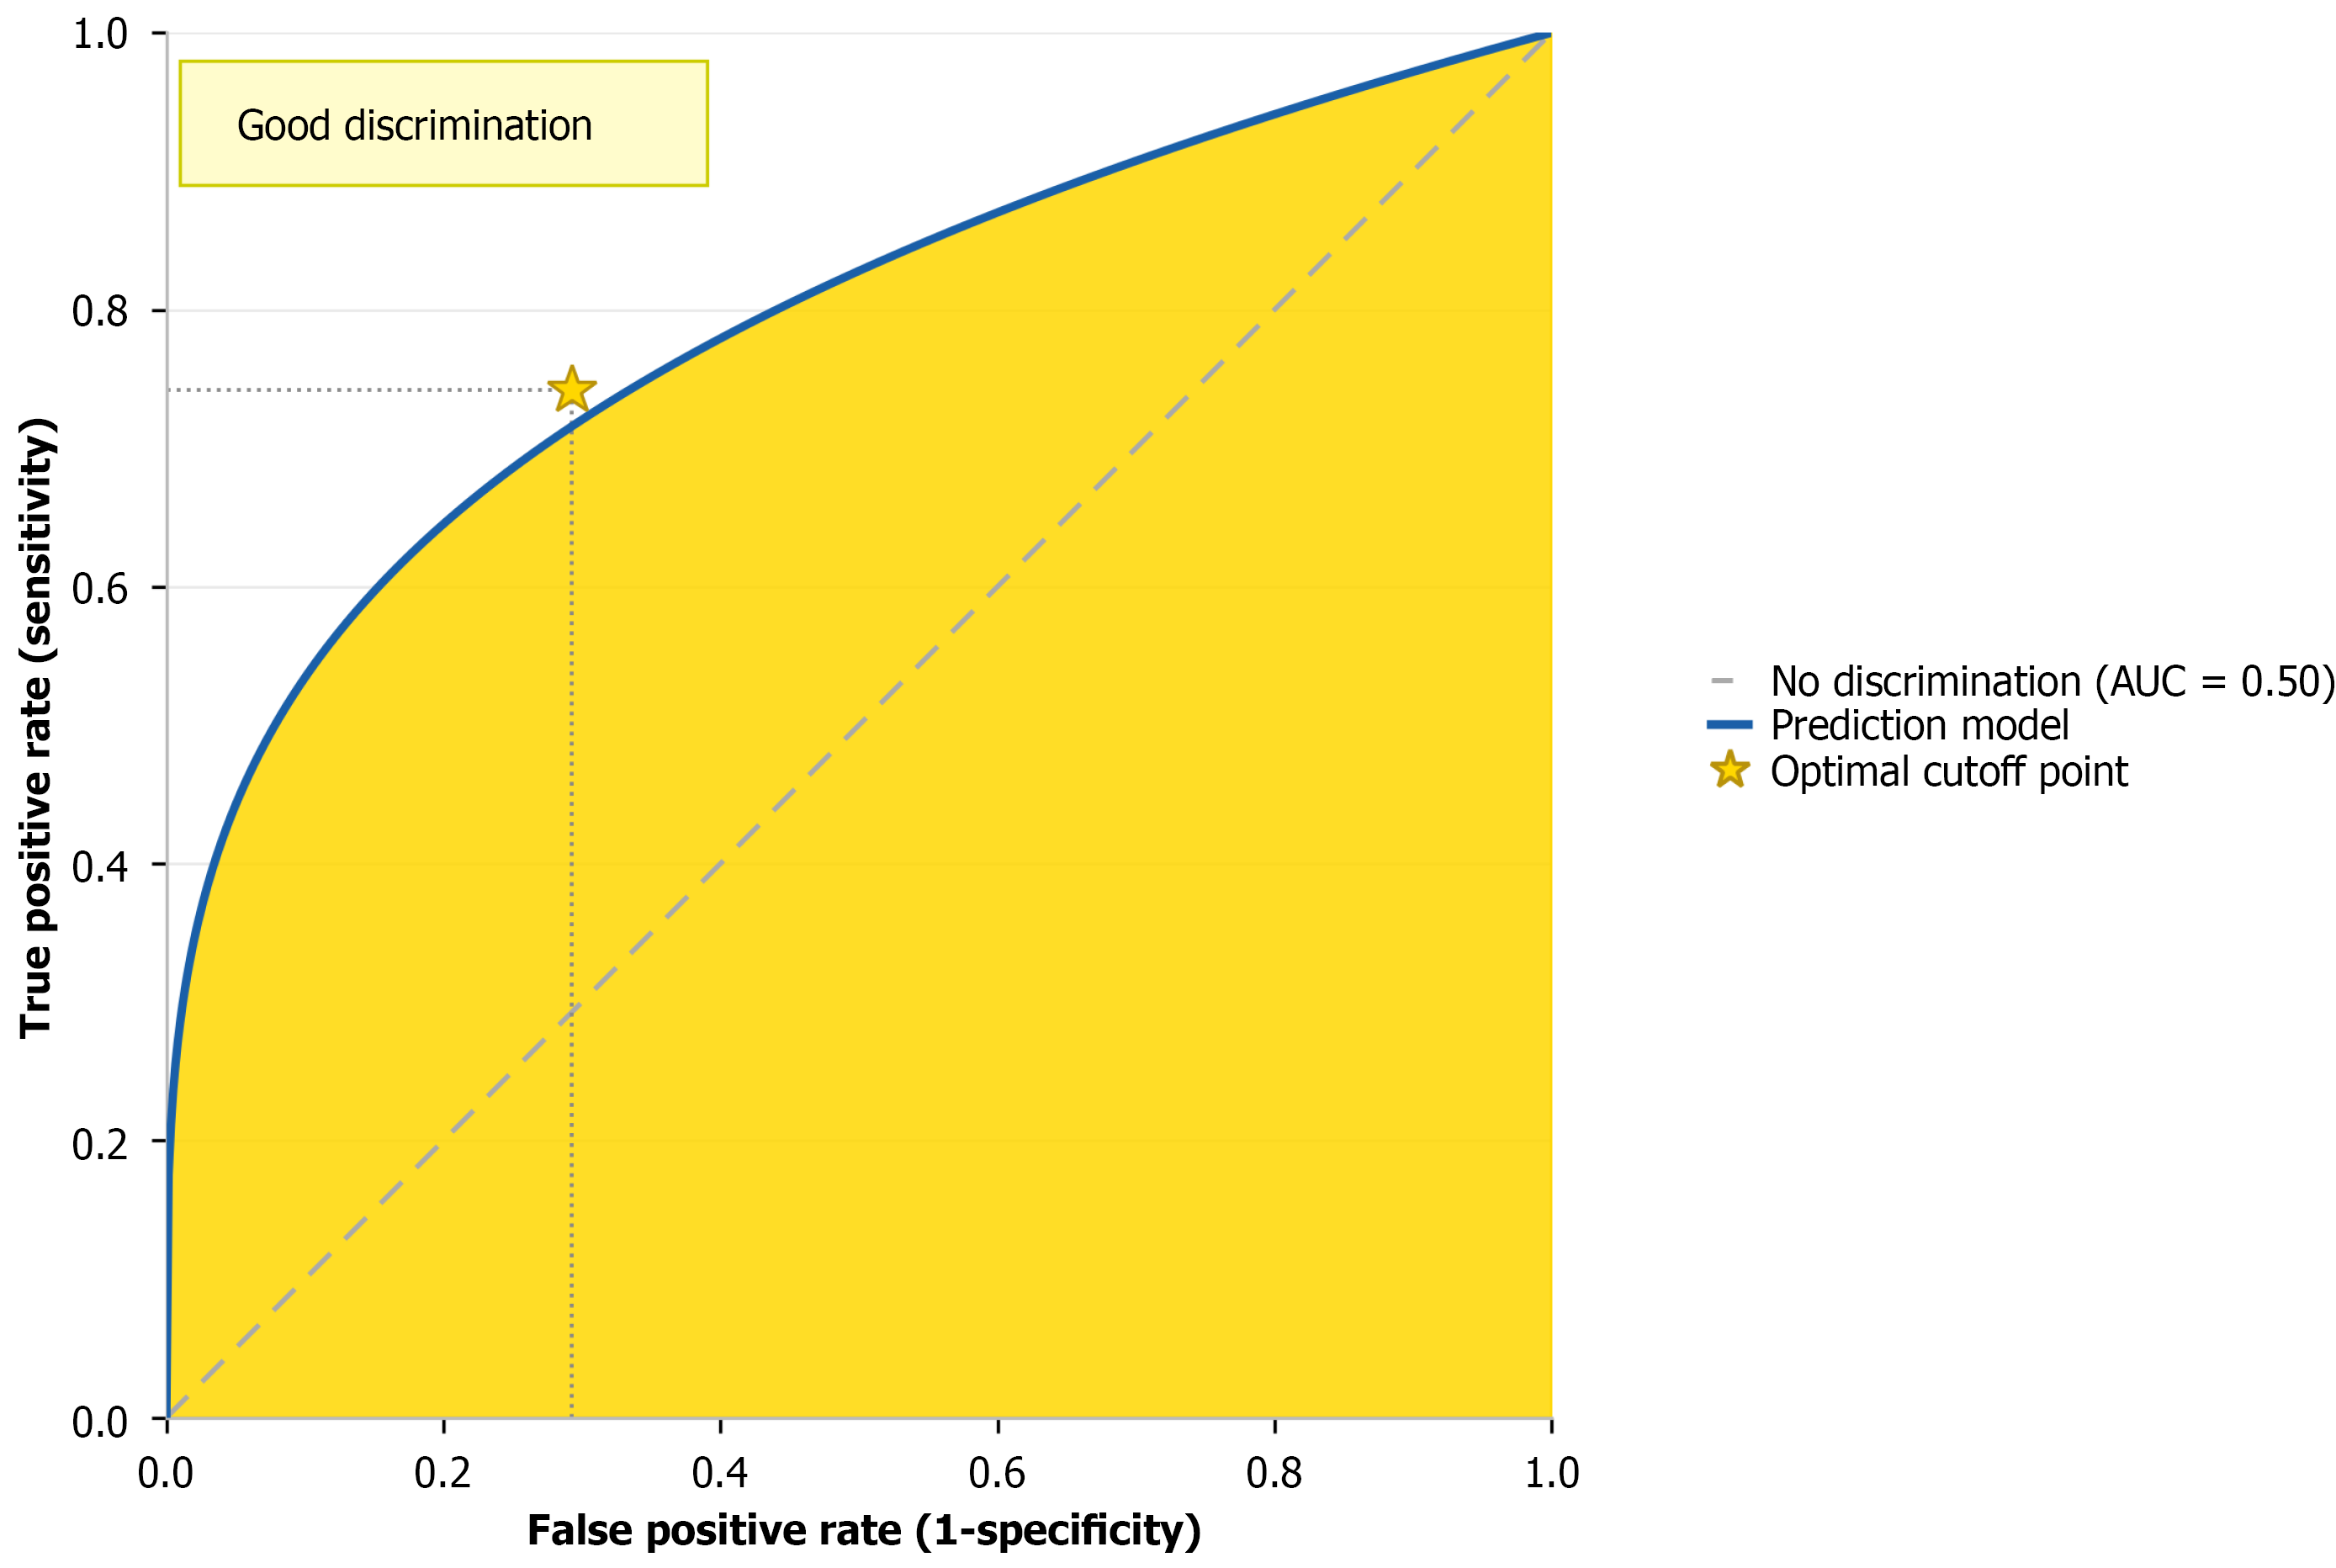
Figure 2 Receiver operating characteristic curve analysis of the treatment response prediction model.
The receiver operating characteristic curve demonstrates the discriminative ability of the multivariate logistic regression model for predicting treatment response. Area under the curve was 0.786 (95%CI: 0.728-0.844), indicating good predictive performance. The yellow star marks the optimal cutoff with maximum Youden index (0.449), corresponding to sensitivity of 74.2% and specificity of 70.7%. Diagonal dashed line represents random classifier (area under the curve = 0.50). Background shading indicates performance interpretation zones. AUC: Area under the curve.
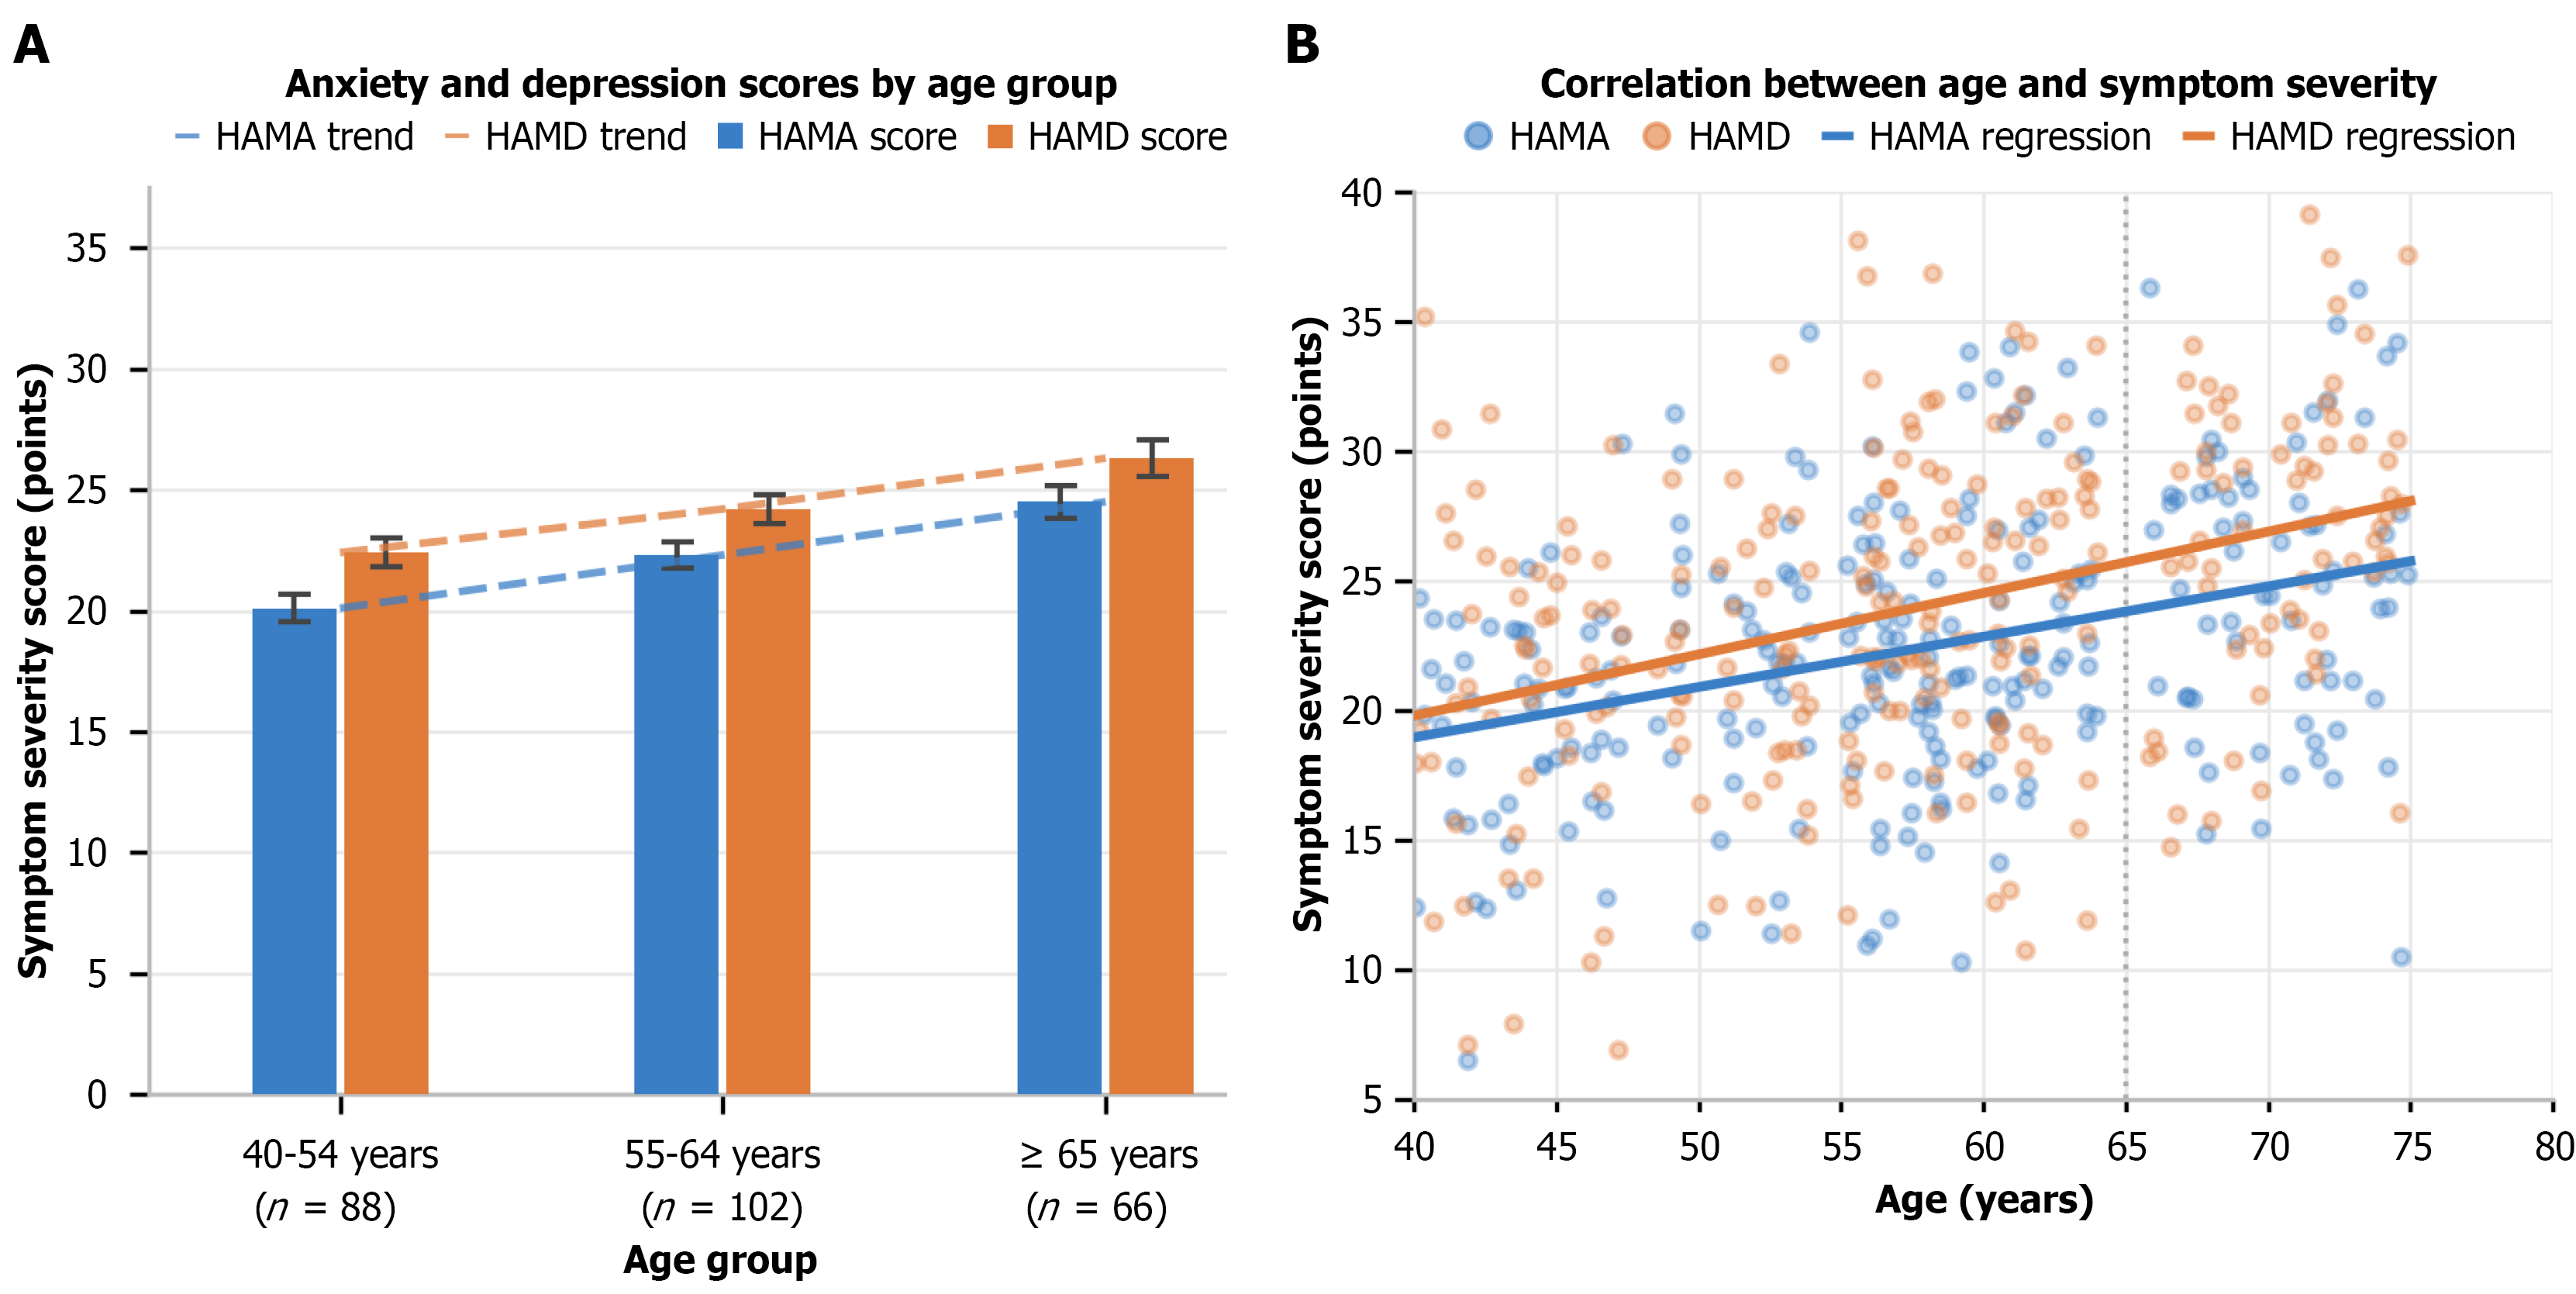
Figure 3 Age-related patterns of anxiety and depression severity.
A: Both Hamilton Anxiety Rating Scale and Hamilton Depression Rating Scale scores increased progressively across age groups (younger: 20.1 ± 5.2 points and 22.4 ± 5.7 points; middle-aged: 22.3 ± 5.4 points and 24.2 ± 5.9 points; older: 24.5 ± 5.6 points and 26.3 ± 6.2 points, P for trend ≤ 0.001). Dashed lines indicate trends. Error bars represent SD; B: Scatter plots demonstrate moderate positive correlations between age and symptom severity (Hamilton Anxiety Rating Scale: r = 0.312; Hamilton Depression Rating Scale: r = 0.328, both P < 0.001). Regression lines show age-dependent escalation. Data presented as mean ± SD or individual values. P < 0.001. HAMA: Hamilton Anxiety Rating Scale; HAMD: Hamilton Depression Rating Scale.
- Citation: Gu JX, Zhang MJ, Li FR, Wang X, Li SS. Anatomical specificity of post-stroke depression: Subcortical lesions, age-related patterns, and predictors of treatment response. World J Psychiatry 2026; 16(9): 118381
- URL: https://www.wjgnet.com/2220-3206/full/v16/i9/118381.htm
- DOI: https://dx.doi.org/10.5498/wjp.118381