















Copyright: ©Author(s) 2026.
World J Psychiatry. Sep 19, 2026; 16(9): 118371
Published online Sep 19, 2026. doi: 10.5498/wjp.118371
Published online Sep 19, 2026. doi: 10.5498/wjp.118371
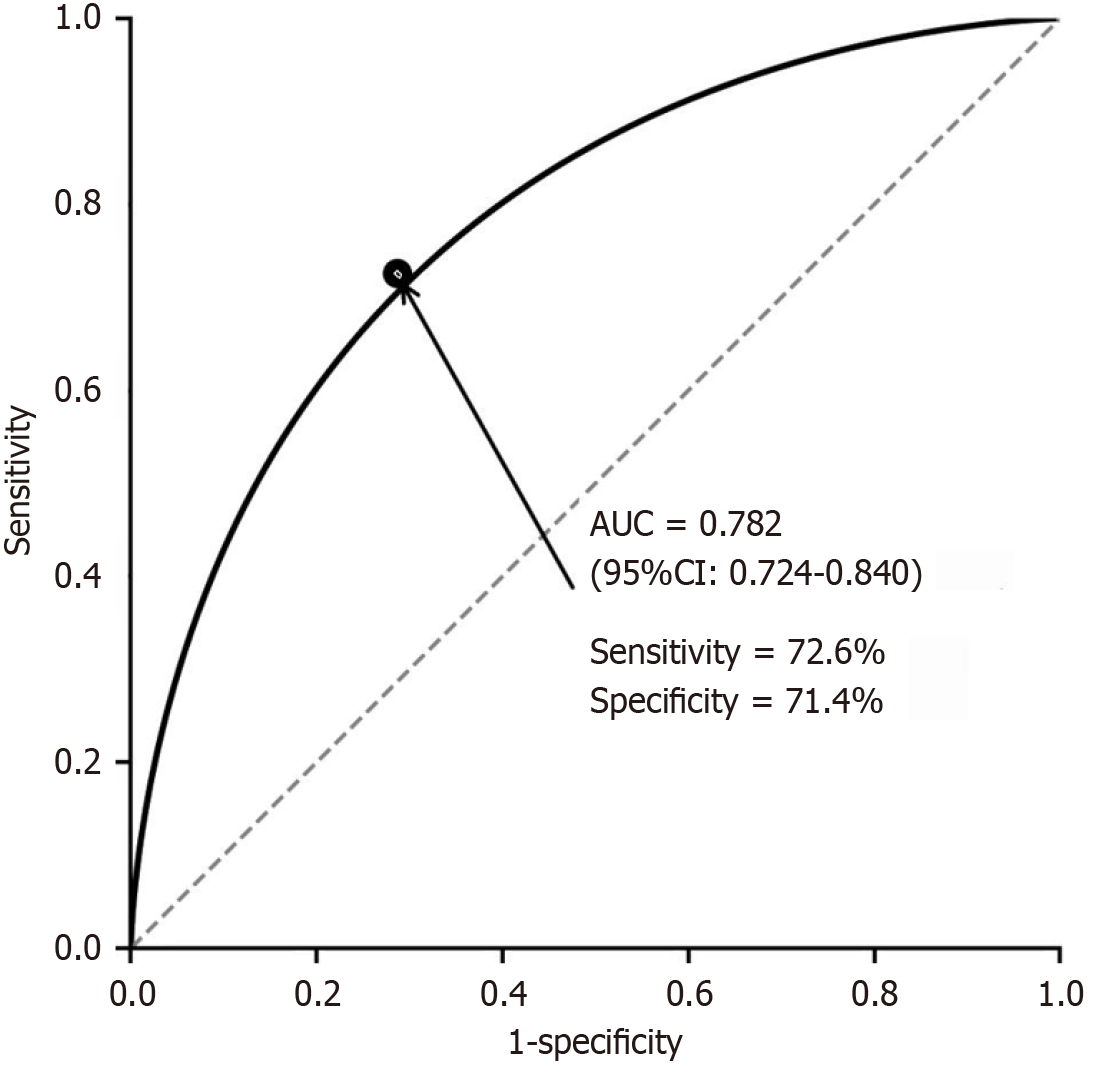
Figure 1 Receiver operating characteristic curve analysis of the prediction model for treatment response.
The area under the curve (AUC) was 0.782 (95% confidence interval: 0.724-0.840). At the optimal cutoff point (marked by the solid circle), the sensitivity was 72.6%, specificity was 71.4%, and Youden index was 0.440. The dashed diagonal line represents the reference line (AUC = 0.5). AUC: Area under the curve; CI: Confidence interval.
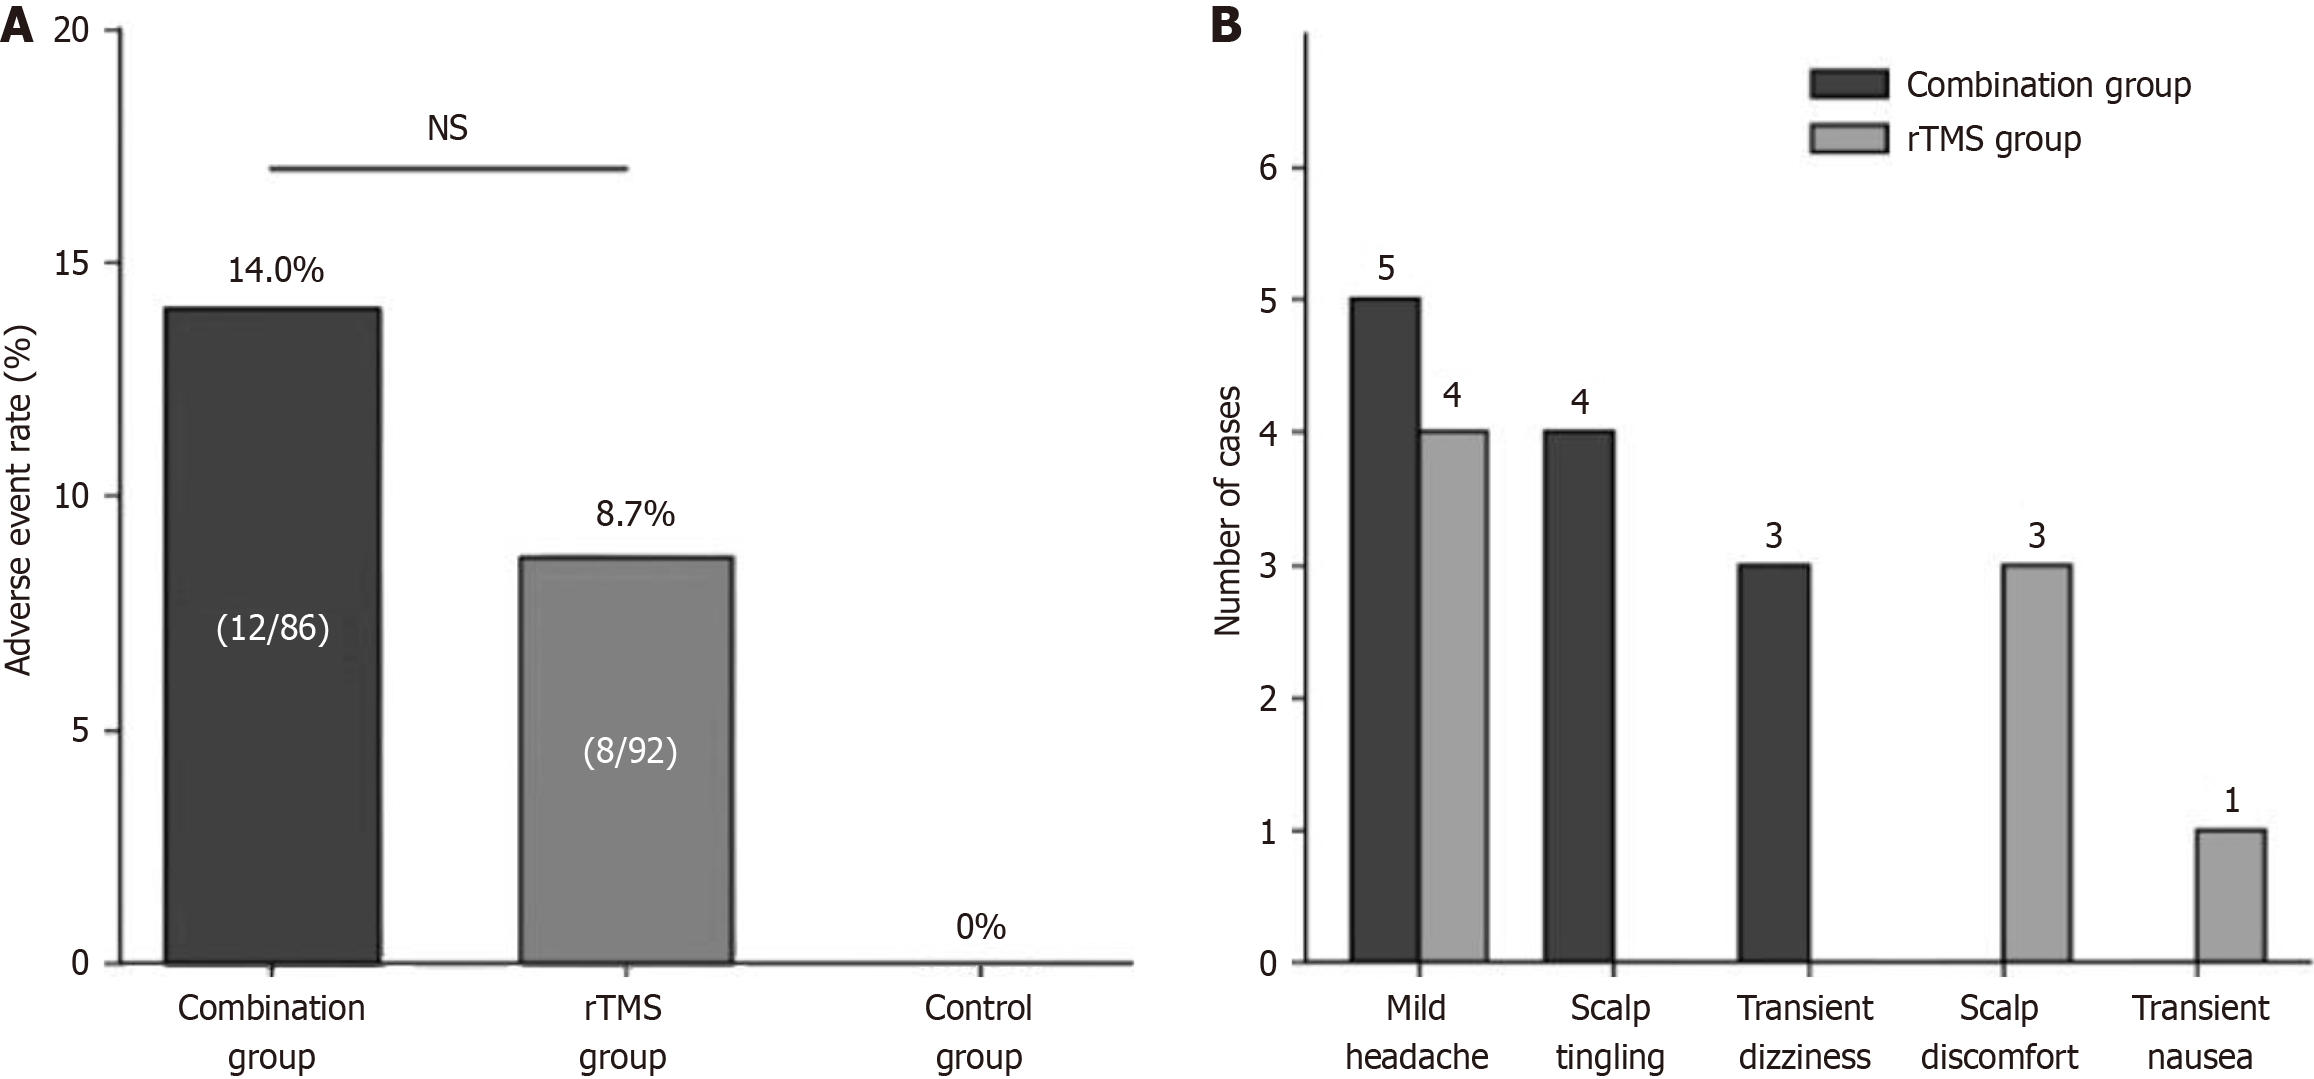
Figure 2 Adverse events in the three treatment groups.
A: Overall adverse event rates among the combination group (14.0%, 12/86), repetitive transcranial magnetic stimulation (rTMS) group (8.7%, 8/92), and control group (0%, 0/78). There was no statistically significant difference between the combination group and rTMS group (χ2 = 1.326, P = 0.250); B: Distribution of specific adverse event types. In the combination group: Mild headache (n = 5), scalp tingling (n = 4), and transient dizziness (n = 3). In the rTMS group: Mild headache (n = 4), scalp discomfort (n = 3), and transient nausea (n = 1). All adverse events were mild and self-limiting. rTMS: Repetitive transcranial magnetic stimulation.
- Citation: Liu HZ, Liu WG, Fu HQ, Lv H, Liu C, Li CX. Combined transcranial direct current and repetitive transcranial magnetic stimulation for adolescent non-suicidal self-injury. World J Psychiatry 2026; 16(9): 118371
- URL: https://www.wjgnet.com/2220-3206/full/v16/i9/118371.htm
- DOI: https://dx.doi.org/10.5498/wjp.118371