















Copyright: ©Author(s) 2026.
World J Psychiatry. Sep 19, 2026; 16(9): 116579
Published online Sep 19, 2026. doi: 10.5498/wjp.116579
Published online Sep 19, 2026. doi: 10.5498/wjp.116579
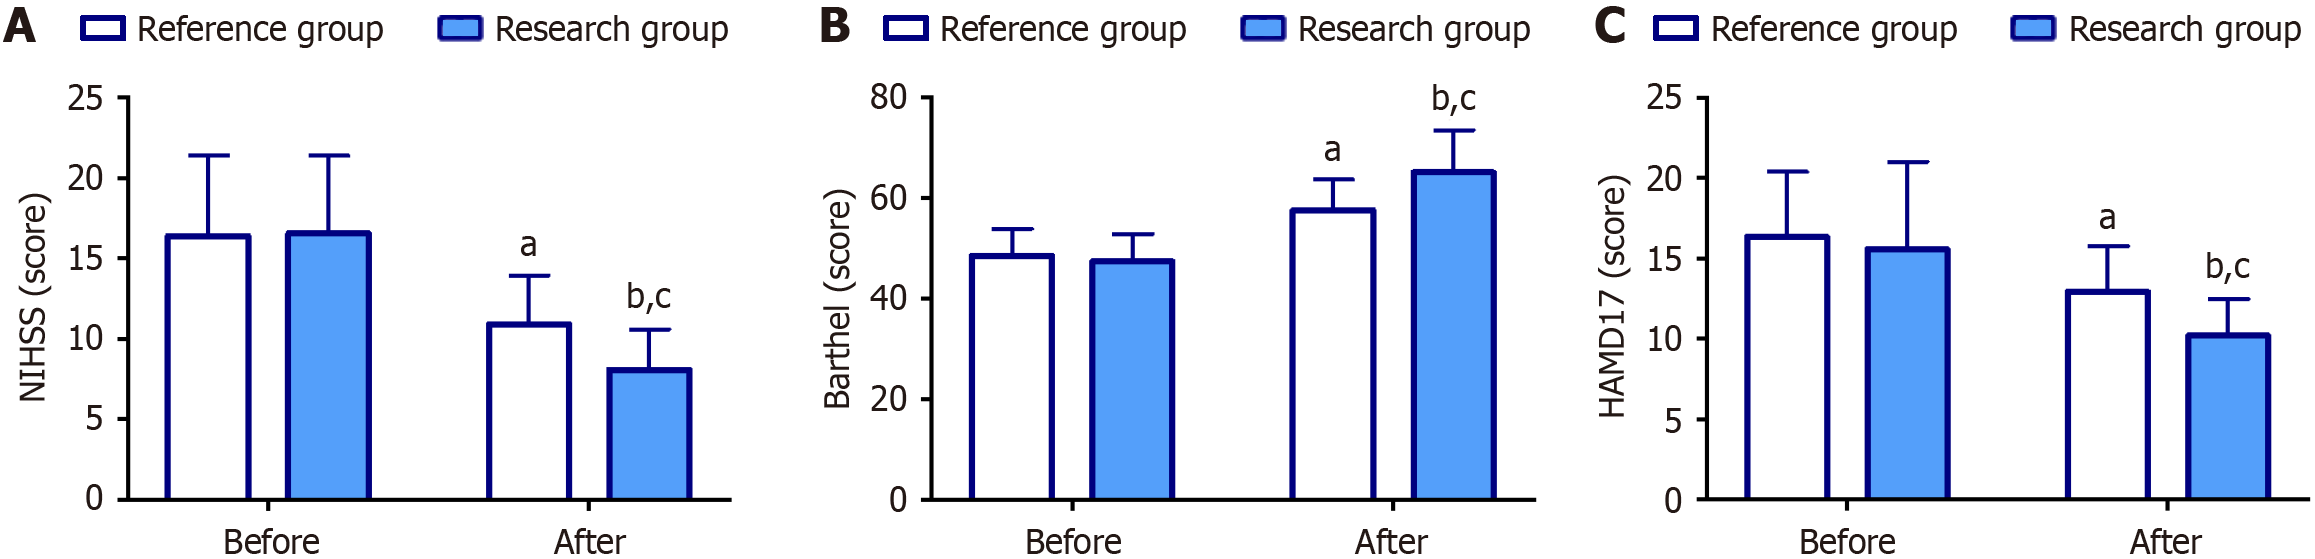
Figure 1 Analysis of National Institutes of Health Stroke Scale, Barthel Index, and 17-item Hamilton Depression Rating Scale scores.
A: Pre- and post-treatment National Institutes of Health Stroke Scale scores across groups; B: Barthel Index scores pre- and post-treatment; C: Pre- and post-treatment 17-item Hamilton Depression Rating Scale in two groups. aP < 0.05, bP < 0.01 within-group comparison vs pre-treatment, cP < 0.05 vs the reference group. NIHSS: National Institutes of Health Stroke Scale; HAMD17: 17-item Hamilton Depression Rating Scale.
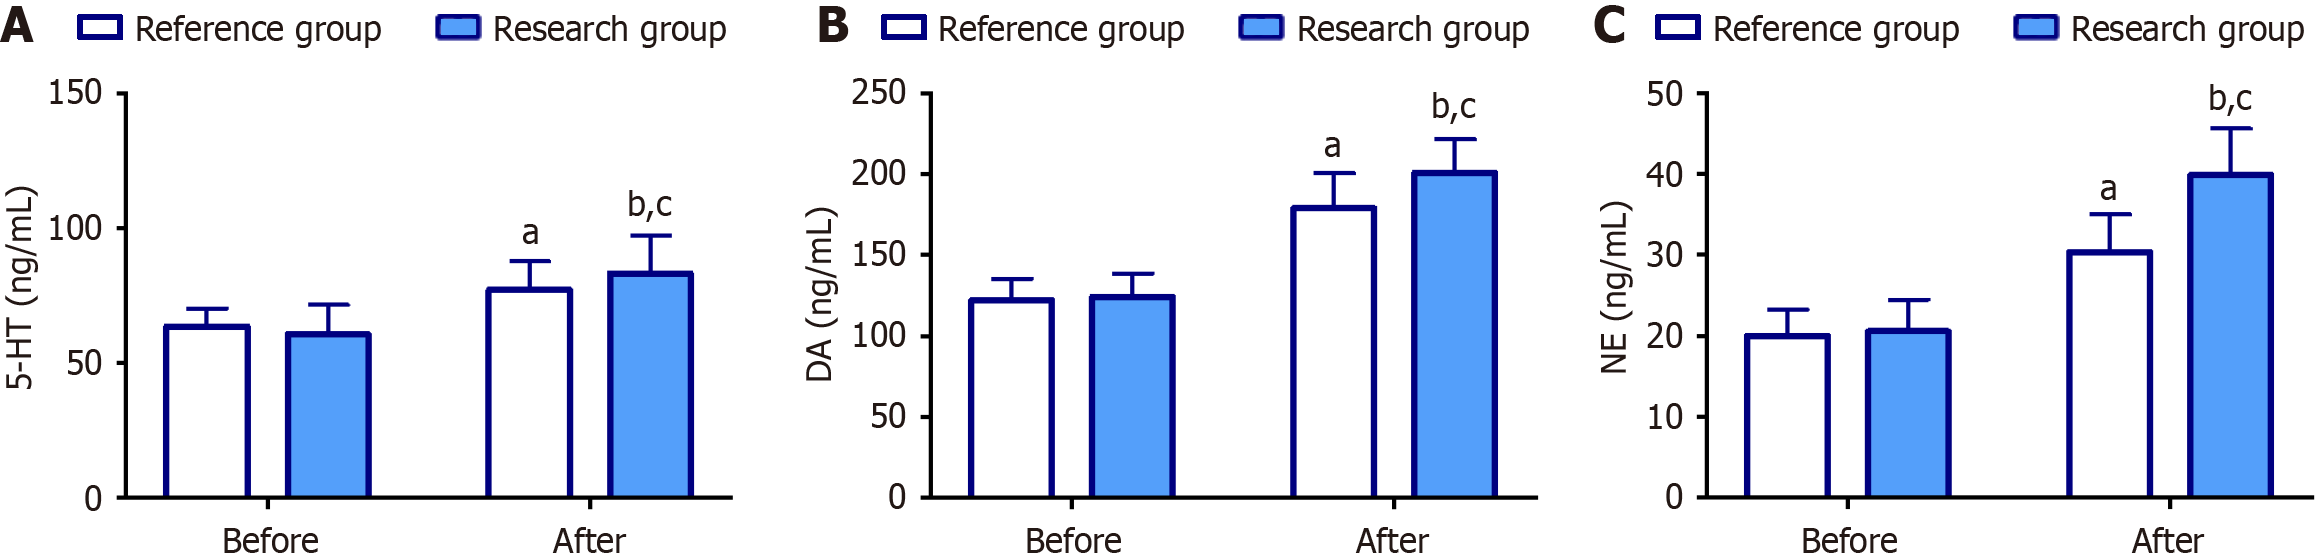
Figure 2 Comparative analysis of serum neurotransmitters.
A: 5-hydroxytryptamine alterations (pre- vs post-treatment) in two groups; B: Dopamine changes pre- and post-treatment; C: Pre- and post-treatment norepinephrine levels. aP < 0.05 and bP < 0.01 vs pre-treatment value, cP < 0.05 vs the reference group. 5-HT: 5-hydroxytryptamine; DA: Dopamine; NE: Norepinephrine.
- Citation: Zhu ZH, Lin YS, Hong ZQ. Efficacy and influencing factors of 3-N-Butylphthalide-trazodone combination in managing post-ischemic stroke depression. World J Psychiatry 2026; 16(9): 116579
- URL: https://www.wjgnet.com/2220-3206/full/v16/i9/116579.htm
- DOI: https://dx.doi.org/10.5498/wjp.116579