
















Copyright: ©Author(s) 2026.
World J Psychiatry. Aug 19, 2026; 16(8): 120278
Published online Aug 19, 2026. doi: 10.5498/wjp.120278
Published online Aug 19, 2026. doi: 10.5498/wjp.120278
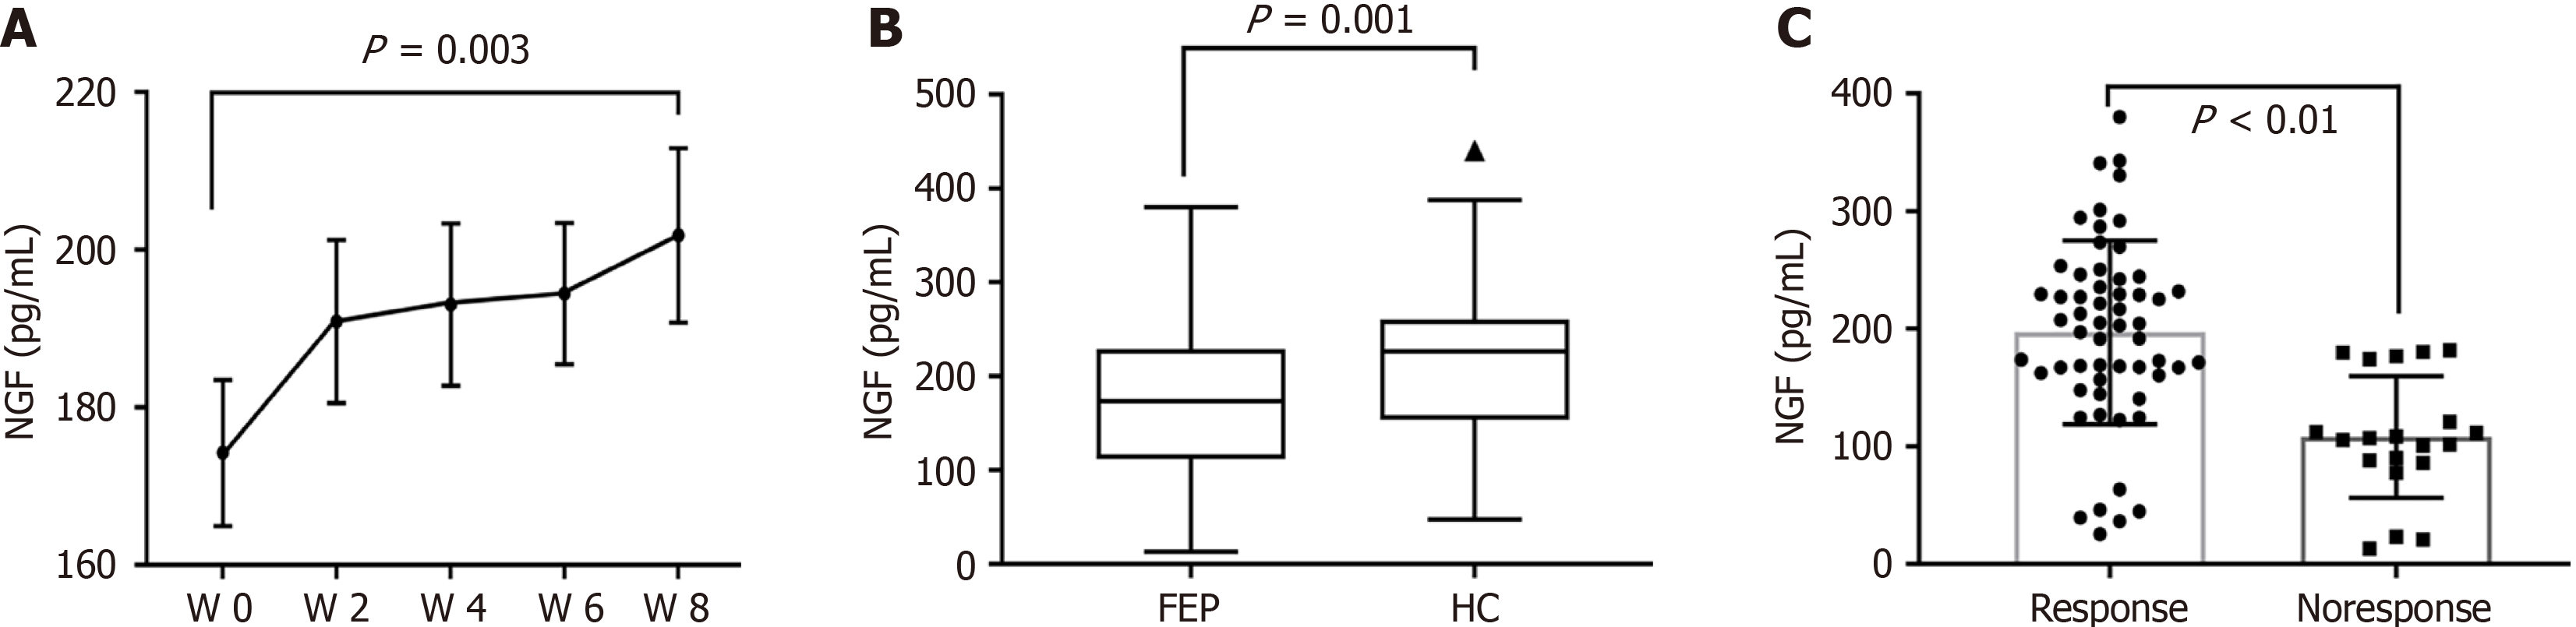
Figure 1 Dynamic changes, intergroup differences, and stratified analysis of treatment response of serum nerve growth factor levels in first-episode psychosis patients.
A: Nerve growth factor (NGF) over the five assessment time points (W0: Before antipsychotic treatment; W2: After 2 weeks; W4: After 4 weeks; W6: After 6 weeks; W8: After 8 weeks); B: Comparison of serum NGF levels between the first-episode psychosis and healthy control groups; C: Changes in baseline NGF levels after 8 weeks of medication treatment in the response group (n = 50) and the non-response group (n = 28). NGF: Nerve growth factor; FEP: First-episode psychosis patients who had never received medication; HC: Healthy controls.
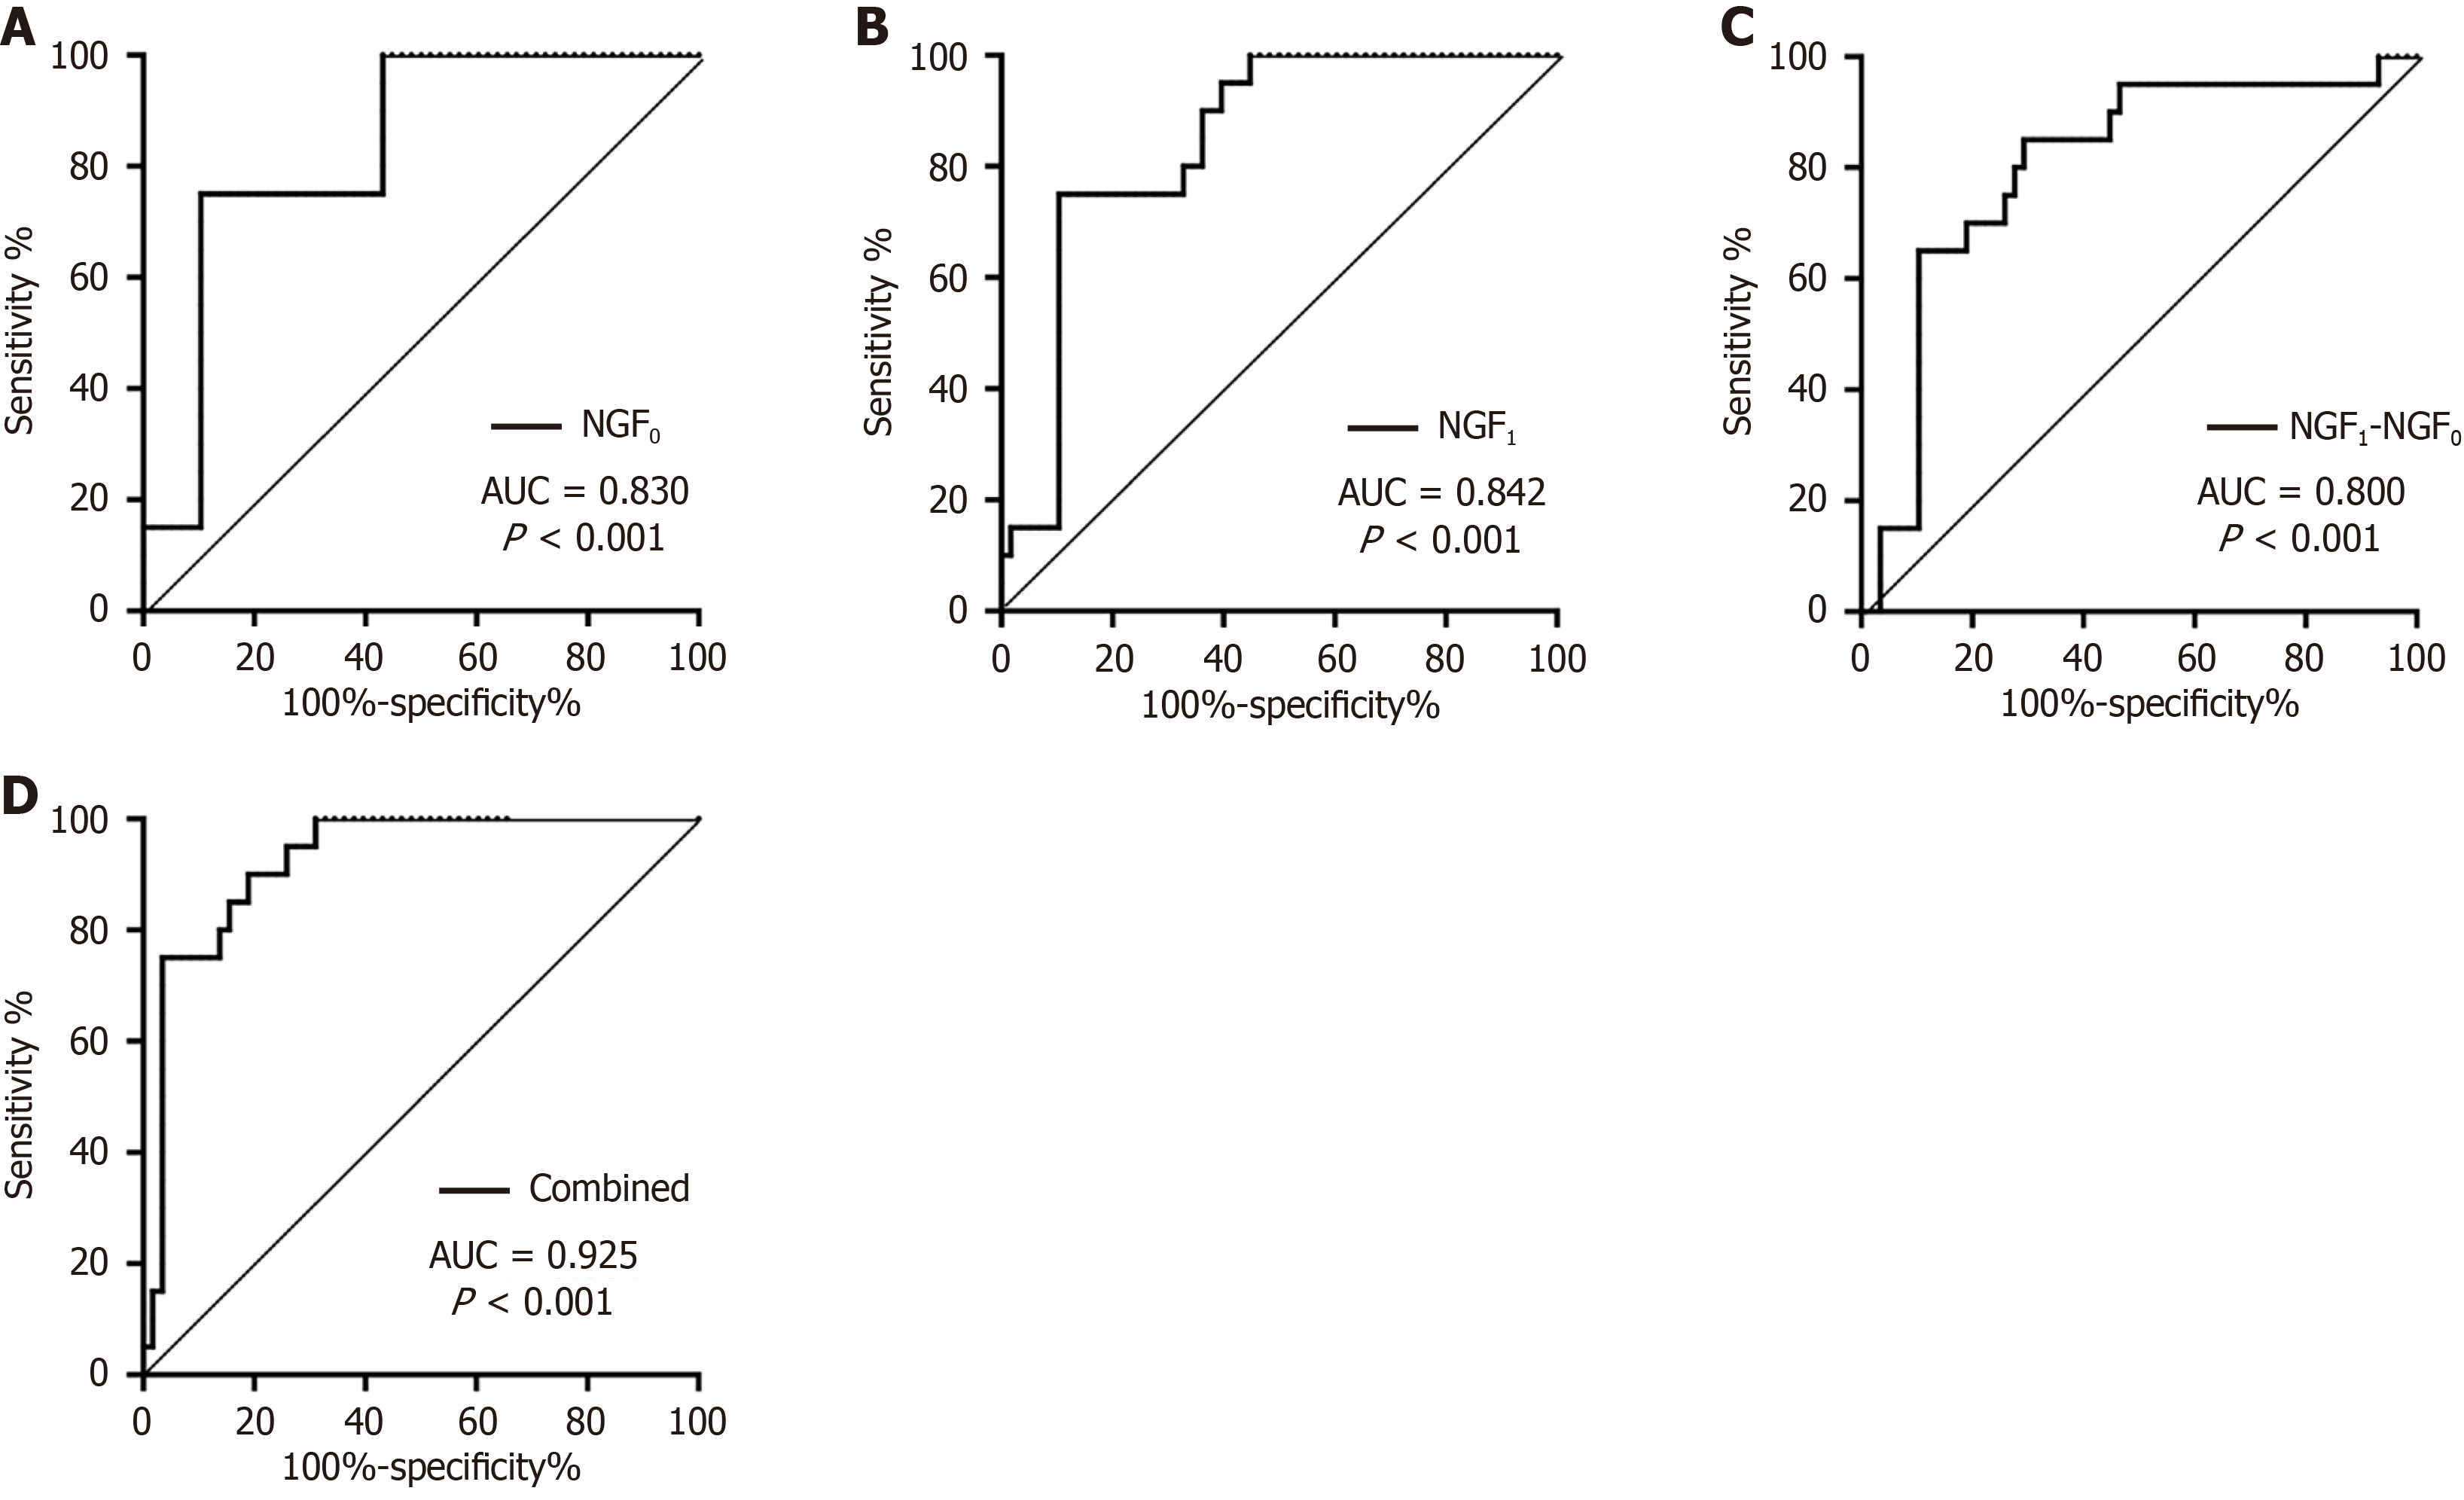
Figure 2 Receiver operating characteristic curves of serum nerve growth factor-related indicators and their combinations for predicting response to antipsychotic drug treatment.
A: Receiver operating characteristic (ROC) curve of sensitivity vs specificity of baseline nerve growth factor (NGF); B: ROC curve of sensitivity vs specificity of NGF at 2 weeks after onset of antipsychotic treatment; C: ROC curve of sensitivity vs specificity of early NGF changes; D: ROC curve of sensitivity vs specificity of combinations of baseline NGF, NGF at 2 weeks after onset of antipsychotic treatment, early NGF changes, and early psychopathological improvement in response to antipsychotic drug treatment. Early nerve growth factor changes: Nerve growth factor at 2 weeks after onset of antipsychotics treatment - baseline nerve growth factor. AUC: Areas under the curve; NGF0: Baseline nerve growth factor; NGF1: Nerve growth factor at 2 weeks after onset of antipsychotics treatment.
- Citation: Xiao WH, Wang ML, Chen KY, Yu DD, Zhao YQ, Sun JR. Assessment of nerve growth factor levels and clinical indicators for outcome prediction in first-episode schizophrenia. World J Psychiatry 2026; 16(8): 120278
- URL: https://www.wjgnet.com/2220-3206/full/v16/i8/120278.htm
- DOI: https://dx.doi.org/10.5498/wjp.120278