
















Copyright: ©Author(s) 2026.
World J Psychiatry. Aug 19, 2026; 16(8): 118857
Published online Aug 19, 2026. doi: 10.5498/wjp.118857
Published online Aug 19, 2026. doi: 10.5498/wjp.118857
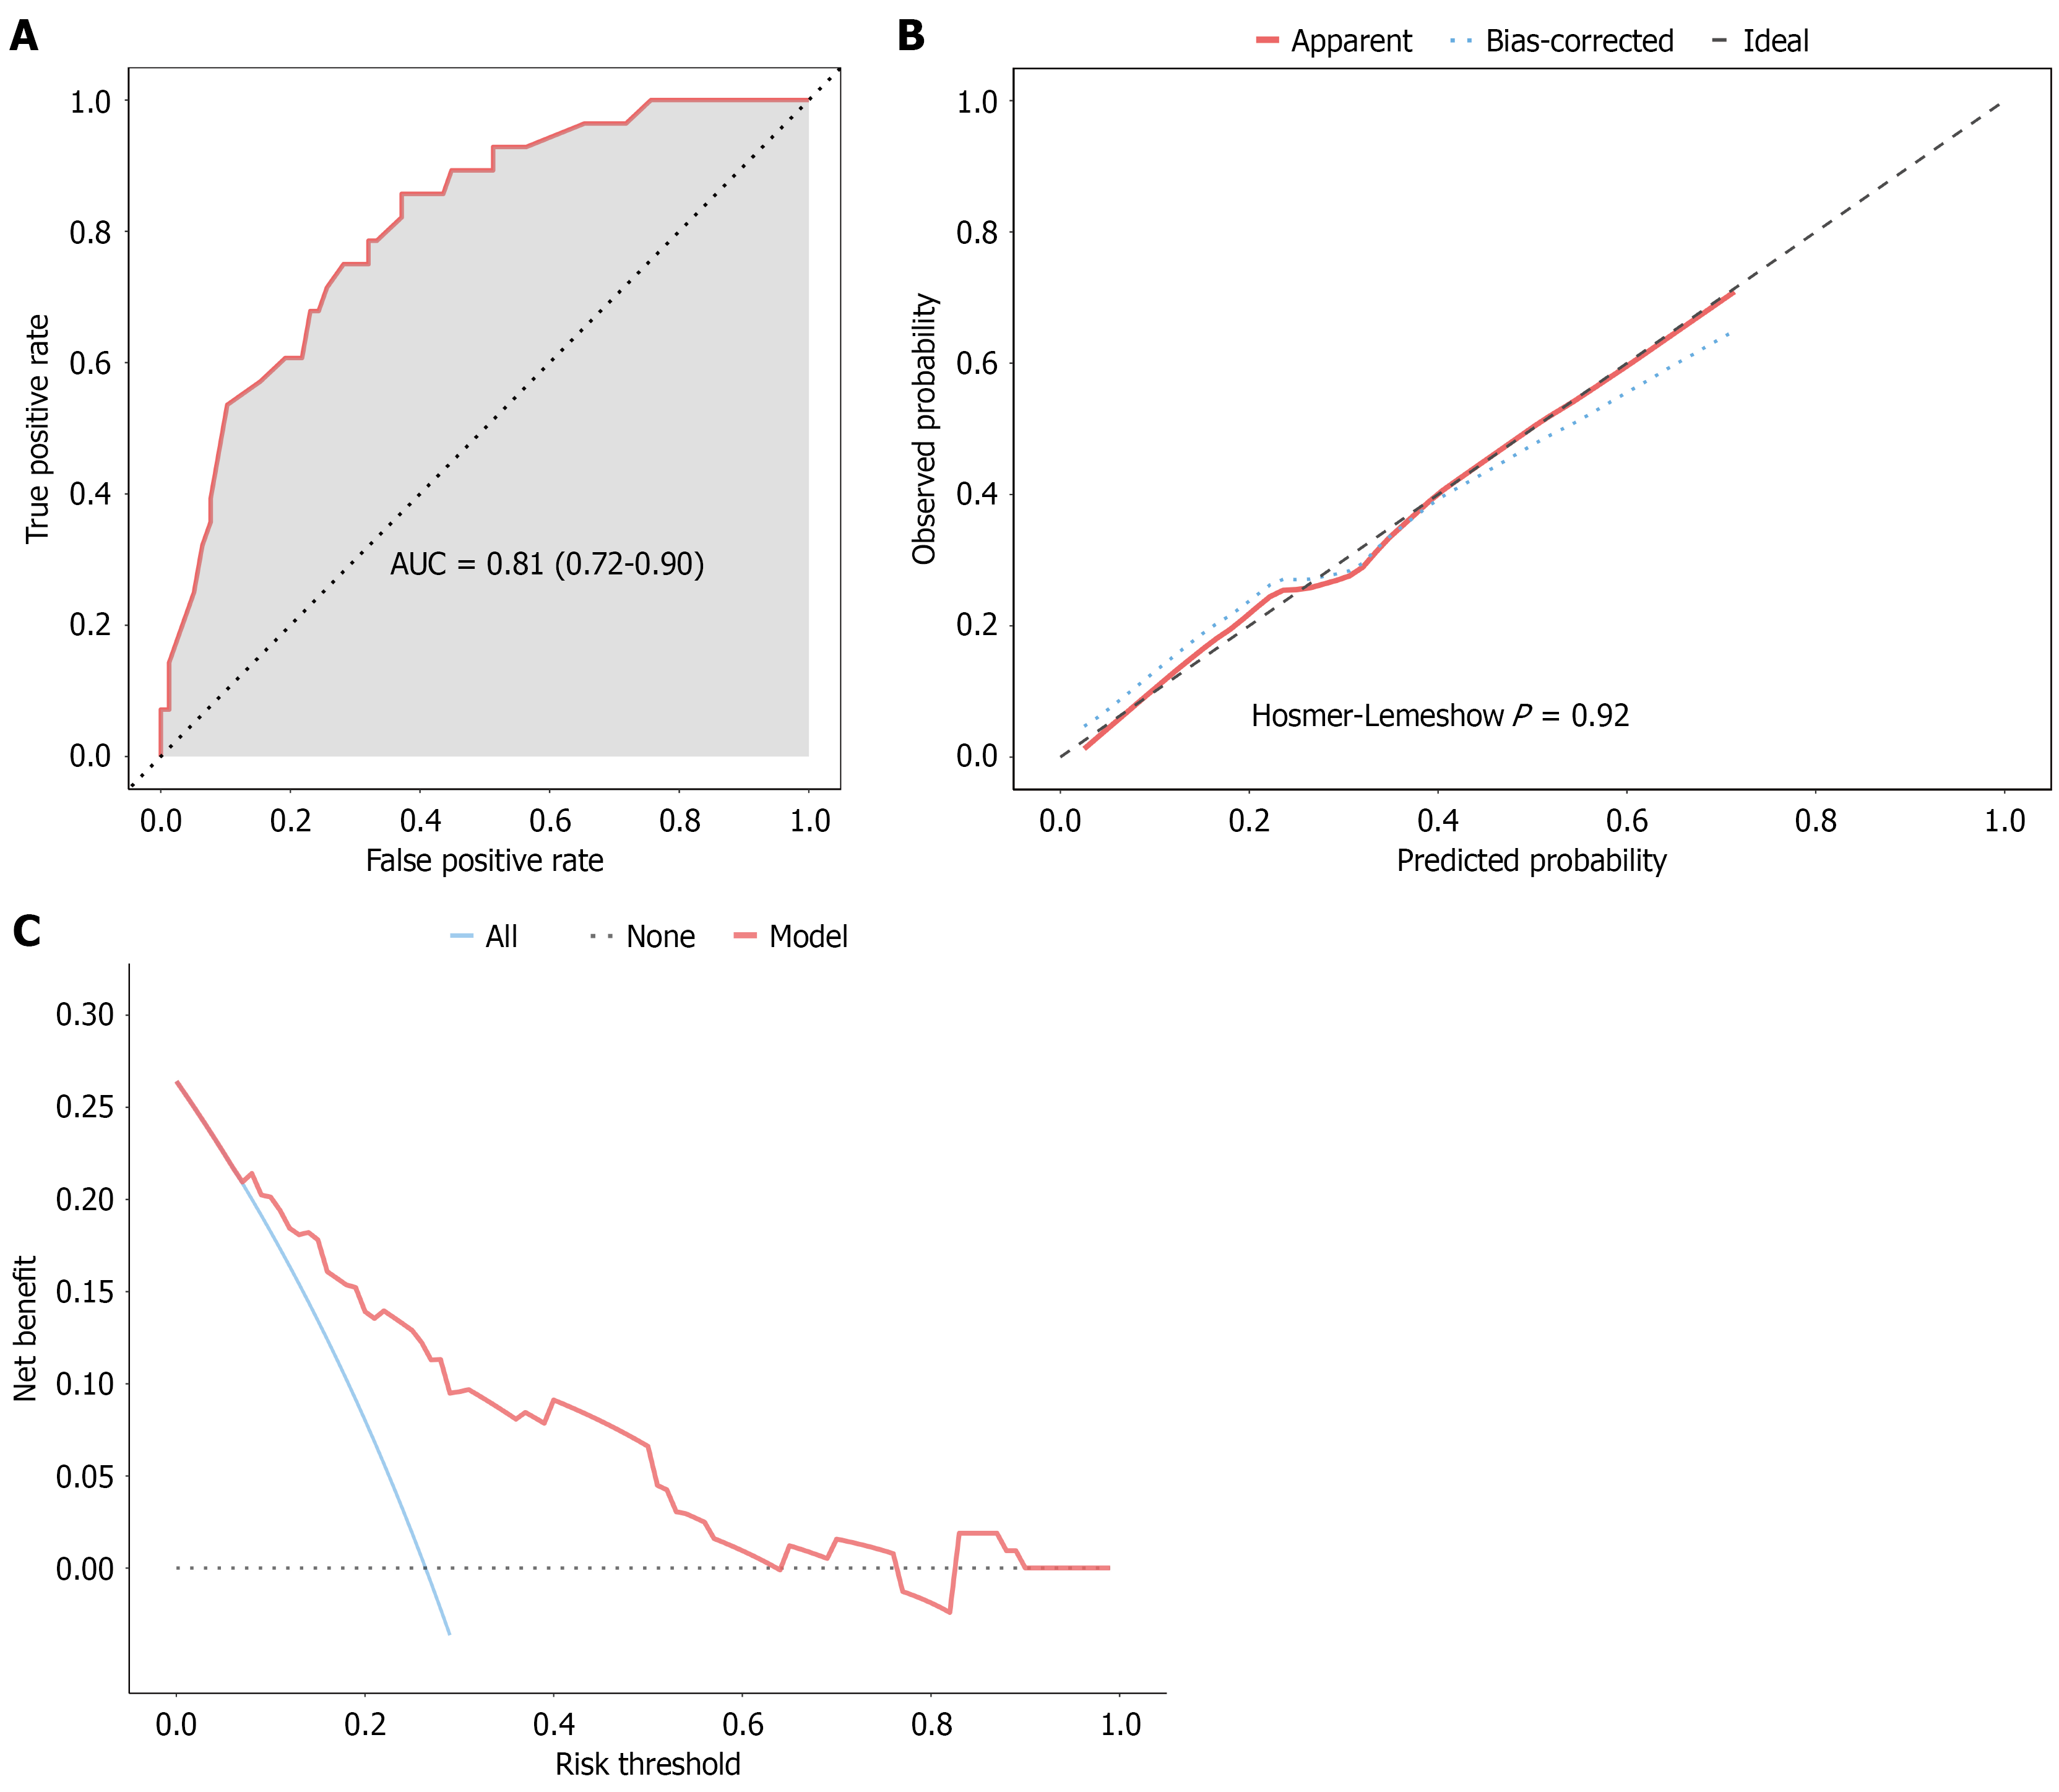
Figure 1 Predictive performance of the comorbidity risk model.
A: The multivariate logistic regression model for predicting comorbid anxiety and depression demonstrated excellent discriminative ability, with an area under the receiver operating characteristic curve of 0.81 (95%CI: 0.72-0.90); B: The calibration curve showed good agreement between predicted and observed probabilities (Hosmer-Lemeshow test P = 0.92); C: Decision curve analysis indicated that the model provided a net clinical benefit across a threshold probability range of 10%-60%. AUC: Area under the receiver operating characteristic curve.
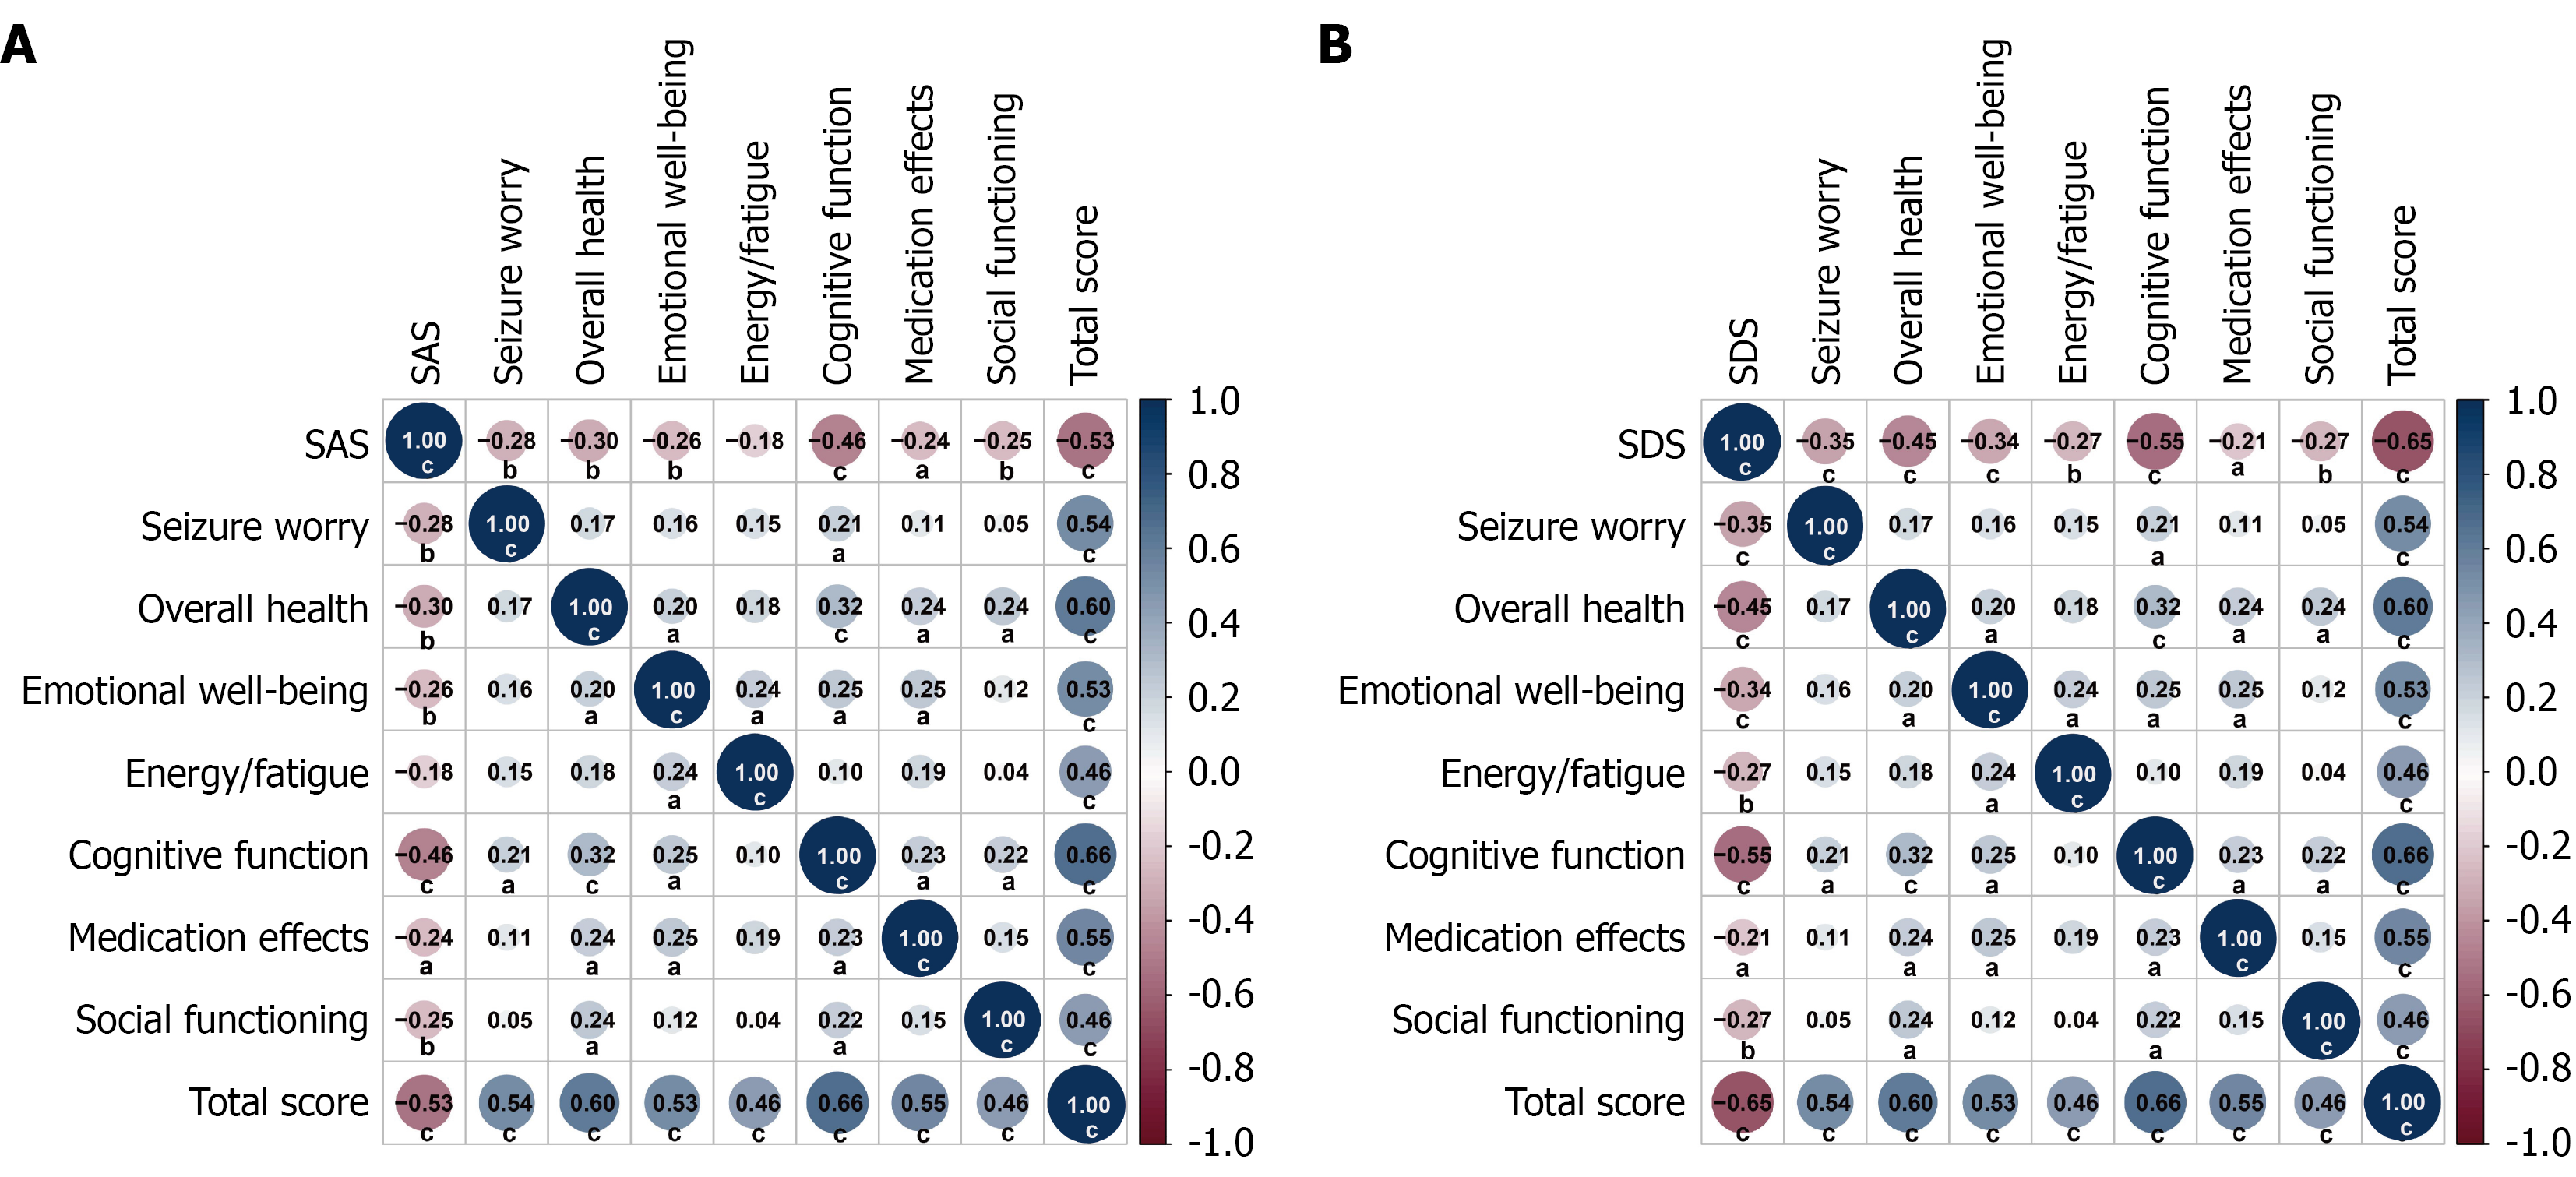
Figure 2 Correlations between anxiety/depression severity and quality of life.
Both Self-Rating Anxiety Scale and Self-Rating Depression Scale scores were significantly negatively correlated with all Quality of Life in Epilepsy-31 domains and total score. A: Self-Rating Anxiety Scale showed moderate to strong negative correlations, with the strongest association observed with the total score (r = -0.53, P < 0.001). B: Self-Rating Depression Scale was strongly negatively correlated with the total score (r = -0.65, P < 0.001), as well as with cognitive function (r = -0.55, P < 0.001) and overall health (r = -0.45, P < 0.001). aP < 0.05; bP < 0.01; cP < 0.001. SAS: Self-Rating Anxiety Scale; SDS: Self-Rating Depression Scale.
- Citation: Zong N, Liu XY, Chen F. Risk factors for anxiety and depression in patients with epilepsy and their relationship with quality of life. World J Psychiatry 2026; 16(8): 118857
- URL: https://www.wjgnet.com/2220-3206/full/v16/i8/118857.htm
- DOI: https://dx.doi.org/10.5498/wjp.118857