
















Copyright: ©Author(s) 2026.
World J Psychiatry. Aug 19, 2026; 16(8): 117628
Published online Aug 19, 2026. doi: 10.5498/wjp.v16.i8.117628
Published online Aug 19, 2026. doi: 10.5498/wjp.v16.i8.117628
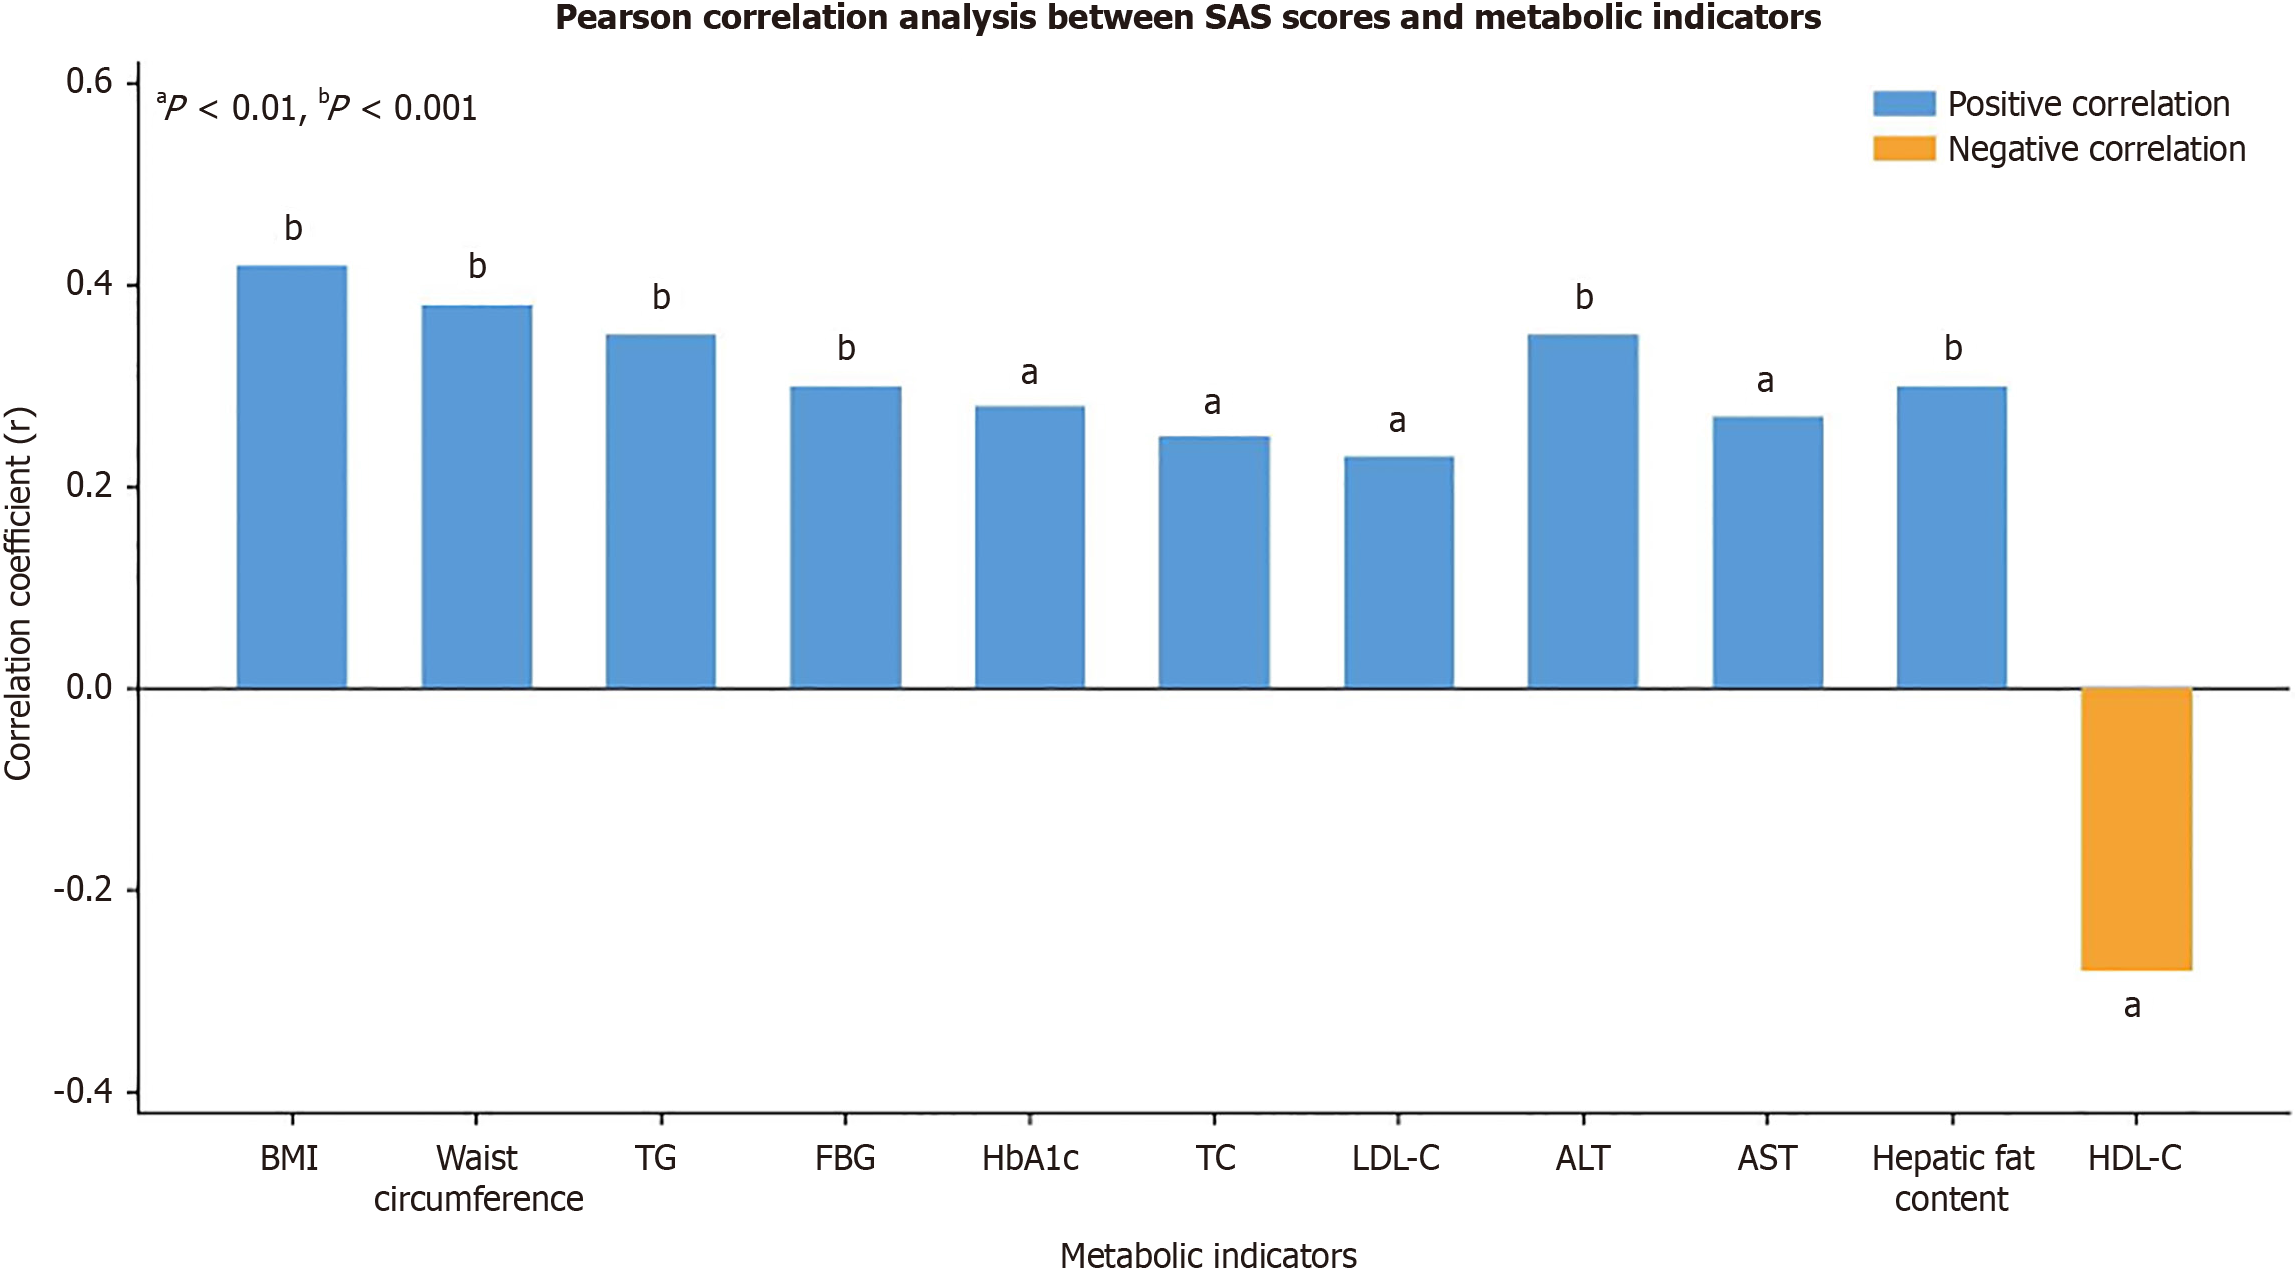
Figure 1 Comparison of metabolic indicators between metabolic dysfunction-associated steatotic liver disease patients with and without anxiety/depression symptoms.
Bar chart displays correlation coefficients (r values) between Self-rating Anxiety Scale scores and 11 metabolic parameters. Blue bars indicate positive correlations; orange bar indicates negative correlation. Body mass index showed the strongest positive correlation (r = 0.423), while high-density lipoprotein cholesterol exhibited negative correlation (r = -0.267). aP < 0.01, bP < 0.001. SAS: Self-rating Anxiety Scale; BMI: Body mass index; TG: Triglycerides; FBG: Fasting blood glucose; HbA1c: Glycated hemoglobin; TC: Total cholesterol; LDL-C: Low-density lipoprotein cholesterol; ALT: Alanine aminotransferase; AST: Aspartate aminotransferase; HDL-C: High-density lipoprotein cholesterol.
- Citation: Wei ZW, Liu XD, Li DY, Cheng WL, Fu YP, Yang D. Anxiety and depression symptoms correlate with metabolic indicators in metabolic dysfunction-associated steatotic liver disease patients. World J Psychiatry 2026; 16(8): 117628
- URL: https://www.wjgnet.com/2220-3206/full/v16/i8/117628.htm
- DOI: https://dx.doi.org/10.5498/wjp.v16.i8.117628