
















Copyright: ©Author(s) 2026.
World J Psychiatry. Aug 19, 2026; 16(8): 116923
Published online Aug 19, 2026. doi: 10.5498/wjp.v16.i8.116923
Published online Aug 19, 2026. doi: 10.5498/wjp.v16.i8.116923
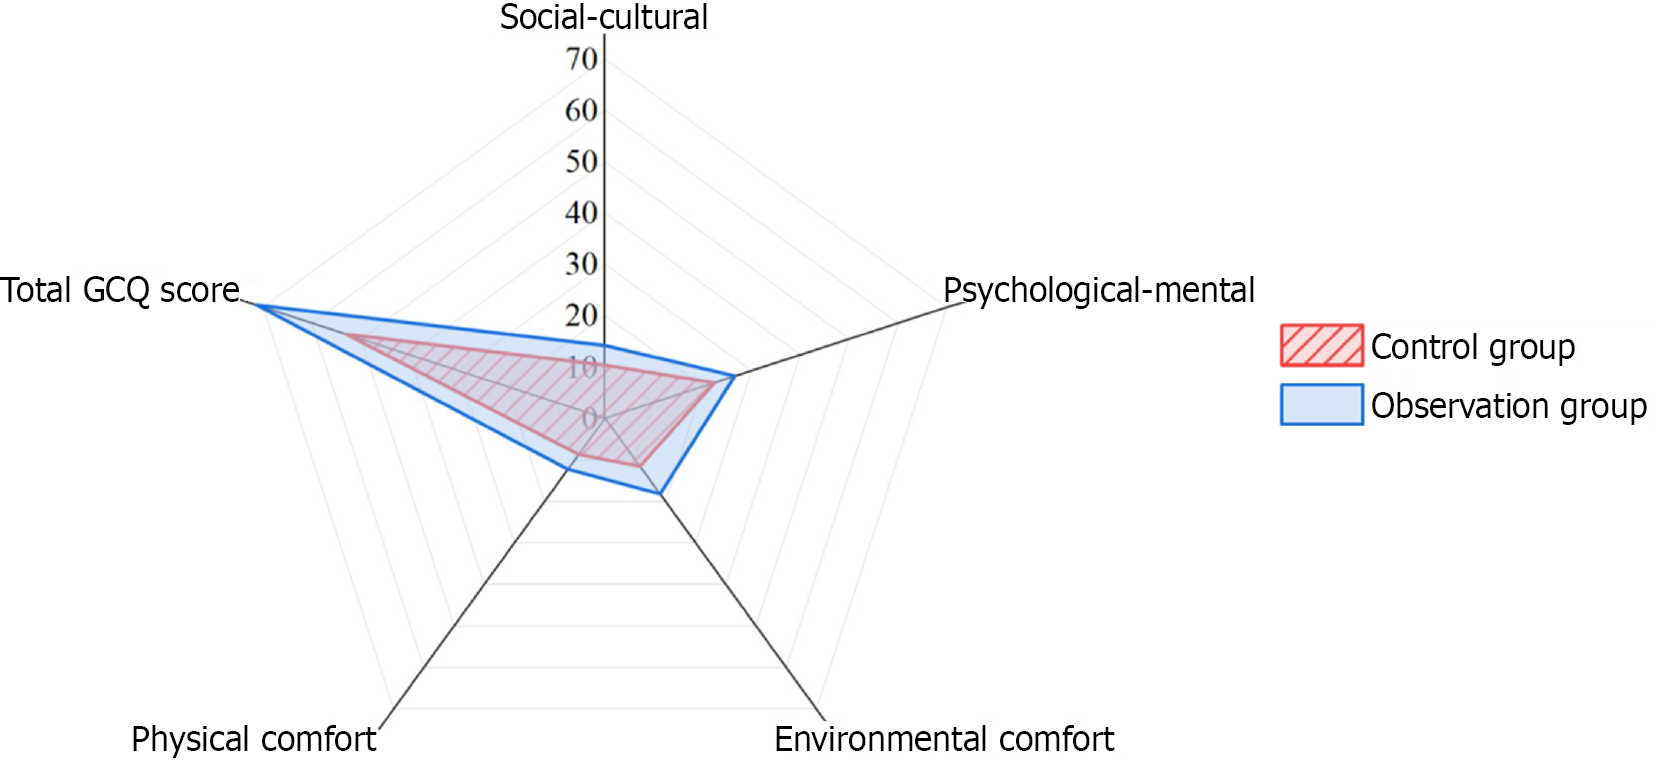
Figure 1 Comparison of General Comfort Questionnaire scores between the observation group and the control group.
The radar chart presents scores for the five dimensions of the General Comfort Questionnaire (social-cultural, psychological-mental, physical comfort, and environmental comfort), along with the total score. GCQ: General Comfort Questionnaire.
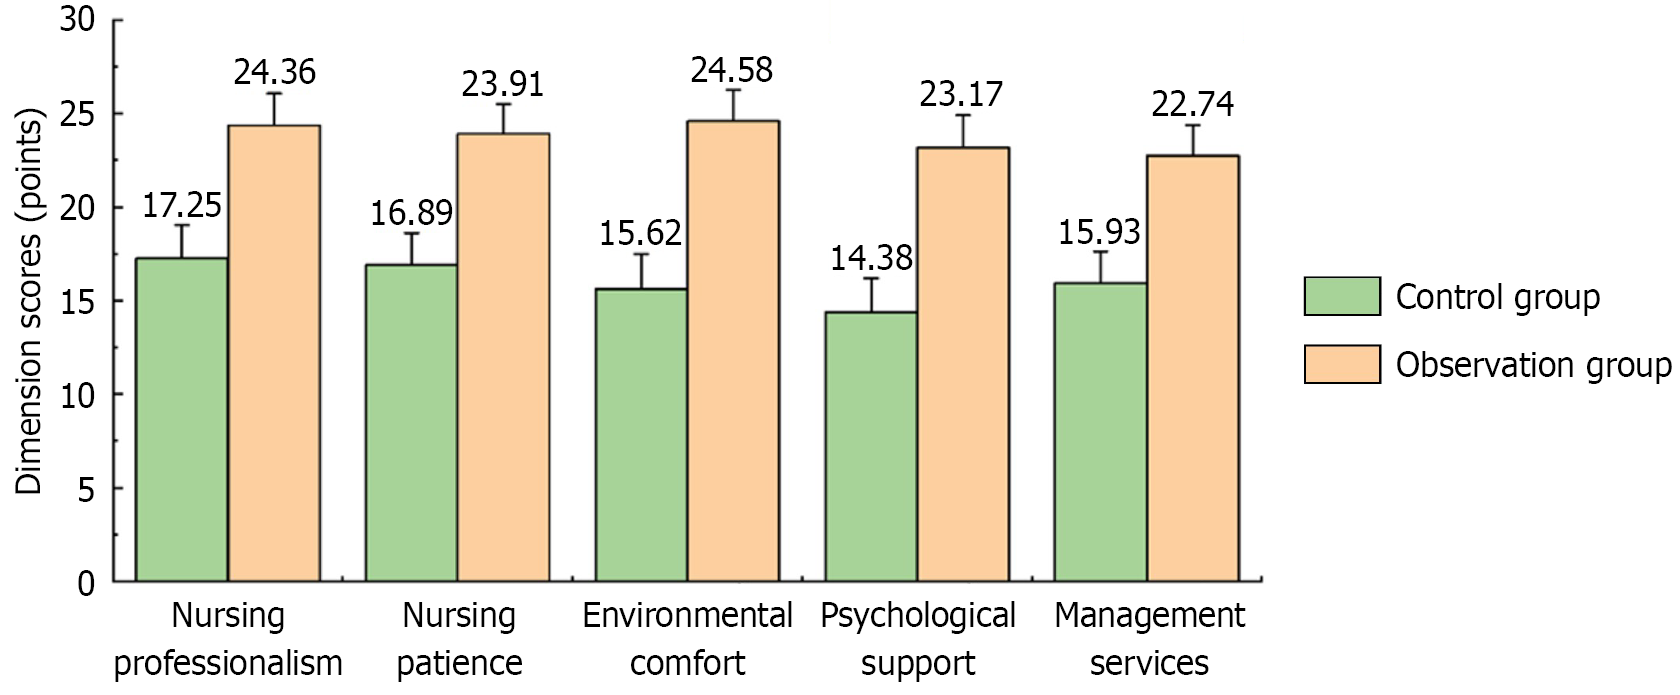
Figure 2 Comparison of satisfaction scores between the observation group and the control group.
Error bars represent the standard deviation.
- Citation: Gong XR, Song XM, Bao XC. Effect of labor-delivery-recovery-postpartum family-centered obstetrics care combined with painless delivery on postpartum depression in primiparas. World J Psychiatry 2026; 16(8): 116923
- URL: https://www.wjgnet.com/2220-3206/full/v16/i8/116923.htm
- DOI: https://dx.doi.org/10.5498/wjp.v16.i8.116923