
















Copyright: ©Author(s) 2026.
World J Psychiatry. Jul 19, 2026; 16(7): 119439
Published online Jul 19, 2026. doi: 10.5498/wjp.119439
Published online Jul 19, 2026. doi: 10.5498/wjp.119439
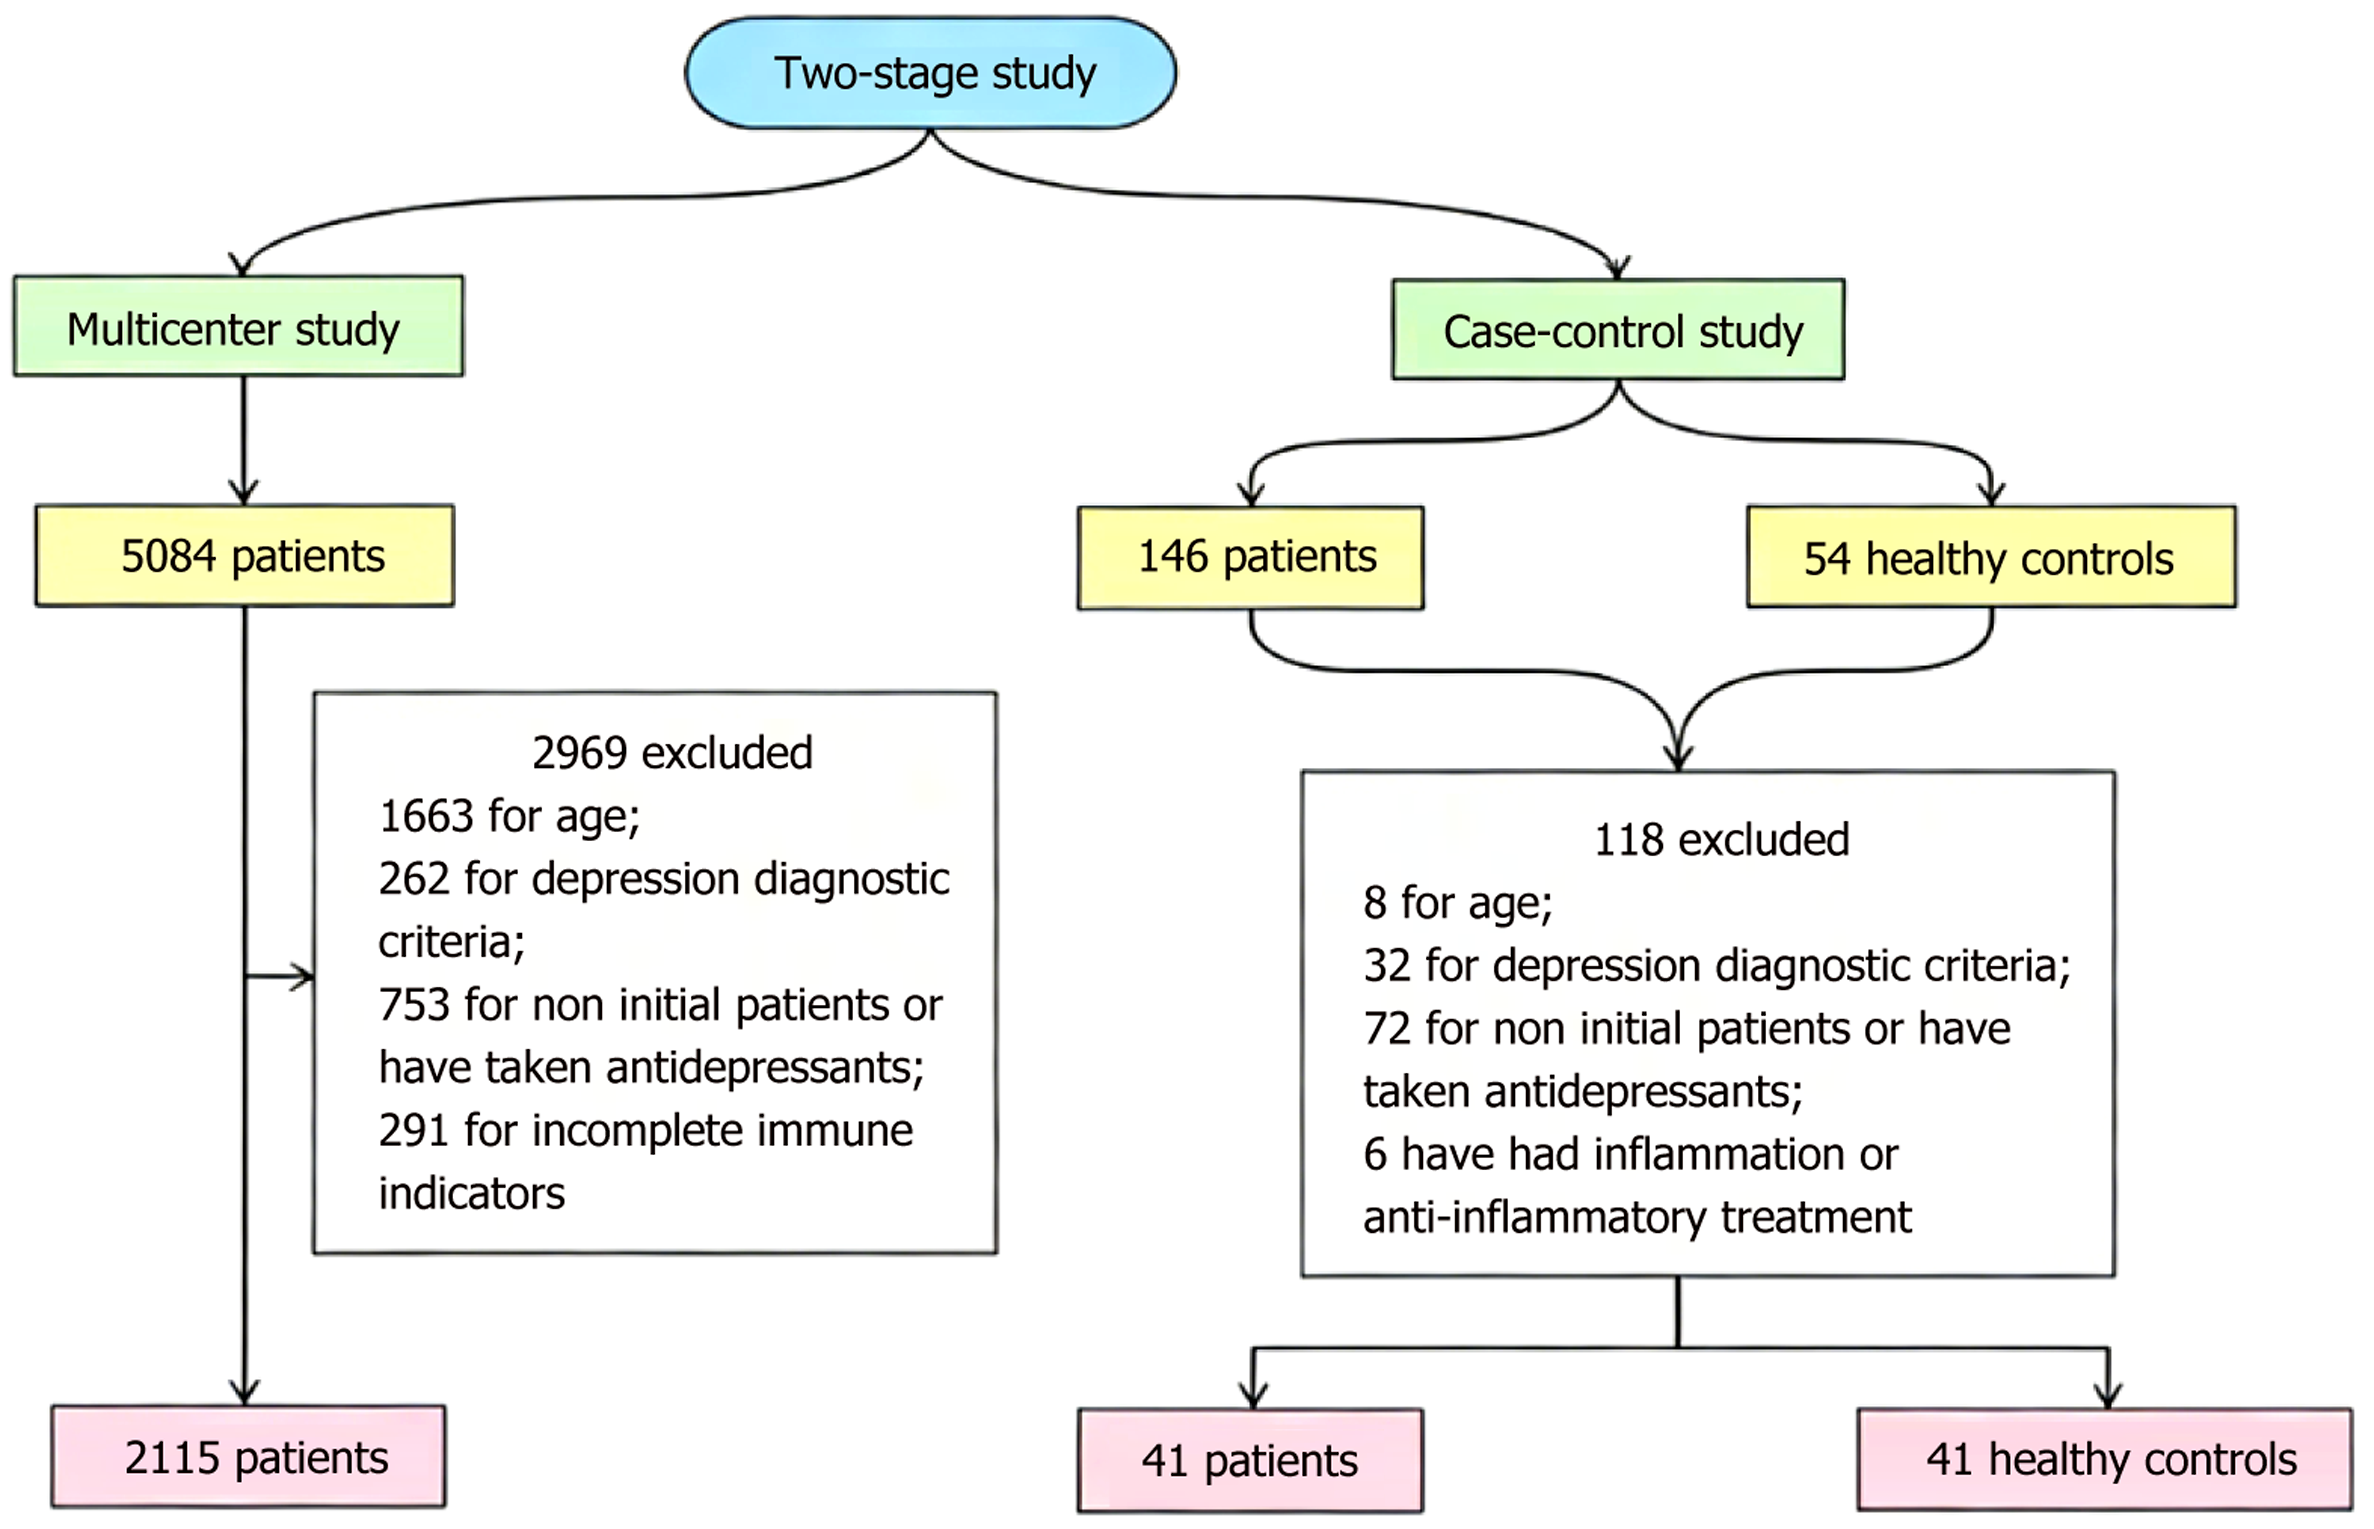
Figure 1 Flowchart of the study design and subject screening procedure.
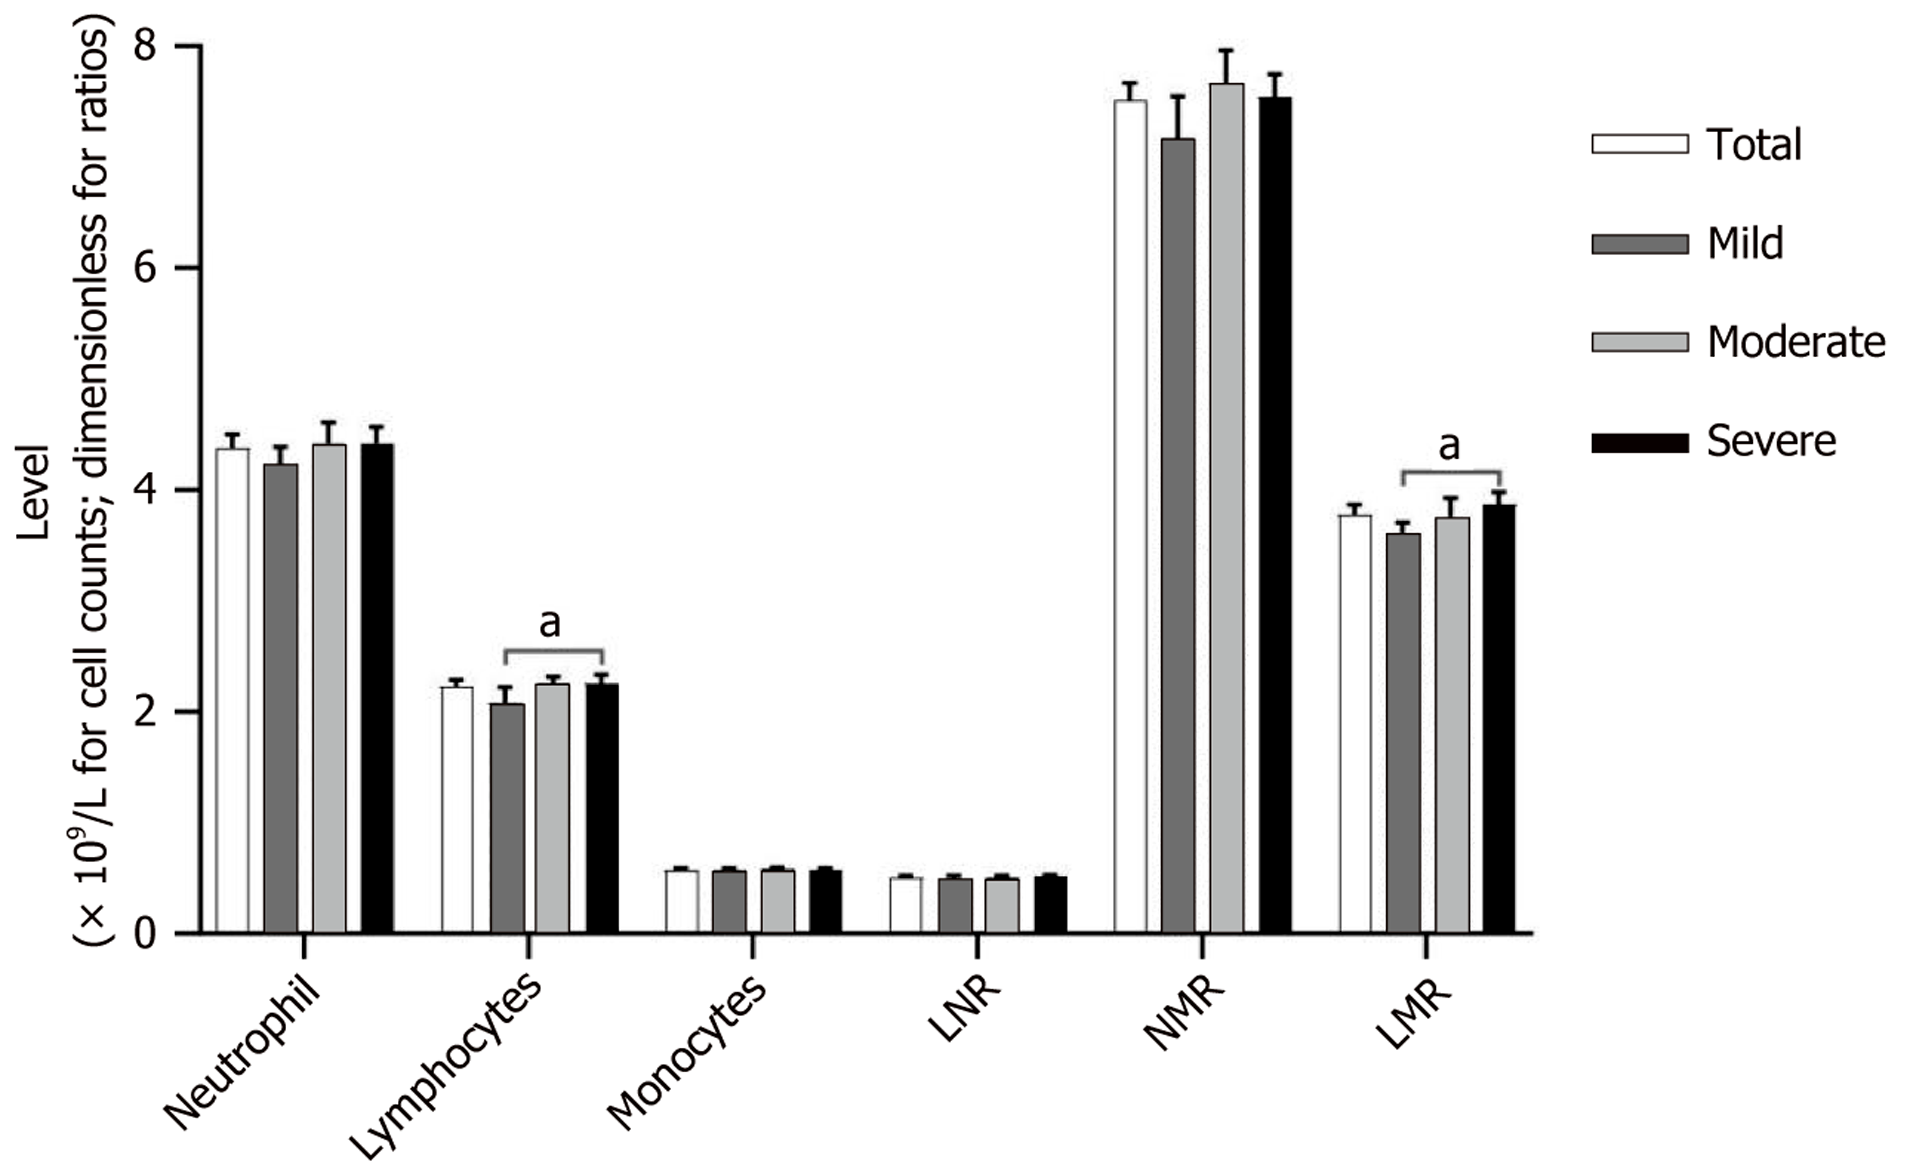
Figure 2 Dunn’s test for multiple comparison between immune markers.
aP < 0.05. LNR: Lymphocyte-to-neutrophil ratio; NMR: Neutrophil-to-monocyte ratio; LMR: Lymphocyte-to-monocyte ratio.
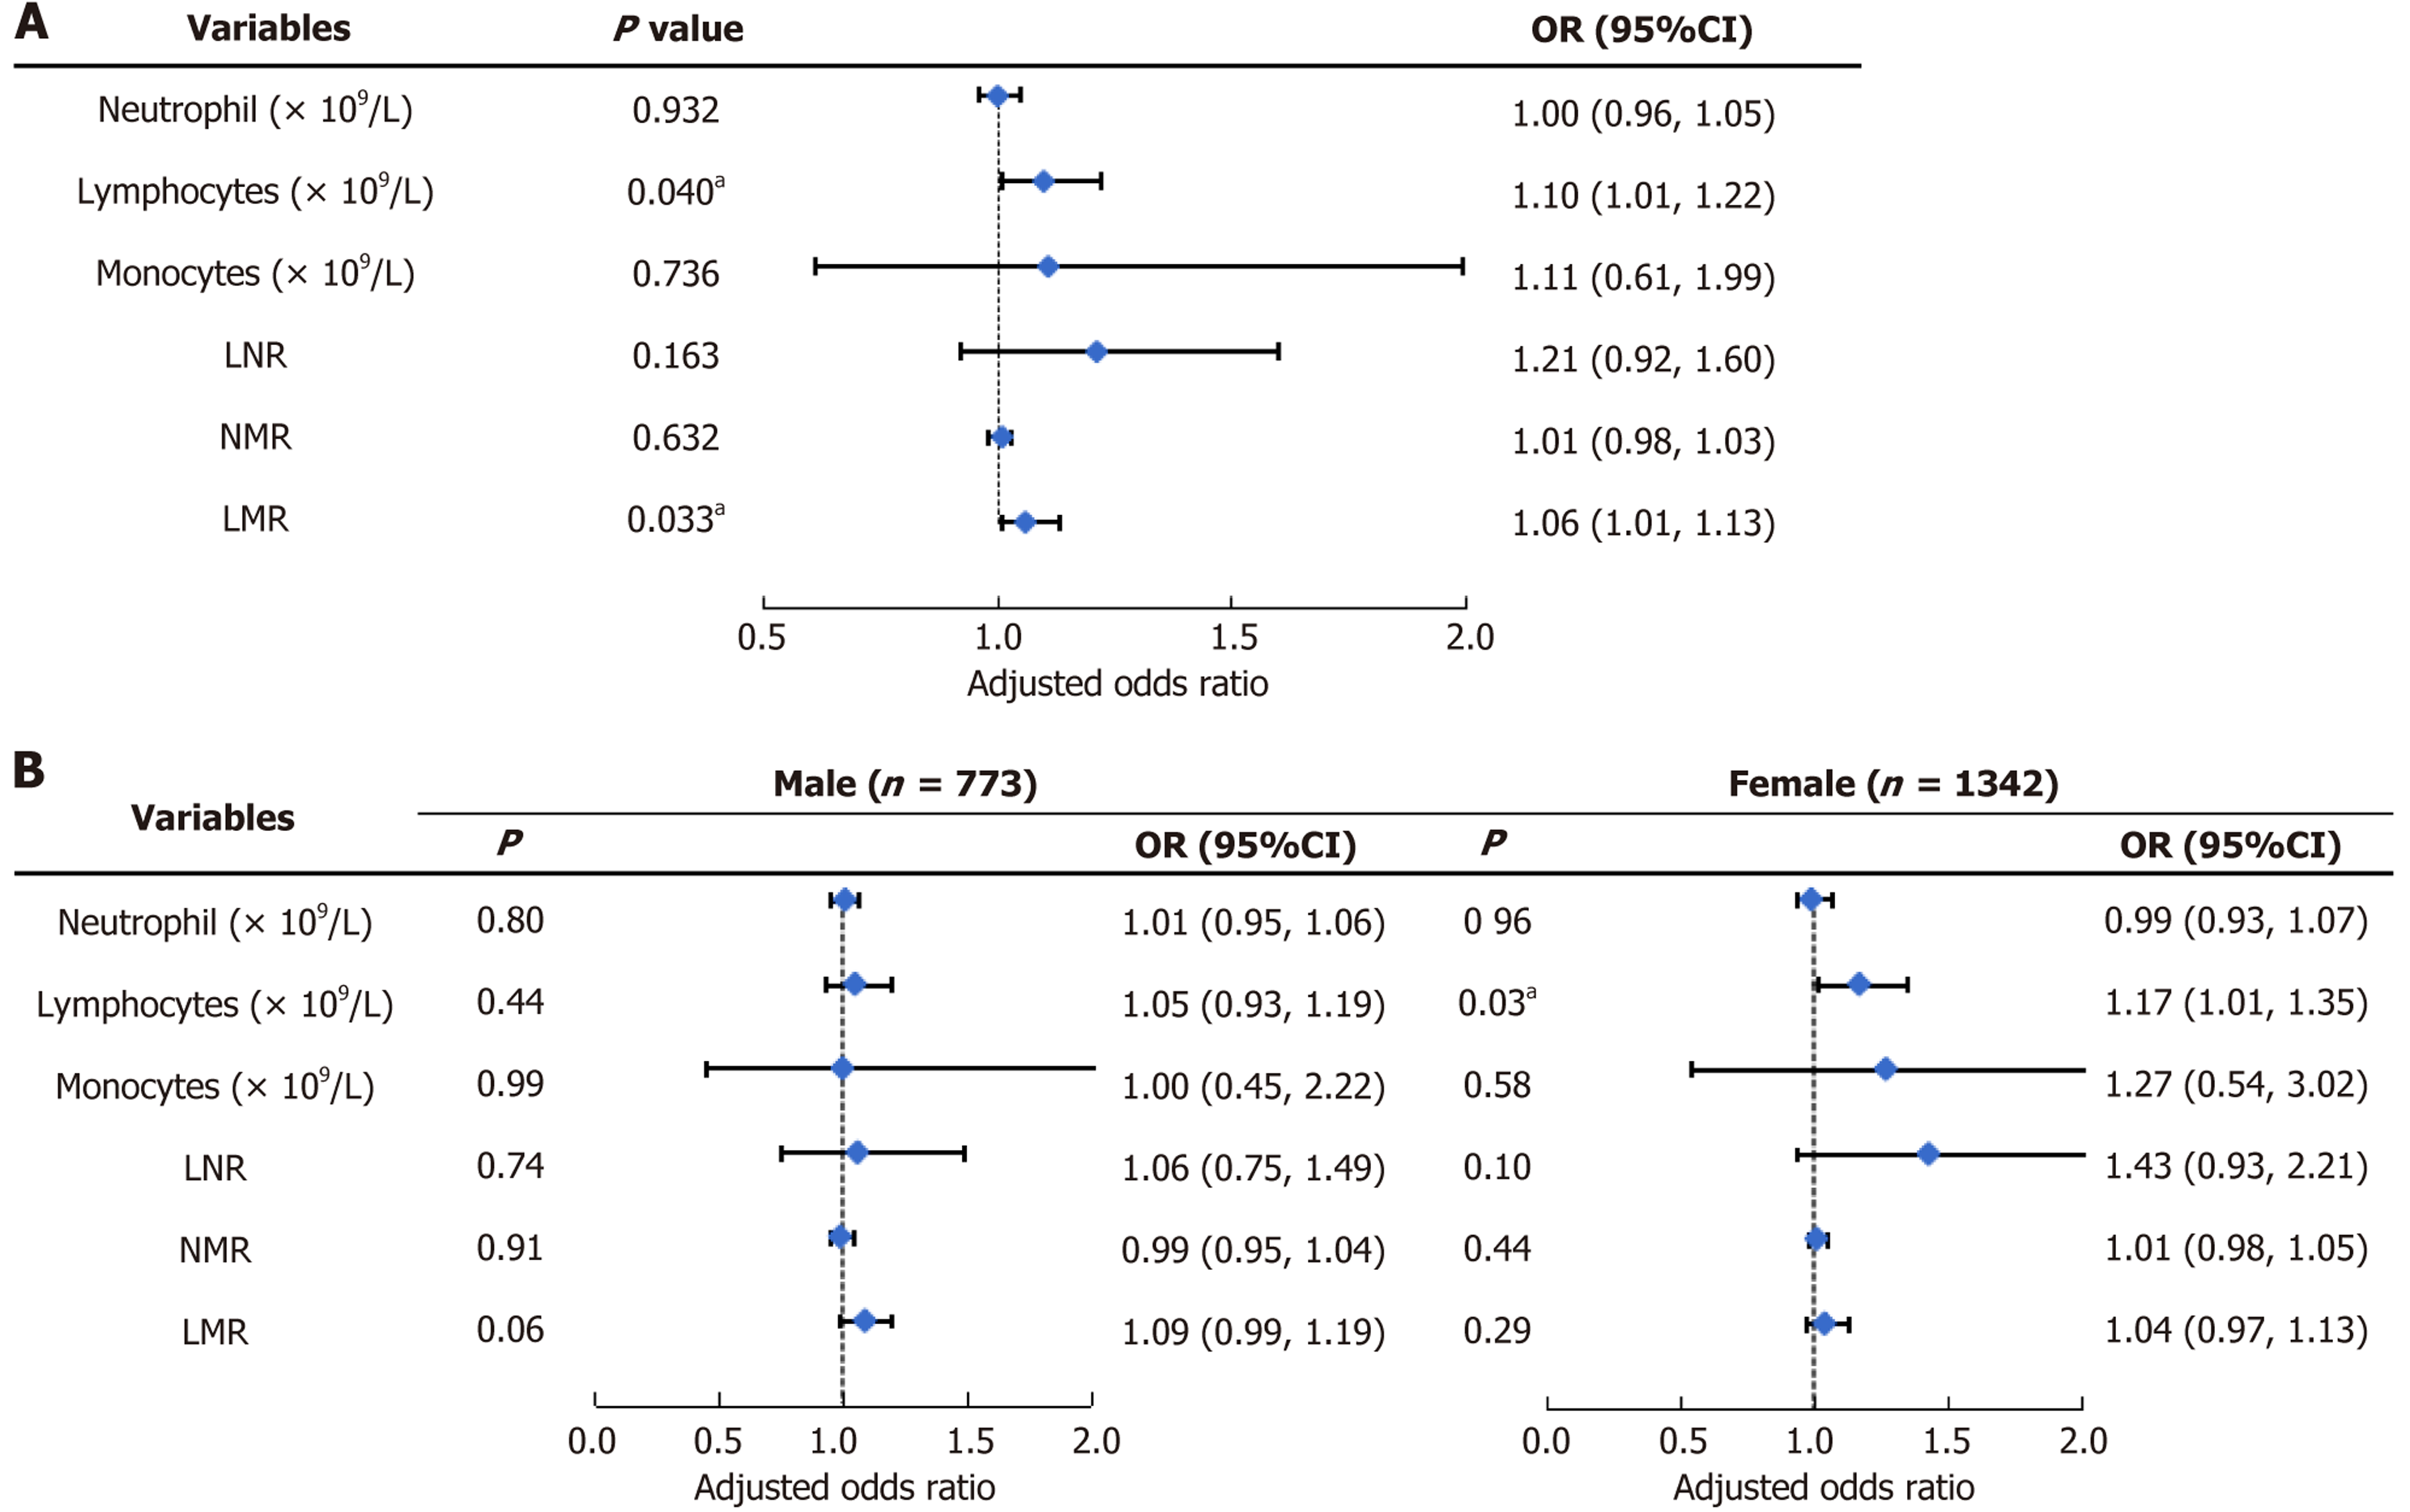
Figure 3 Ordered logistic regression analysis.
A: Ordered logistic regression analysis, adjusted for age and sex; B: Ordered logistic regression analysis between sexes. aP < 0.05. LNR: Lymphocyte-to-neutrophil ratio; NMR: Neutrophil-to-monocyte ratio; LMR: Lymphocyte-to-monocyte ratio; OR: Odds ratio; CI: Confidence interval.
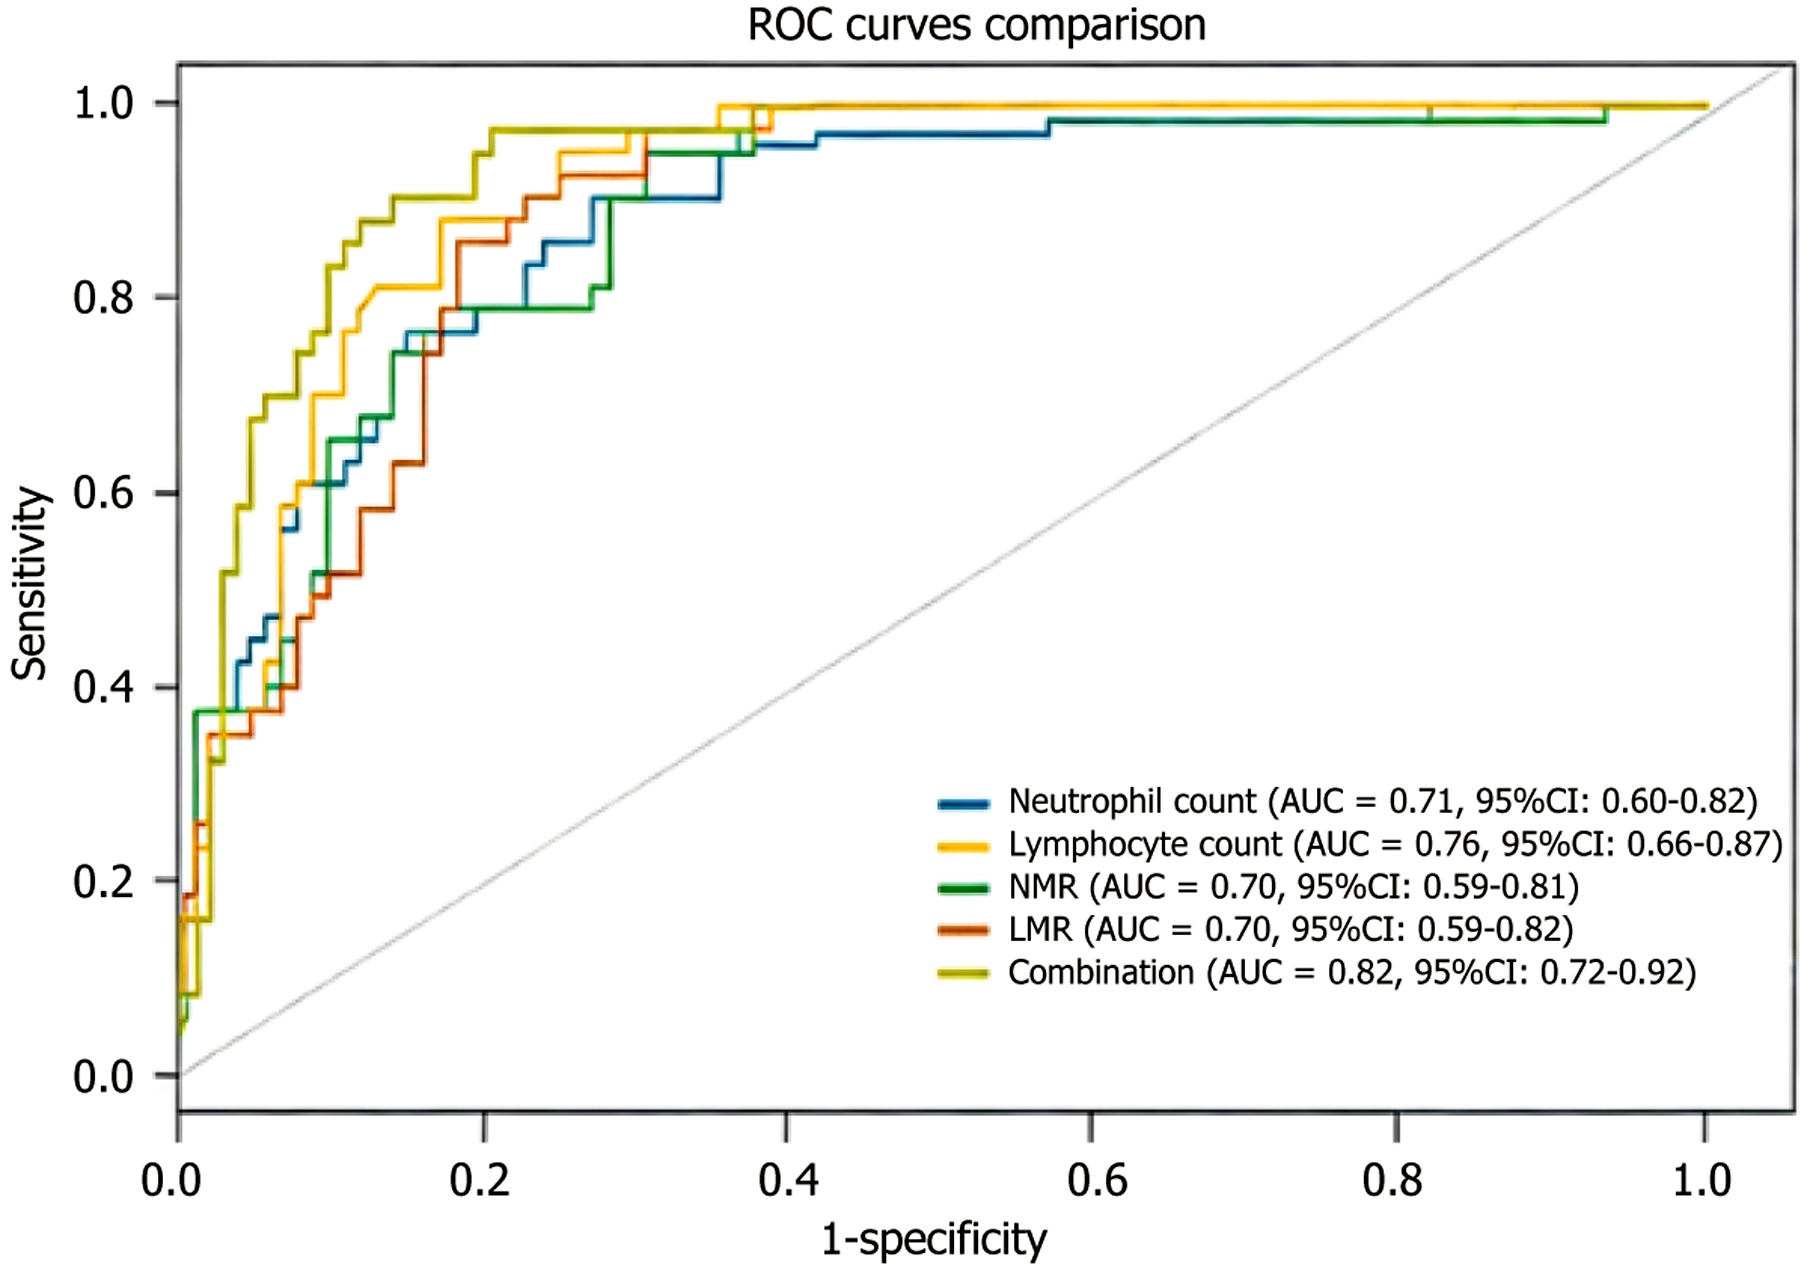
Figure 4 Receiver operating characteristic curve analysis of inflammation indicators for predicting depression in adolescents.
ROC: Receiver operating characteristic; AUC: Area under the curve; CI: Confidence interval; NMR: Neutrophil-to-monocyte ratio; LMR: Lymphocyte-to-monocyte ratio.
- Citation: Fan XW, Hou JZ, Wang YZ, Gao ML, Shen Y, Jian D, Zhou Q, Yang J, Zhao H, Zhang LJ. Divergent lymphocyte associations with depression severity and case status in first-episode, drug-naive adolescents: A multicenter study. World J Psychiatry 2026; 16(7): 119439
- URL: https://www.wjgnet.com/2220-3206/full/v16/i7/119439.htm
- DOI: https://dx.doi.org/10.5498/wjp.119439