















Copyright: ©Author(s) 2026.
World J Psychiatry. Jul 19, 2026; 16(7): 117458
Published online Jul 19, 2026. doi: 10.5498/wjp.117458
Published online Jul 19, 2026. doi: 10.5498/wjp.117458
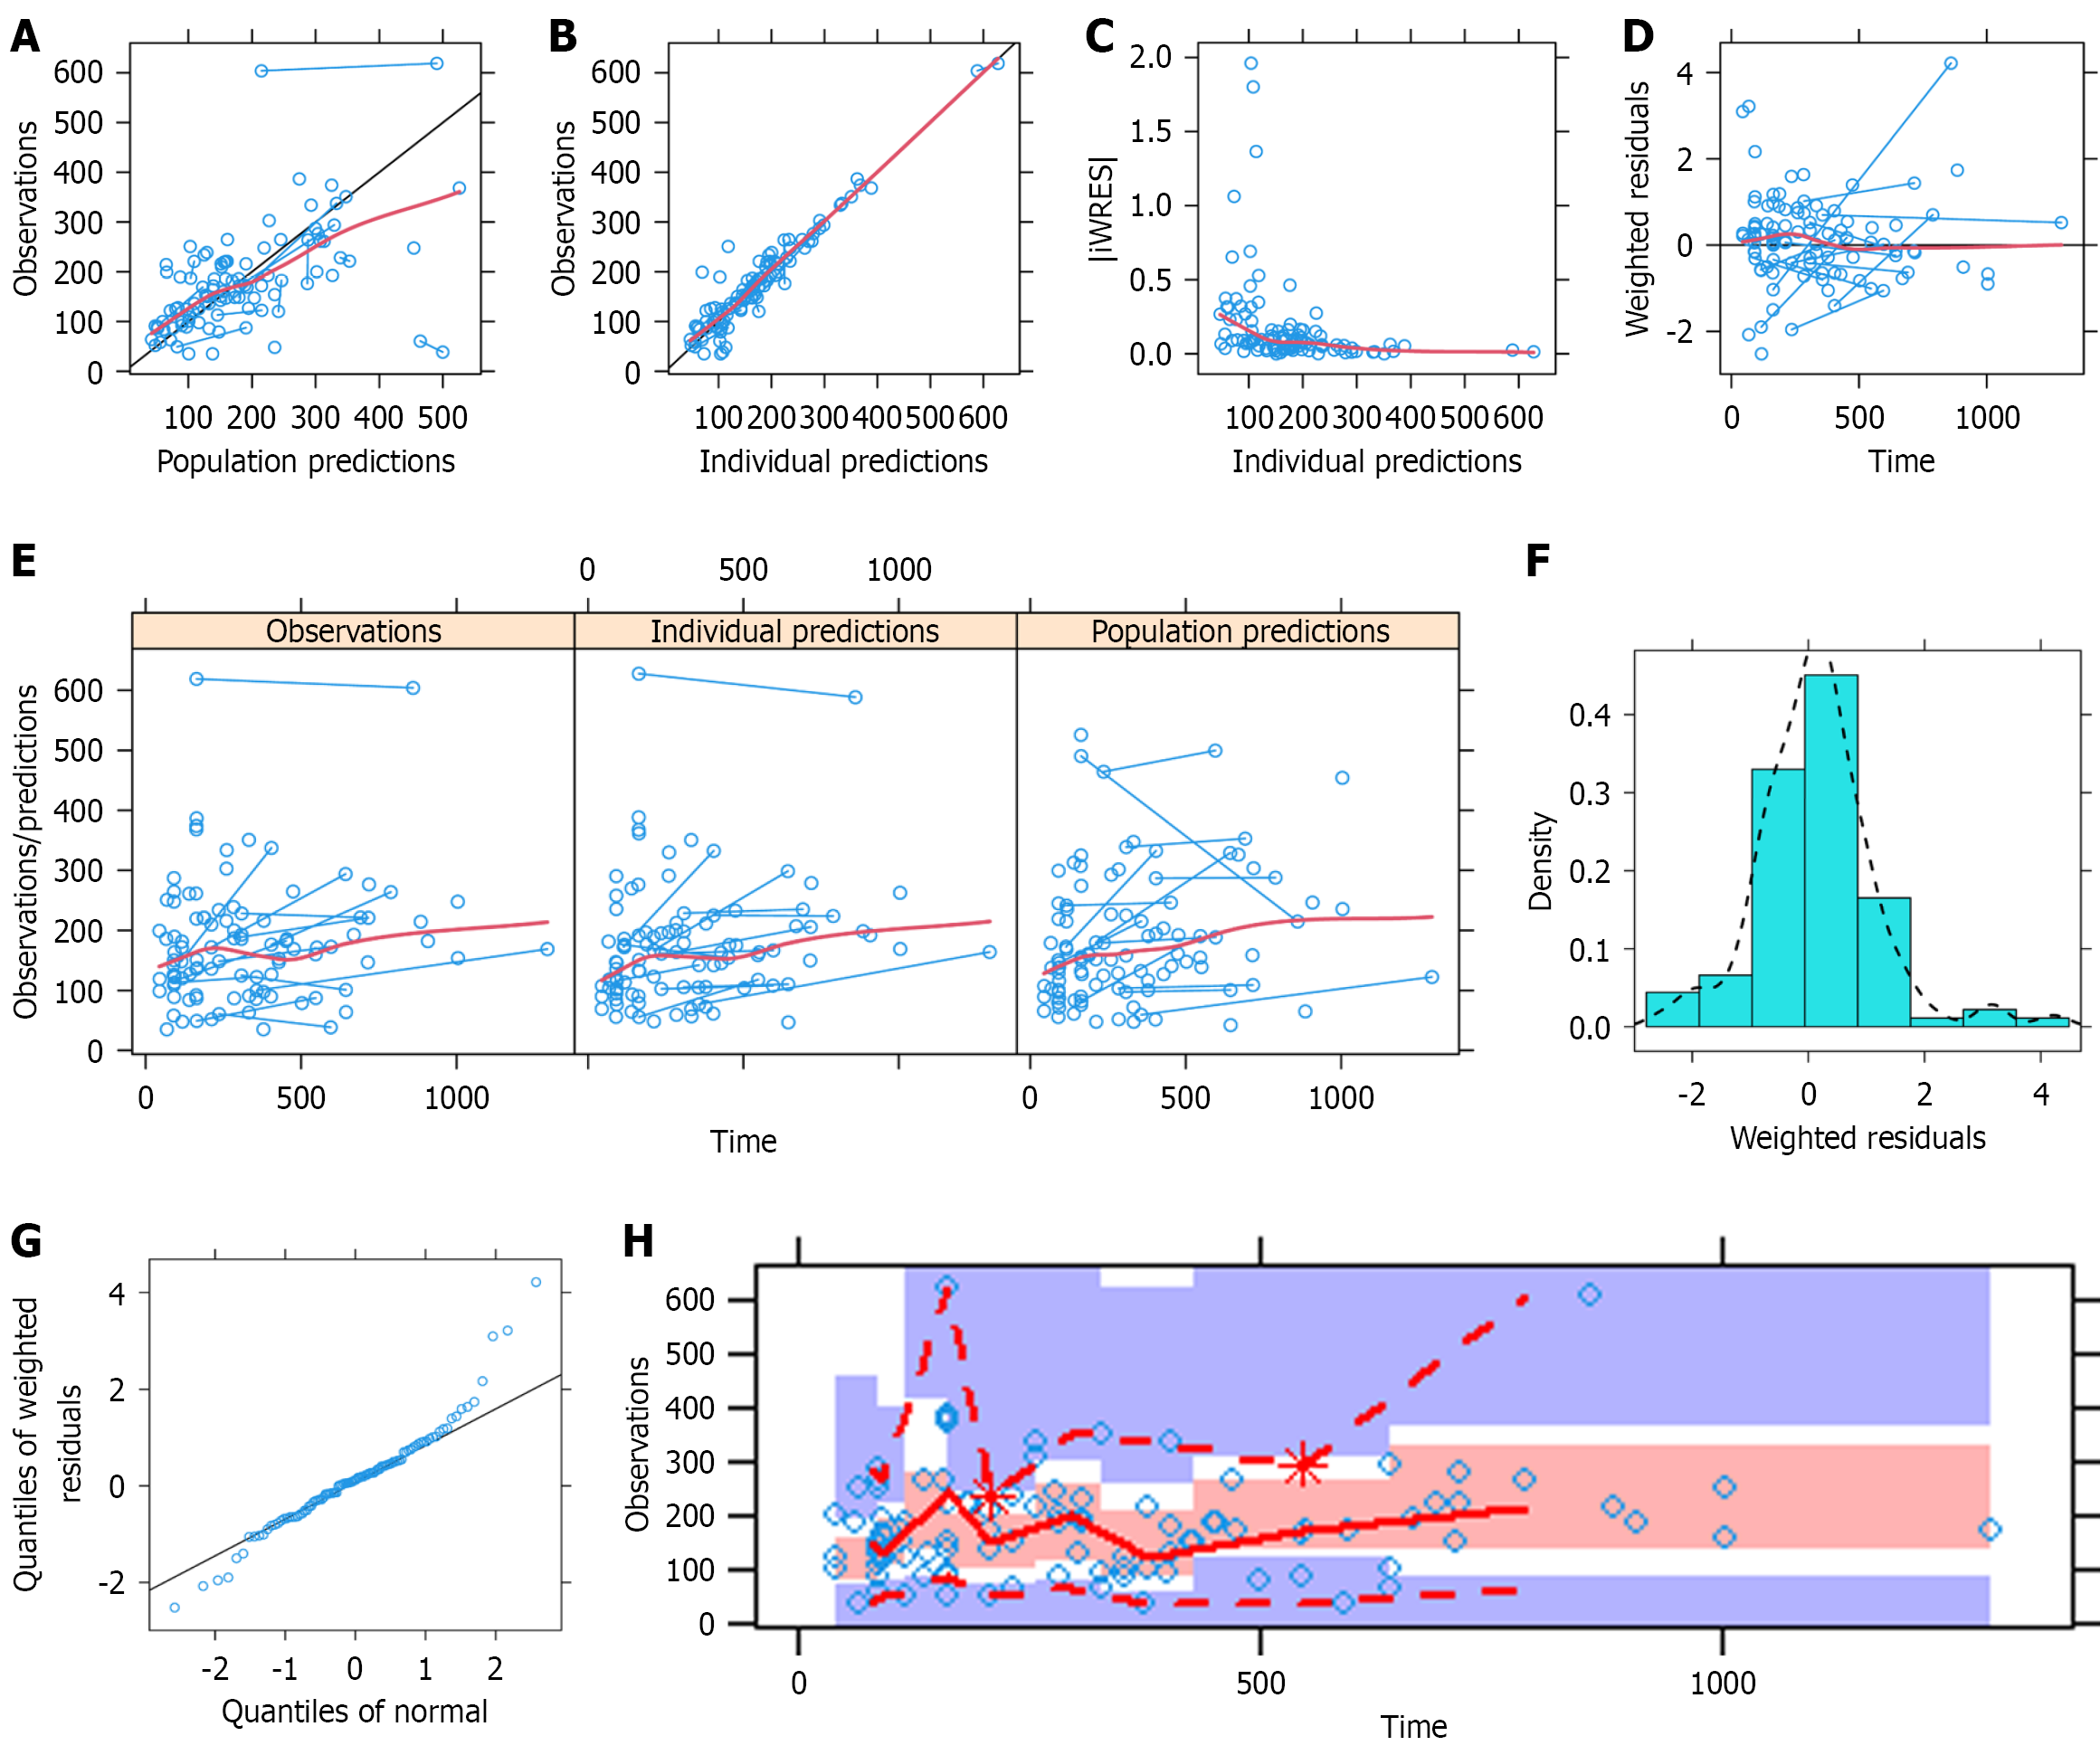
Figure 1 Model evaluation.
A: Observations vs population predictions; B: Observations vs individual predictions; C: Absolute value of weighted residuals of individual vs individual predictions; D: Weighted residuals vs time; E: Observations/predictions vs time; F: Density vs weighted residuals; G: Quantiles of weighted residuals vs quantiles of normal; H: Visual predictive check of model. iWRES: Weighted residuals of individual.
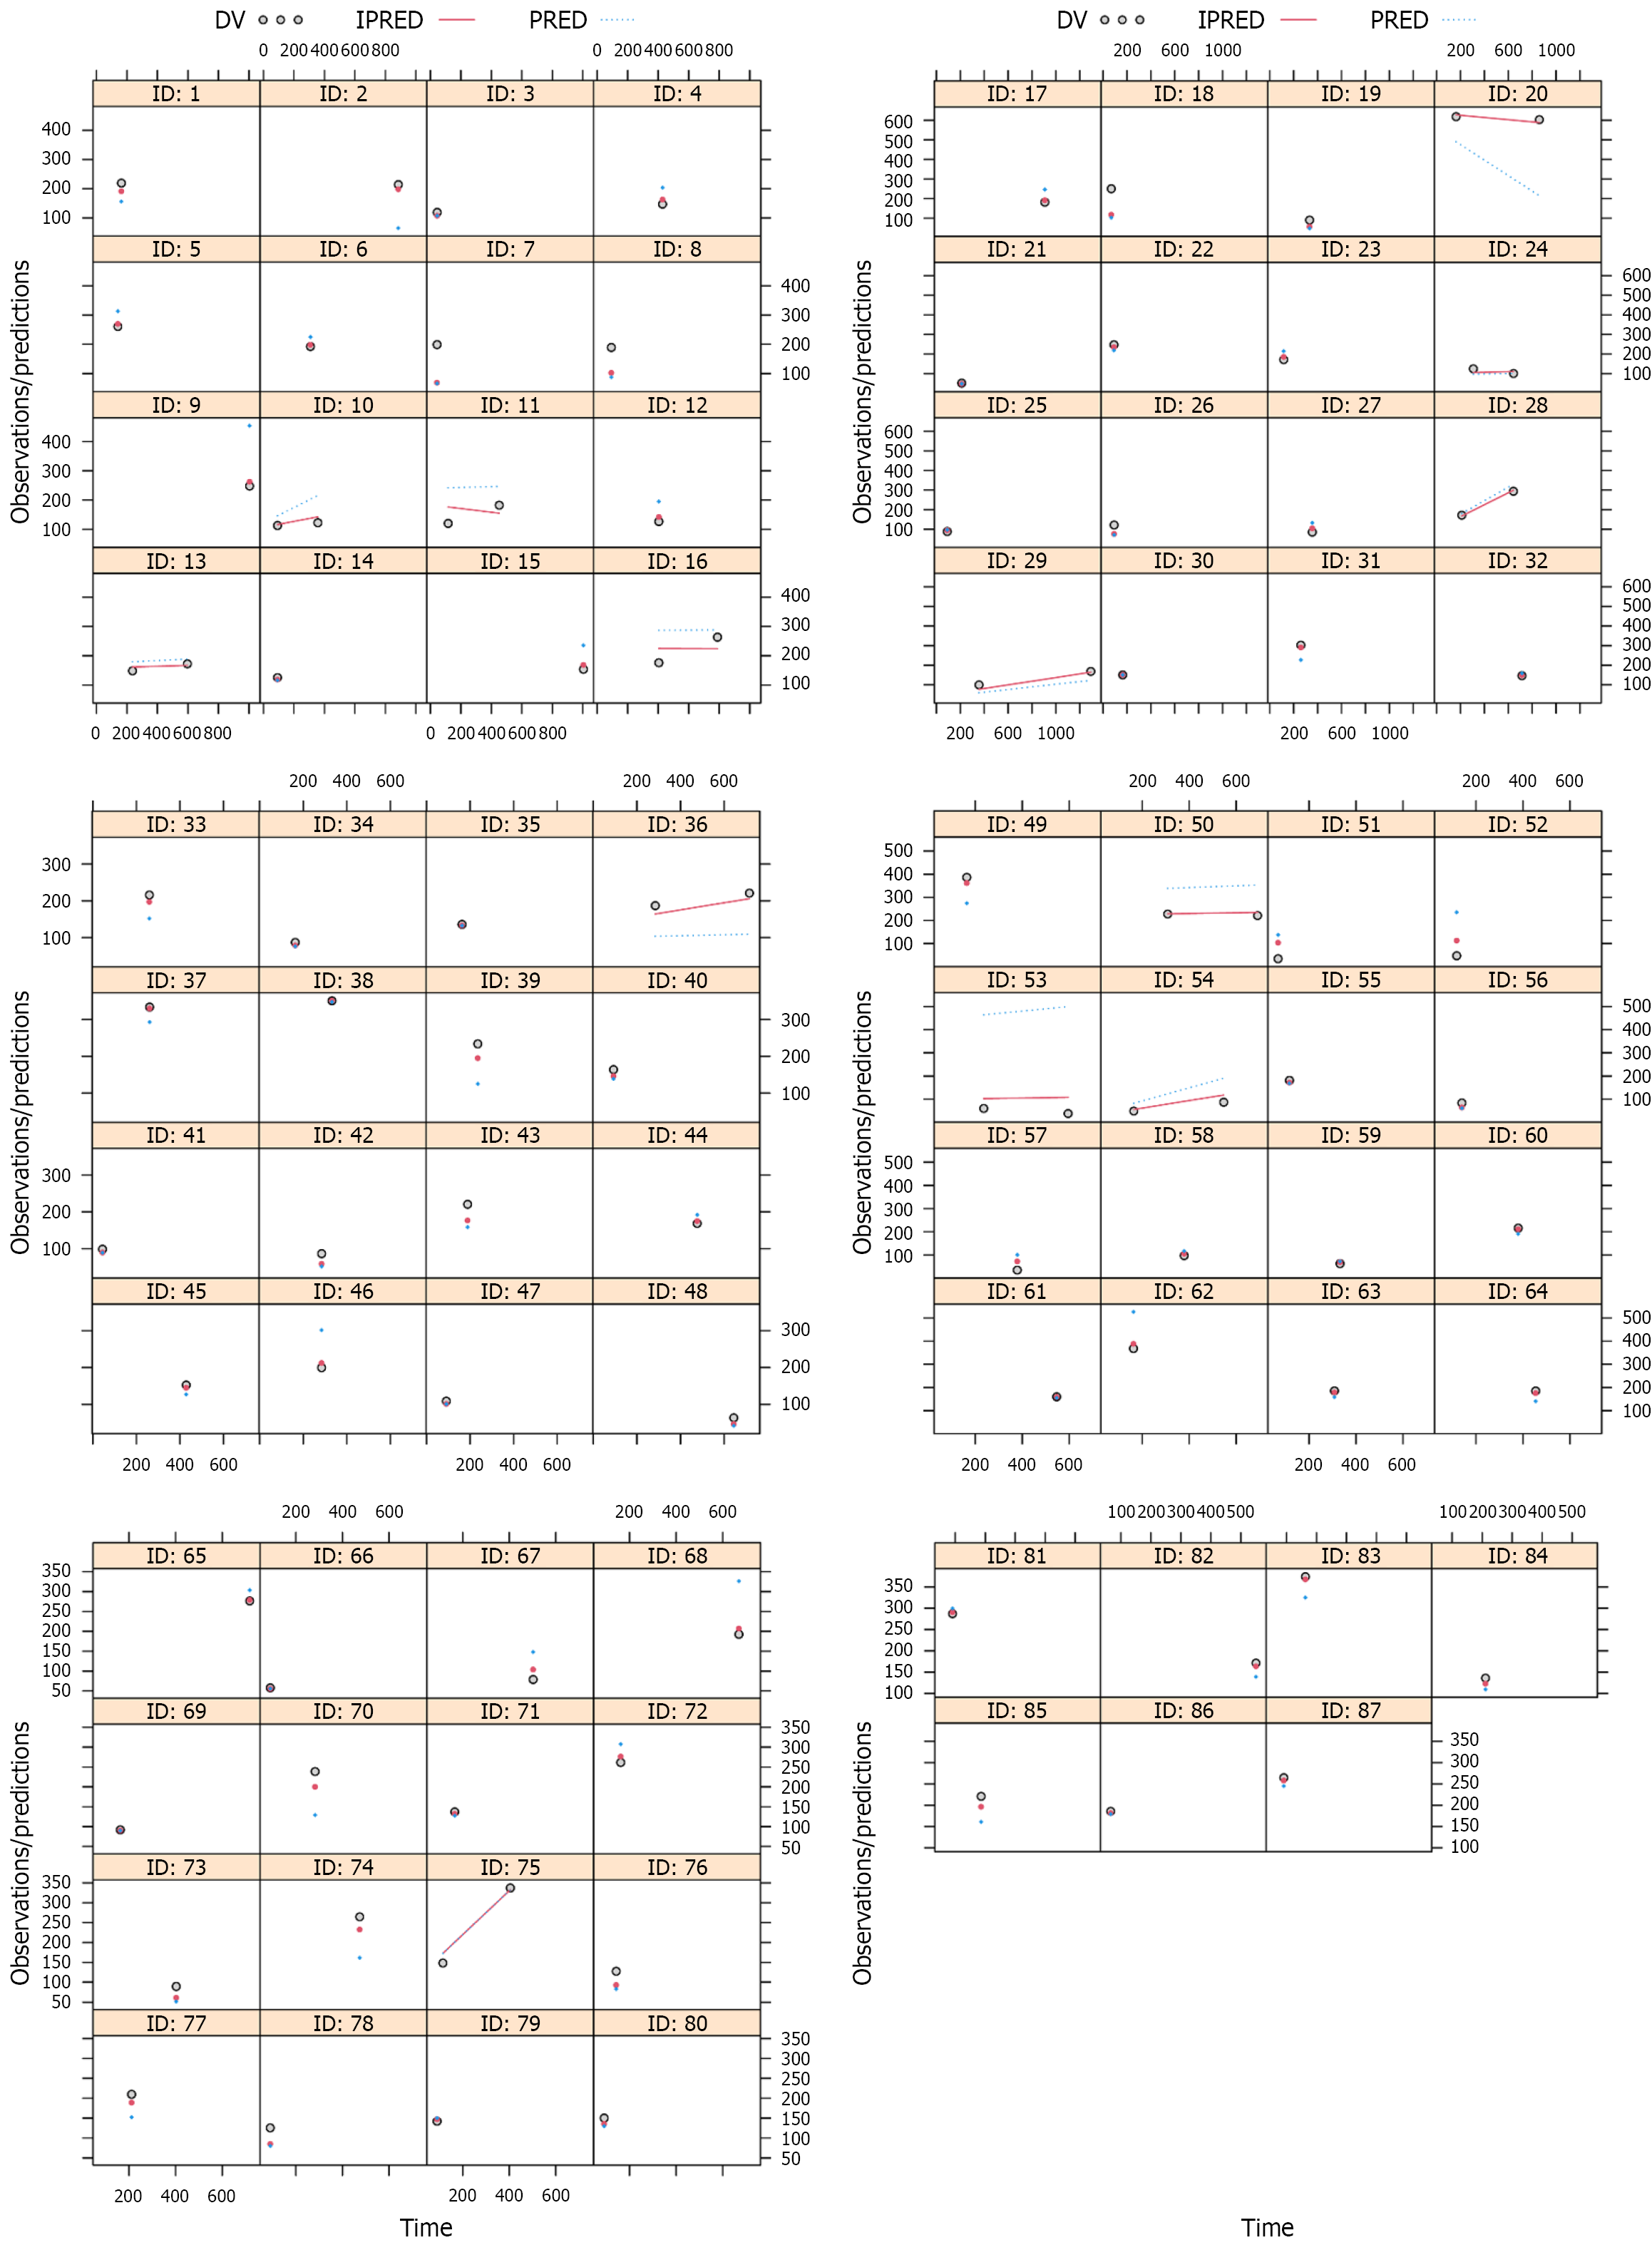
Figure 2 Individual plots.
ID: Patient ID number; DV: Measured concentration value; IPRED: Individual predictive value; PRED: Population predictive value.
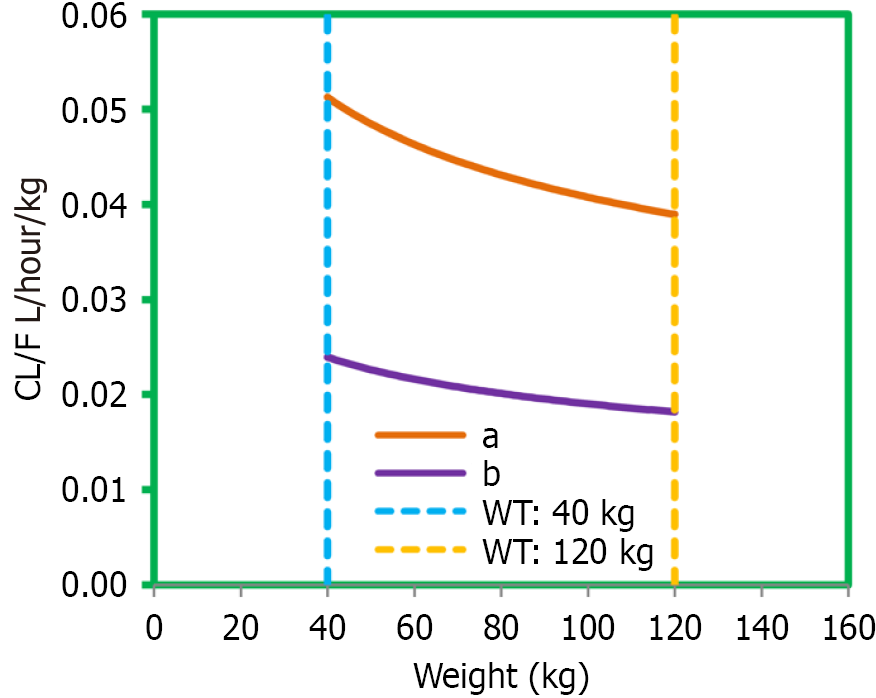
Figure 3 Aripiprazole clearance in depressed patients.
a: Depressed patients without paroxetine hydrochloride tablet; b: Depressed patients with paroxetine hydrochloride tablet.
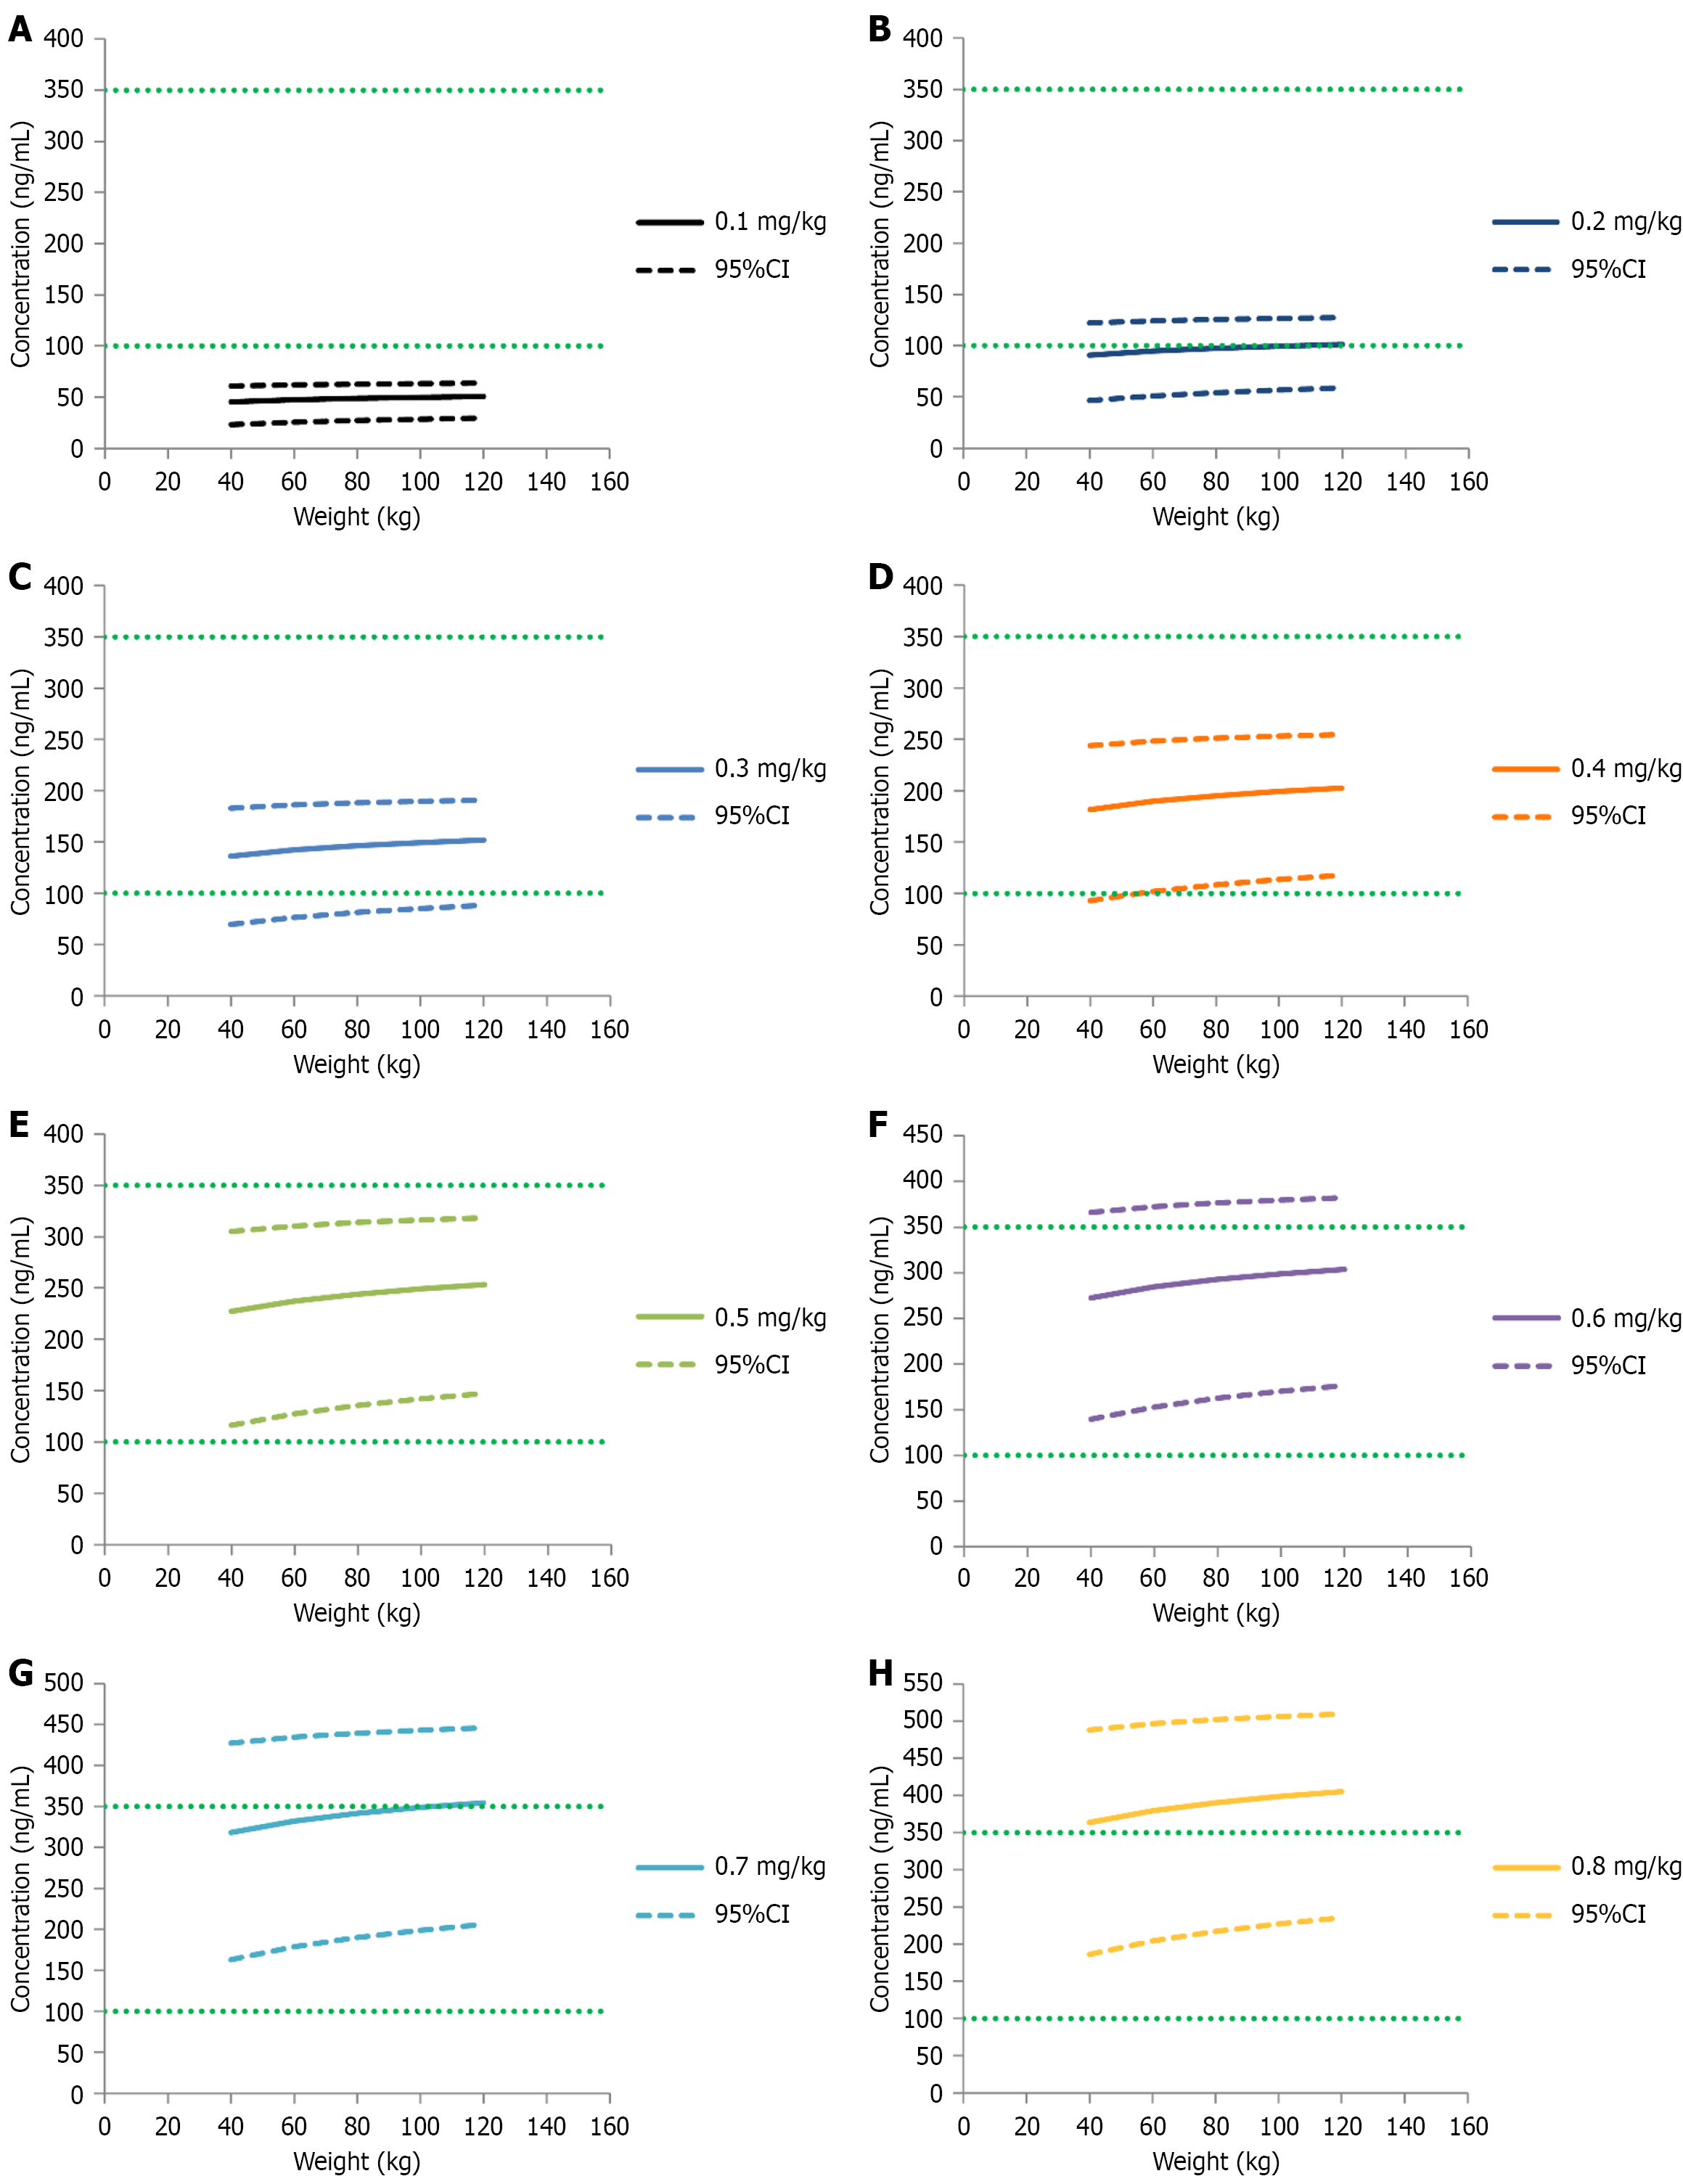
Figure 4 Aripiprazole concentrations in depressed patients without paroxetine hydrochloride tablet under different simulated dosages.
A: Depressed patients under simulated administration dosage of 0.1 mg/kg aripiprazole; B: Depressed patients under simulated administration dosage of 0.2 mg/kg aripiprazole; C: Depressed patients under simulated administration dosage of 0.3 mg/kg aripiprazole; D: Depressed patients under simulated administration dosage of 0.4 mg/kg aripiprazole; E: Depressed patients under simulated administration dosage of 0.5 mg/kg aripiprazole; F: Depressed patients under simulated administration dosage of 0.6 mg/kg aripiprazole; G: Depressed patients under simulated administration dosage of 0.7 mg/kg aripiprazole; H: Depressed patients under simulated administration dosage of 0.8 mg/kg aripiprazole. CI: Confidence interval.
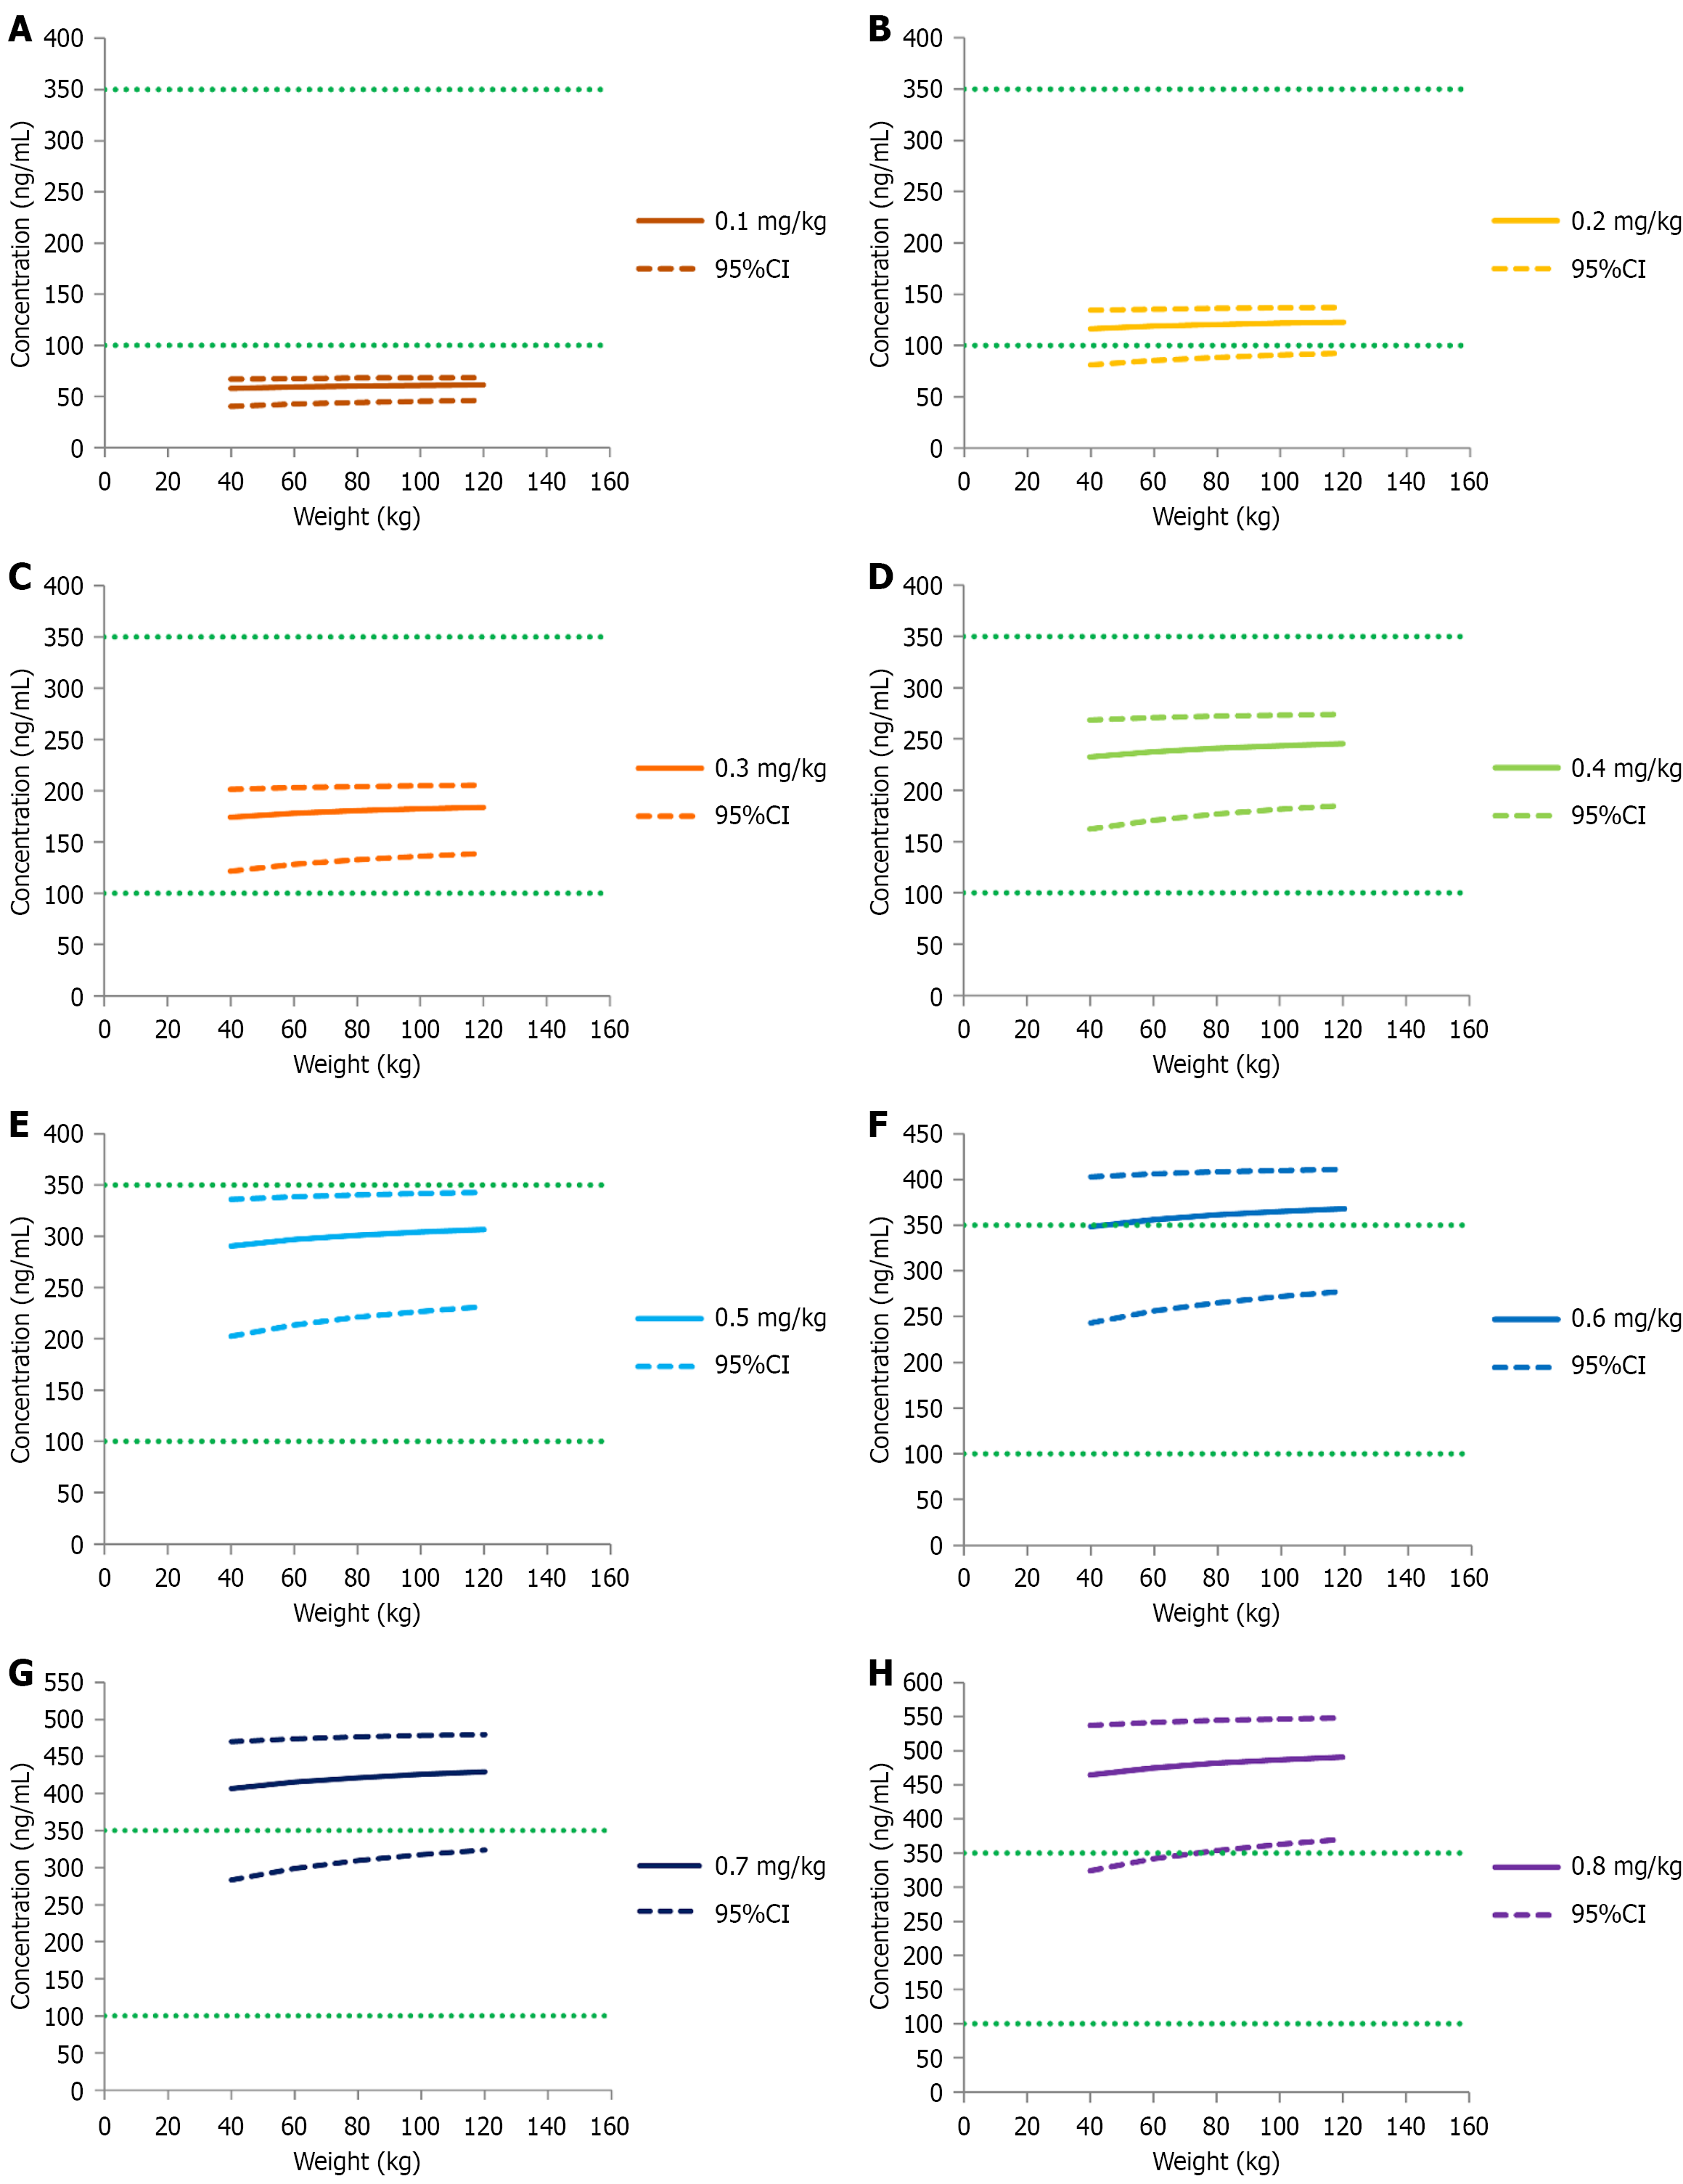
Figure 5 Aripiprazole concentrations in depressed patients with paroxetine hydrochloride tablet under different simulated dosages.
A: Depressed patients under simulated administration dosage of 0.1 mg/kg aripiprazole; B: Depressed patients under simulated administration dosage of 0.2 mg/kg aripiprazole; C: Depressed patients under simulated administration dosage of 0.3 mg/kg aripiprazole; D: Depressed patients under simulated administration dosage of 0.4 mg/kg aripiprazole; E: Depressed patients under simulated administration dosage of 0.5 mg/kg aripiprazole; F: Depressed patients under simulated administration dosage of 0.6 mg/kg aripiprazole; G: Depressed patients under simulated administration dosage of 0.7 mg/kg aripiprazole; H: Depressed patients under simulated administration dosage of 0.8 mg/kg aripiprazole. CI: Confidence interval.
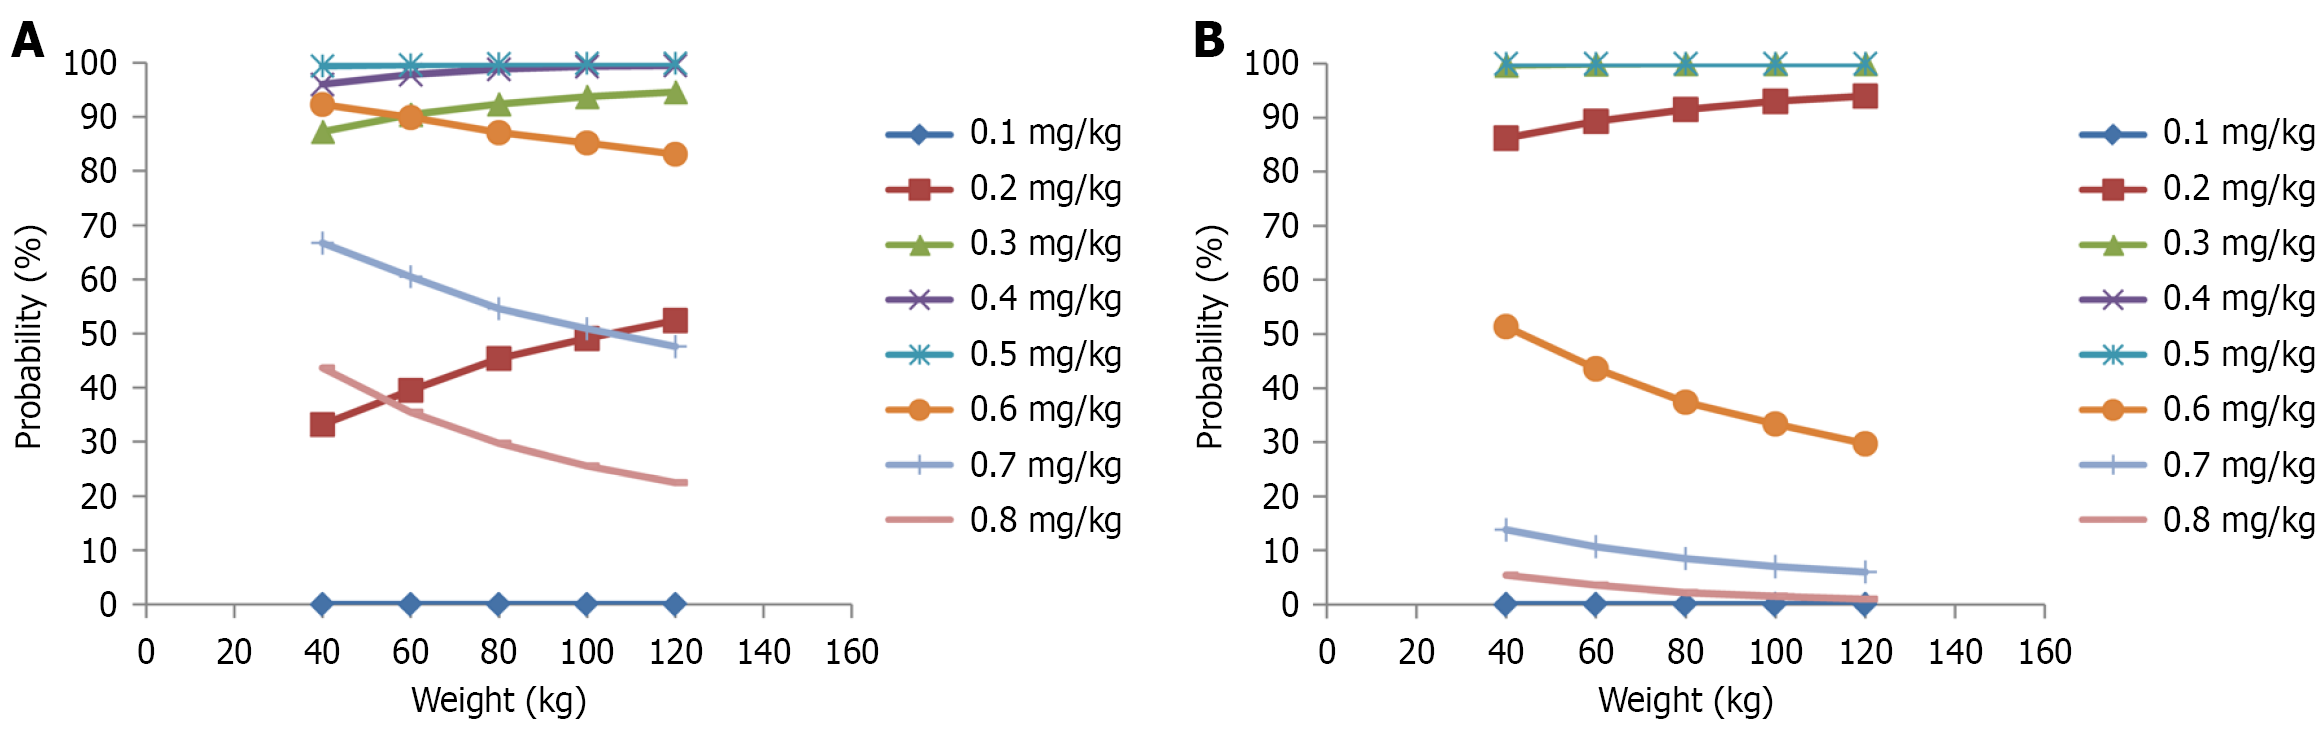
Figure 6 Probability of realizing aripiprazole therapeutic range in depressed patients under different simulated dosages.
A: Depressed patients without paroxetine hydrochloride tablet; B: Depressed patients with paroxetine hydrochloride tablet.
- Citation: Jin YW, Zhang Y, Wang J, Jiang L, He SM, Zhang C, Wang DD. Effects of paroxetine on aripiprazole and individualized administration in depressed patients based on model-informed precision dosing. World J Psychiatry 2026; 16(7): 117458
- URL: https://www.wjgnet.com/2220-3206/full/v16/i7/117458.htm
- DOI: https://dx.doi.org/10.5498/wjp.117458