
















Copyright: ©Author(s) 2026.
World J Psychiatry. Nov 19, 2026; 16(11): 123105
Published online Nov 19, 2026. doi: 10.5498/wjp.123105
Published online Nov 19, 2026. doi: 10.5498/wjp.123105
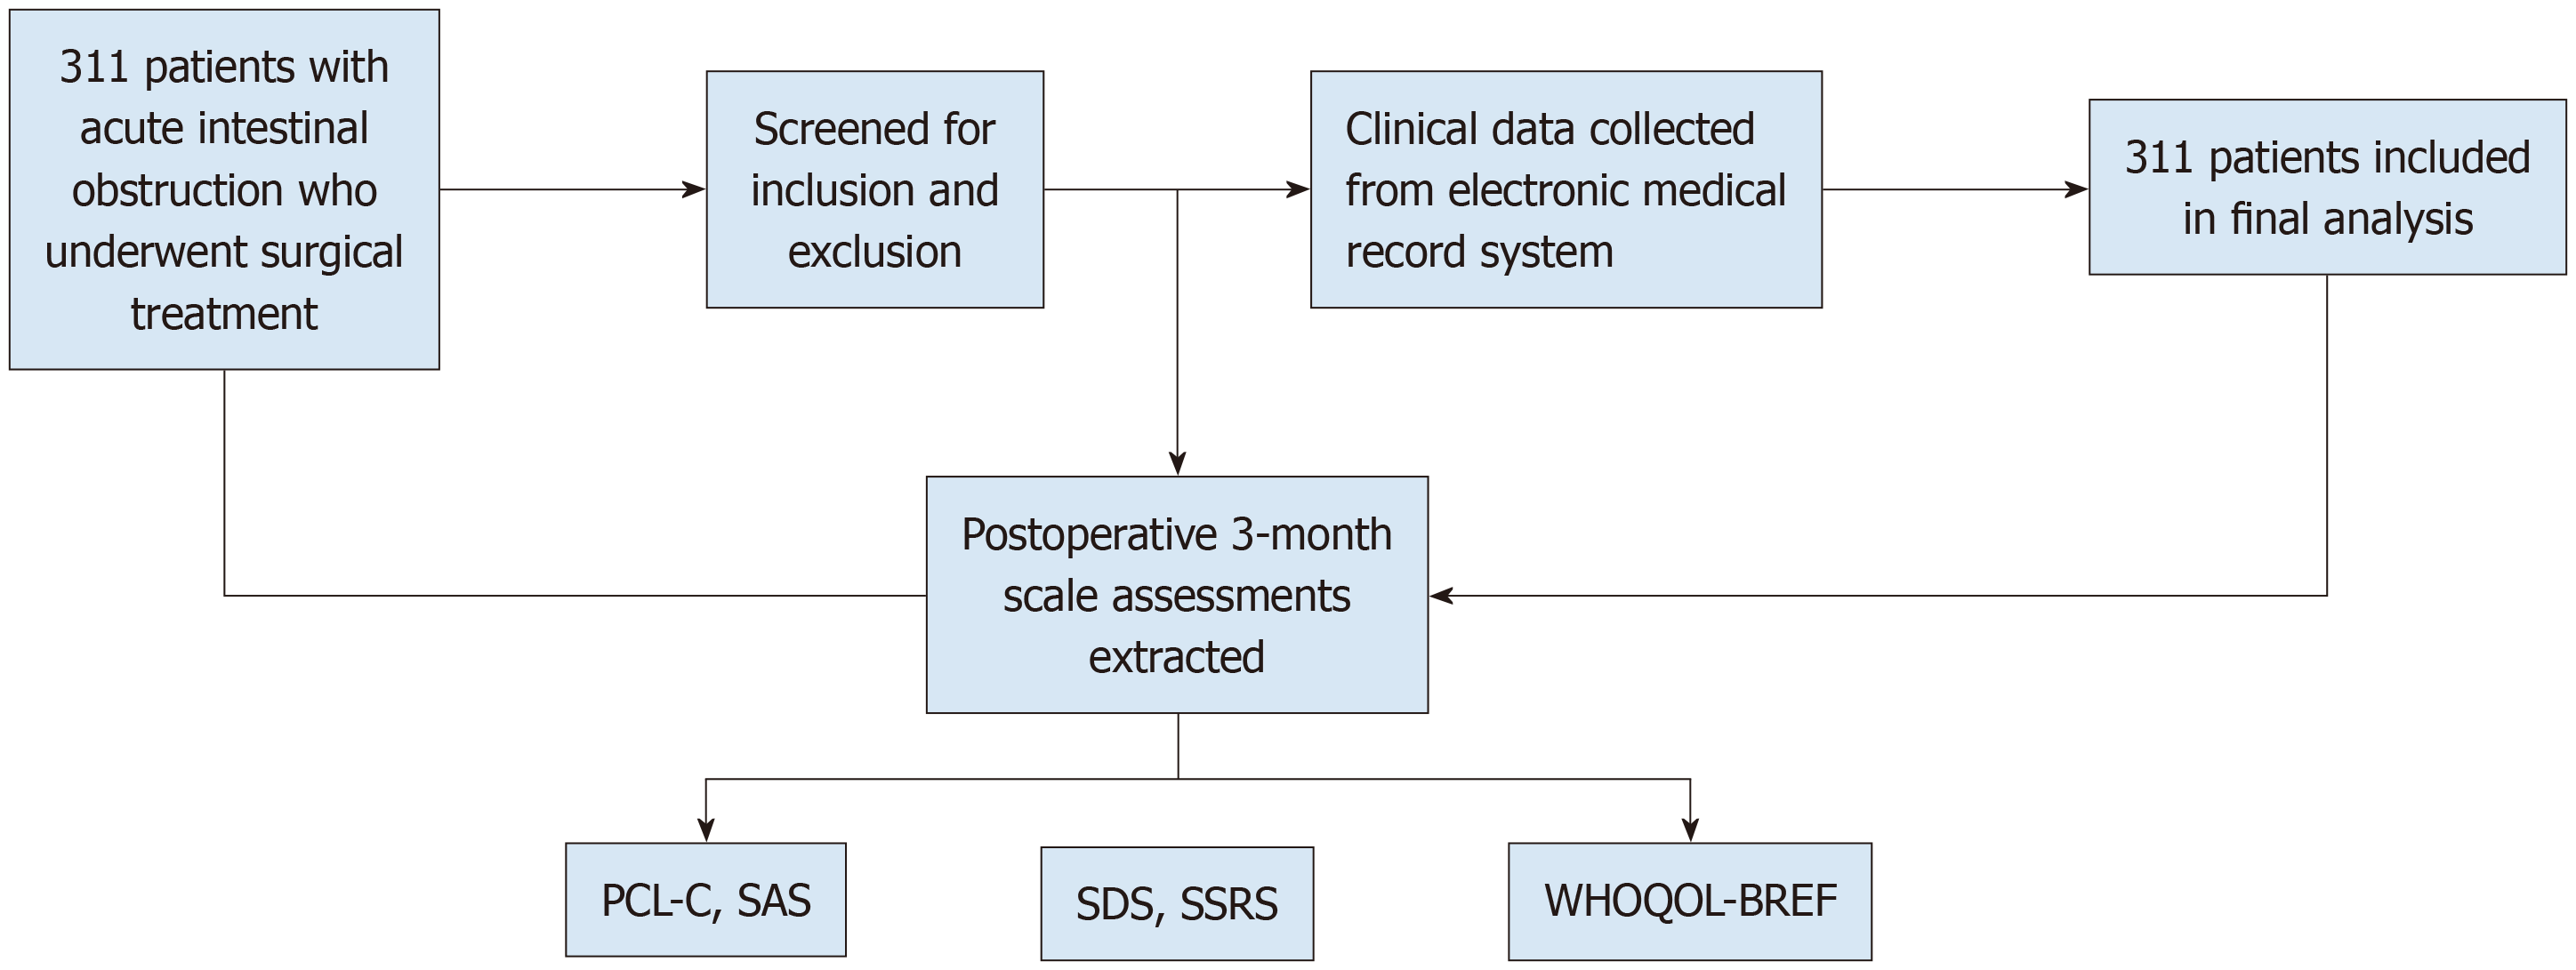
Figure 1 Patient flow diagram.
Flow diagram of patient selection, showing the number of patients who underwent surgery for acute intestinal obstruction between January 2021 and July 2025, those excluded according to the exclusion criteria (including patients who died before the 3-month assessment or were lost to follow-up), and the 311 patients with complete data included in the final analysis. PCL-C: Post-Traumatic Stress Disorder Checklist-Civilian Version; SAS: Self-rating Anxiety Scale; SDS: Self-rating Depression Scale; SSRS: Social Support Rating Scale; WHOQOL-BREF: World Health Organization Quality of Life Brief Version.
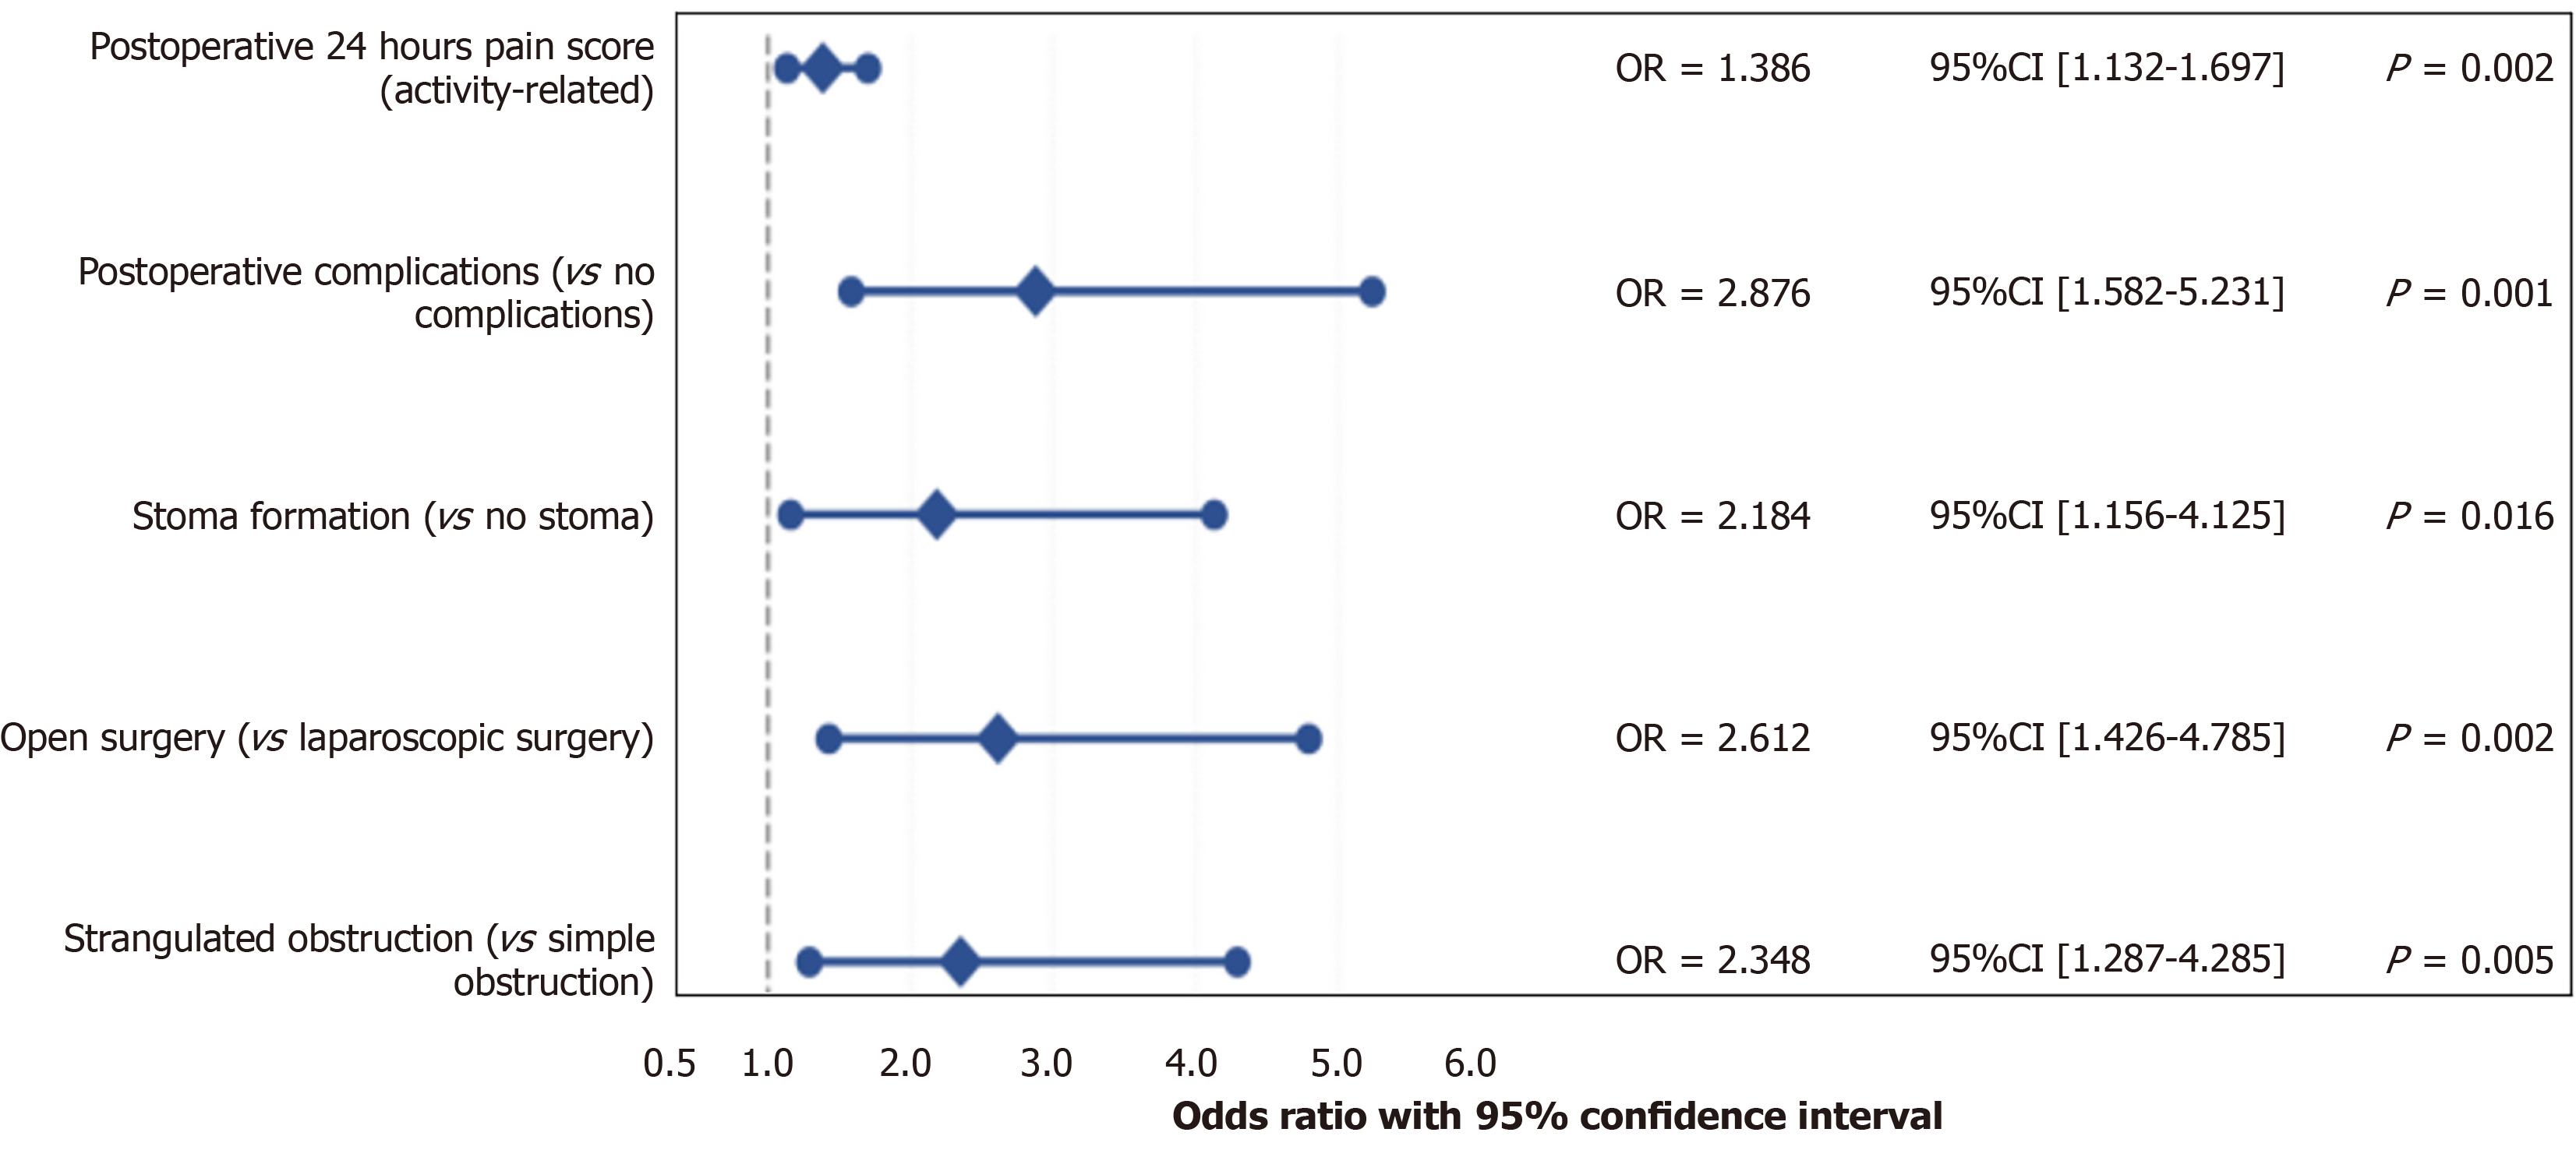
Figure 2 Forest plot of independent risk factors for post-traumatic stress symptoms in postoperative patients with acute intestinal obstruction.
Forest plot displaying odds ratios (ORs) with 95% confidence intervals for the five independent risk factors identified by multivariate logistic regression analysis. The dashed vertical line represents OR = 1.0 (no effect). All five factors—strangulated obstruction, open surgery, stoma formation, postoperative complications, and the 24-hour postoperative activity-related pain score—demonstrated statistically significant positive associations with post-traumatic stress symptoms (all P < 0.05). OR: Odds ratio; CI: Confidence interval.
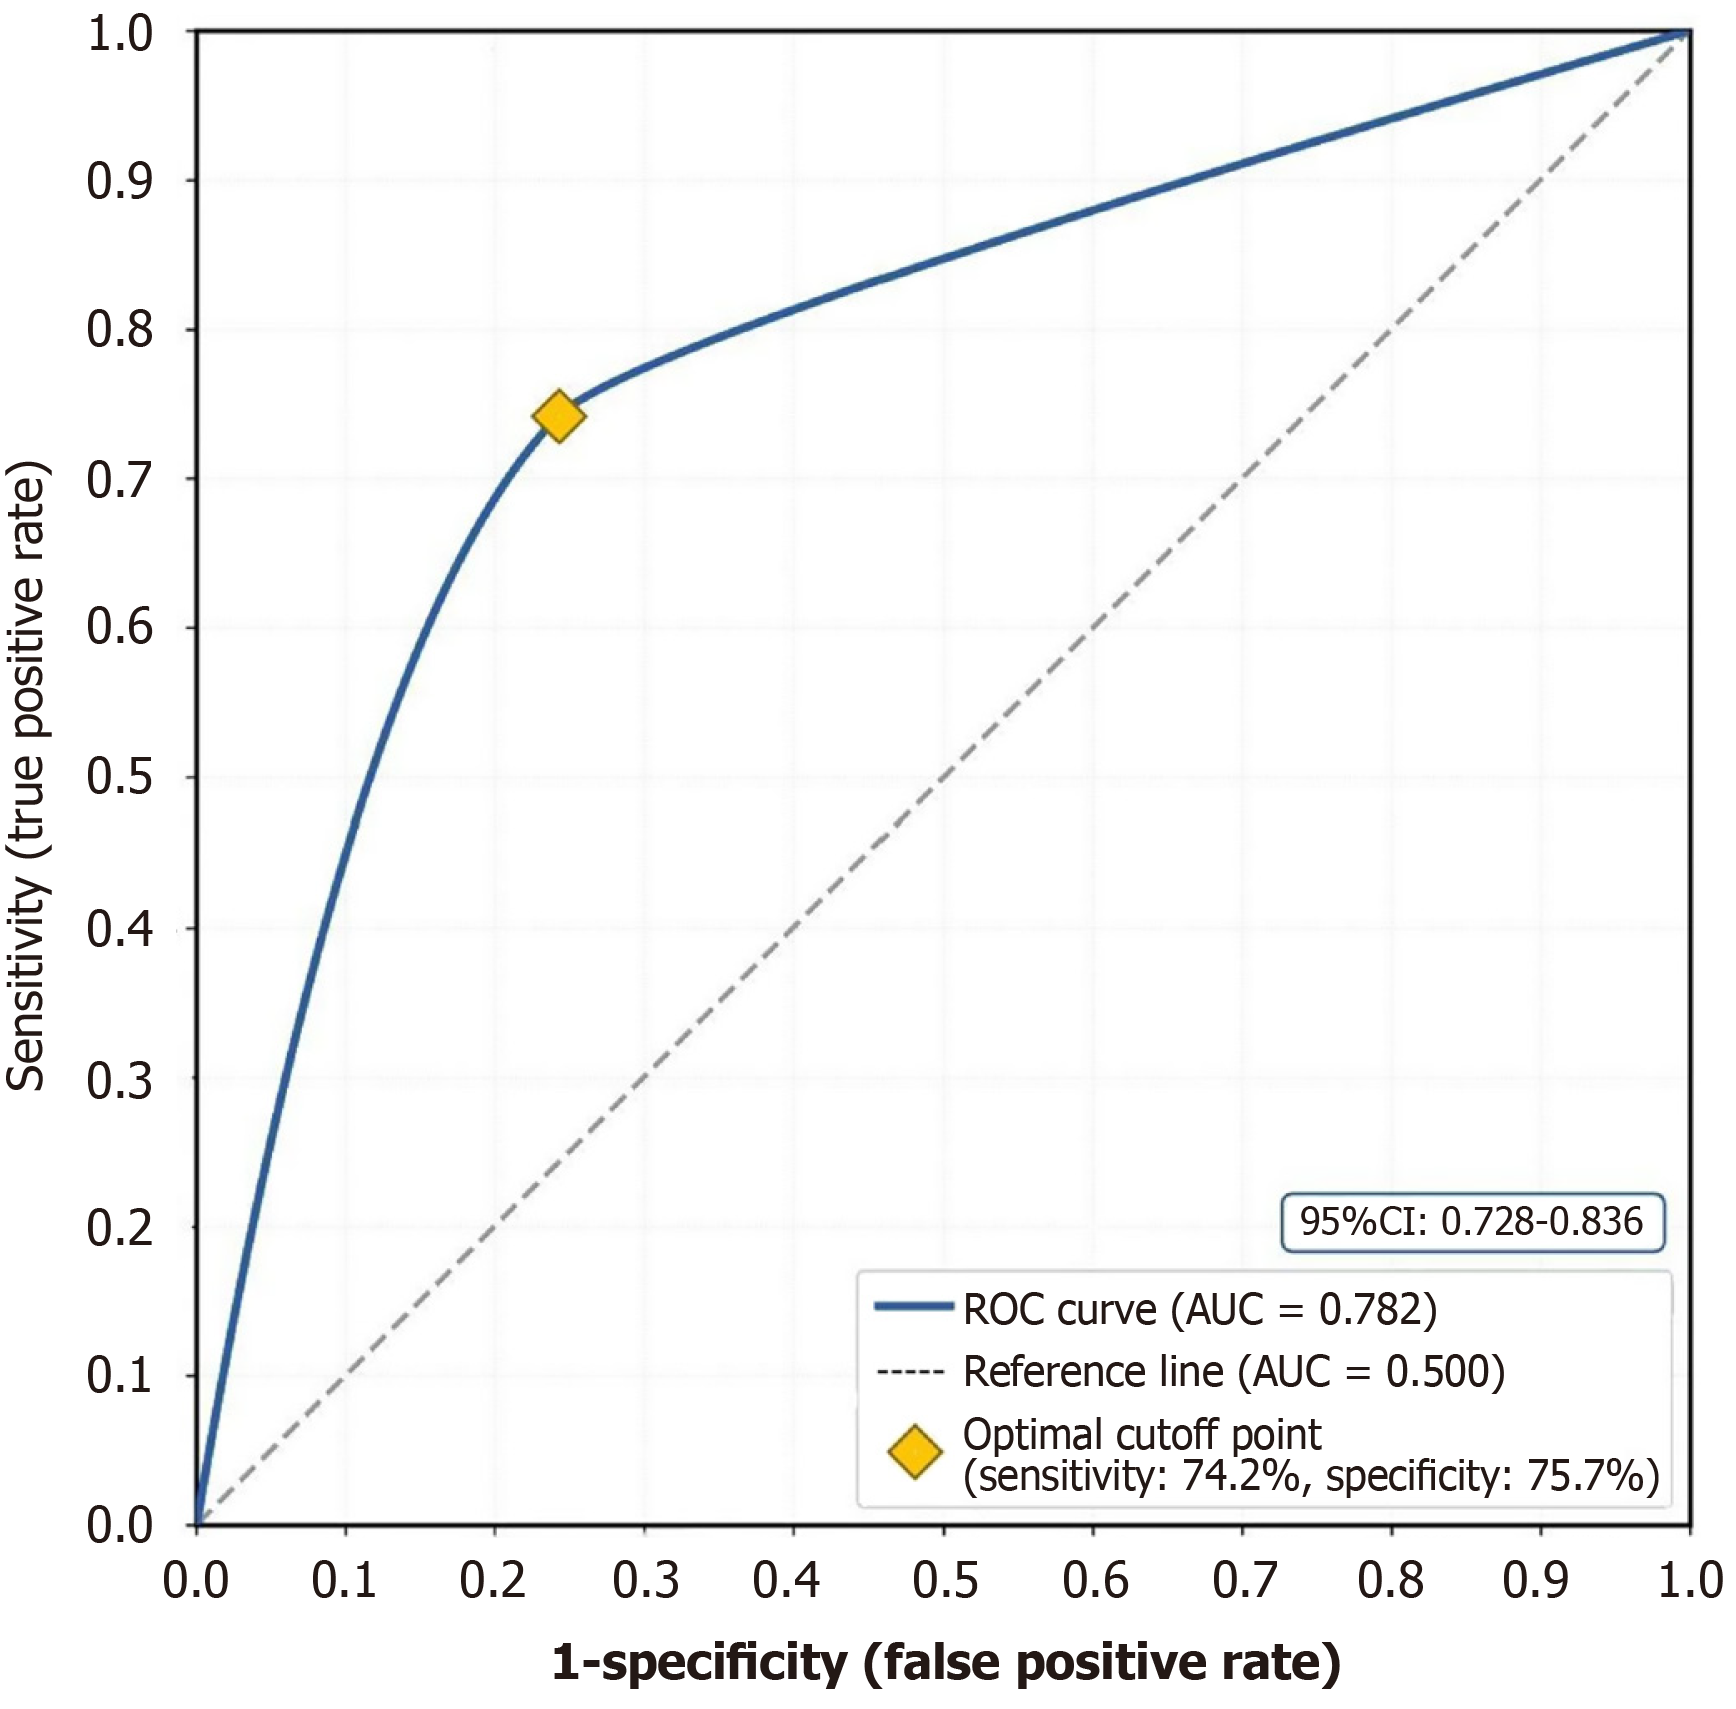
Figure 3 Receiver operating characteristic curve for post-traumatic stress symptoms prediction model in postoperative patients with acute intestinal obstruction.
Receiver operating characteristic curve illustrating the discriminatory performance of the multivariate logistic regression–based prediction model. The model achieved an area under the curve (AUC) of 0.782 [95% confidence interval (CI): 0.728-0.836], indicating moderate-to-good predictive ability. The optimal cutoff point (diamond marker), determined by maximizing the Youden index, yielded a sensitivity of 74.2% and a specificity of 75.7%. The dashed diagonal line represents the reference line (AUC = 0.500). AUC: Area under the curve; ROC: Receiver operating characteristic; CI: Confidence interval.
- Citation: Chen ZL, Yang SH, Lin ZH, Xie XM. Incidence and influencing factors of post-traumatic stress symptoms in patients after surgery for acute intestinal obstruction. World J Psychiatry 2026; 16(11): 123105
- URL: https://www.wjgnet.com/2220-3206/full/v16/i11/123105.htm
- DOI: https://dx.doi.org/10.5498/wjp.123105