
















Copyright: ©Author(s) 2026.
World J Psychiatry. Oct 19, 2026; 16(10): 121314
Published online Oct 19, 2026. doi: 10.5498/wjp.121314
Published online Oct 19, 2026. doi: 10.5498/wjp.121314
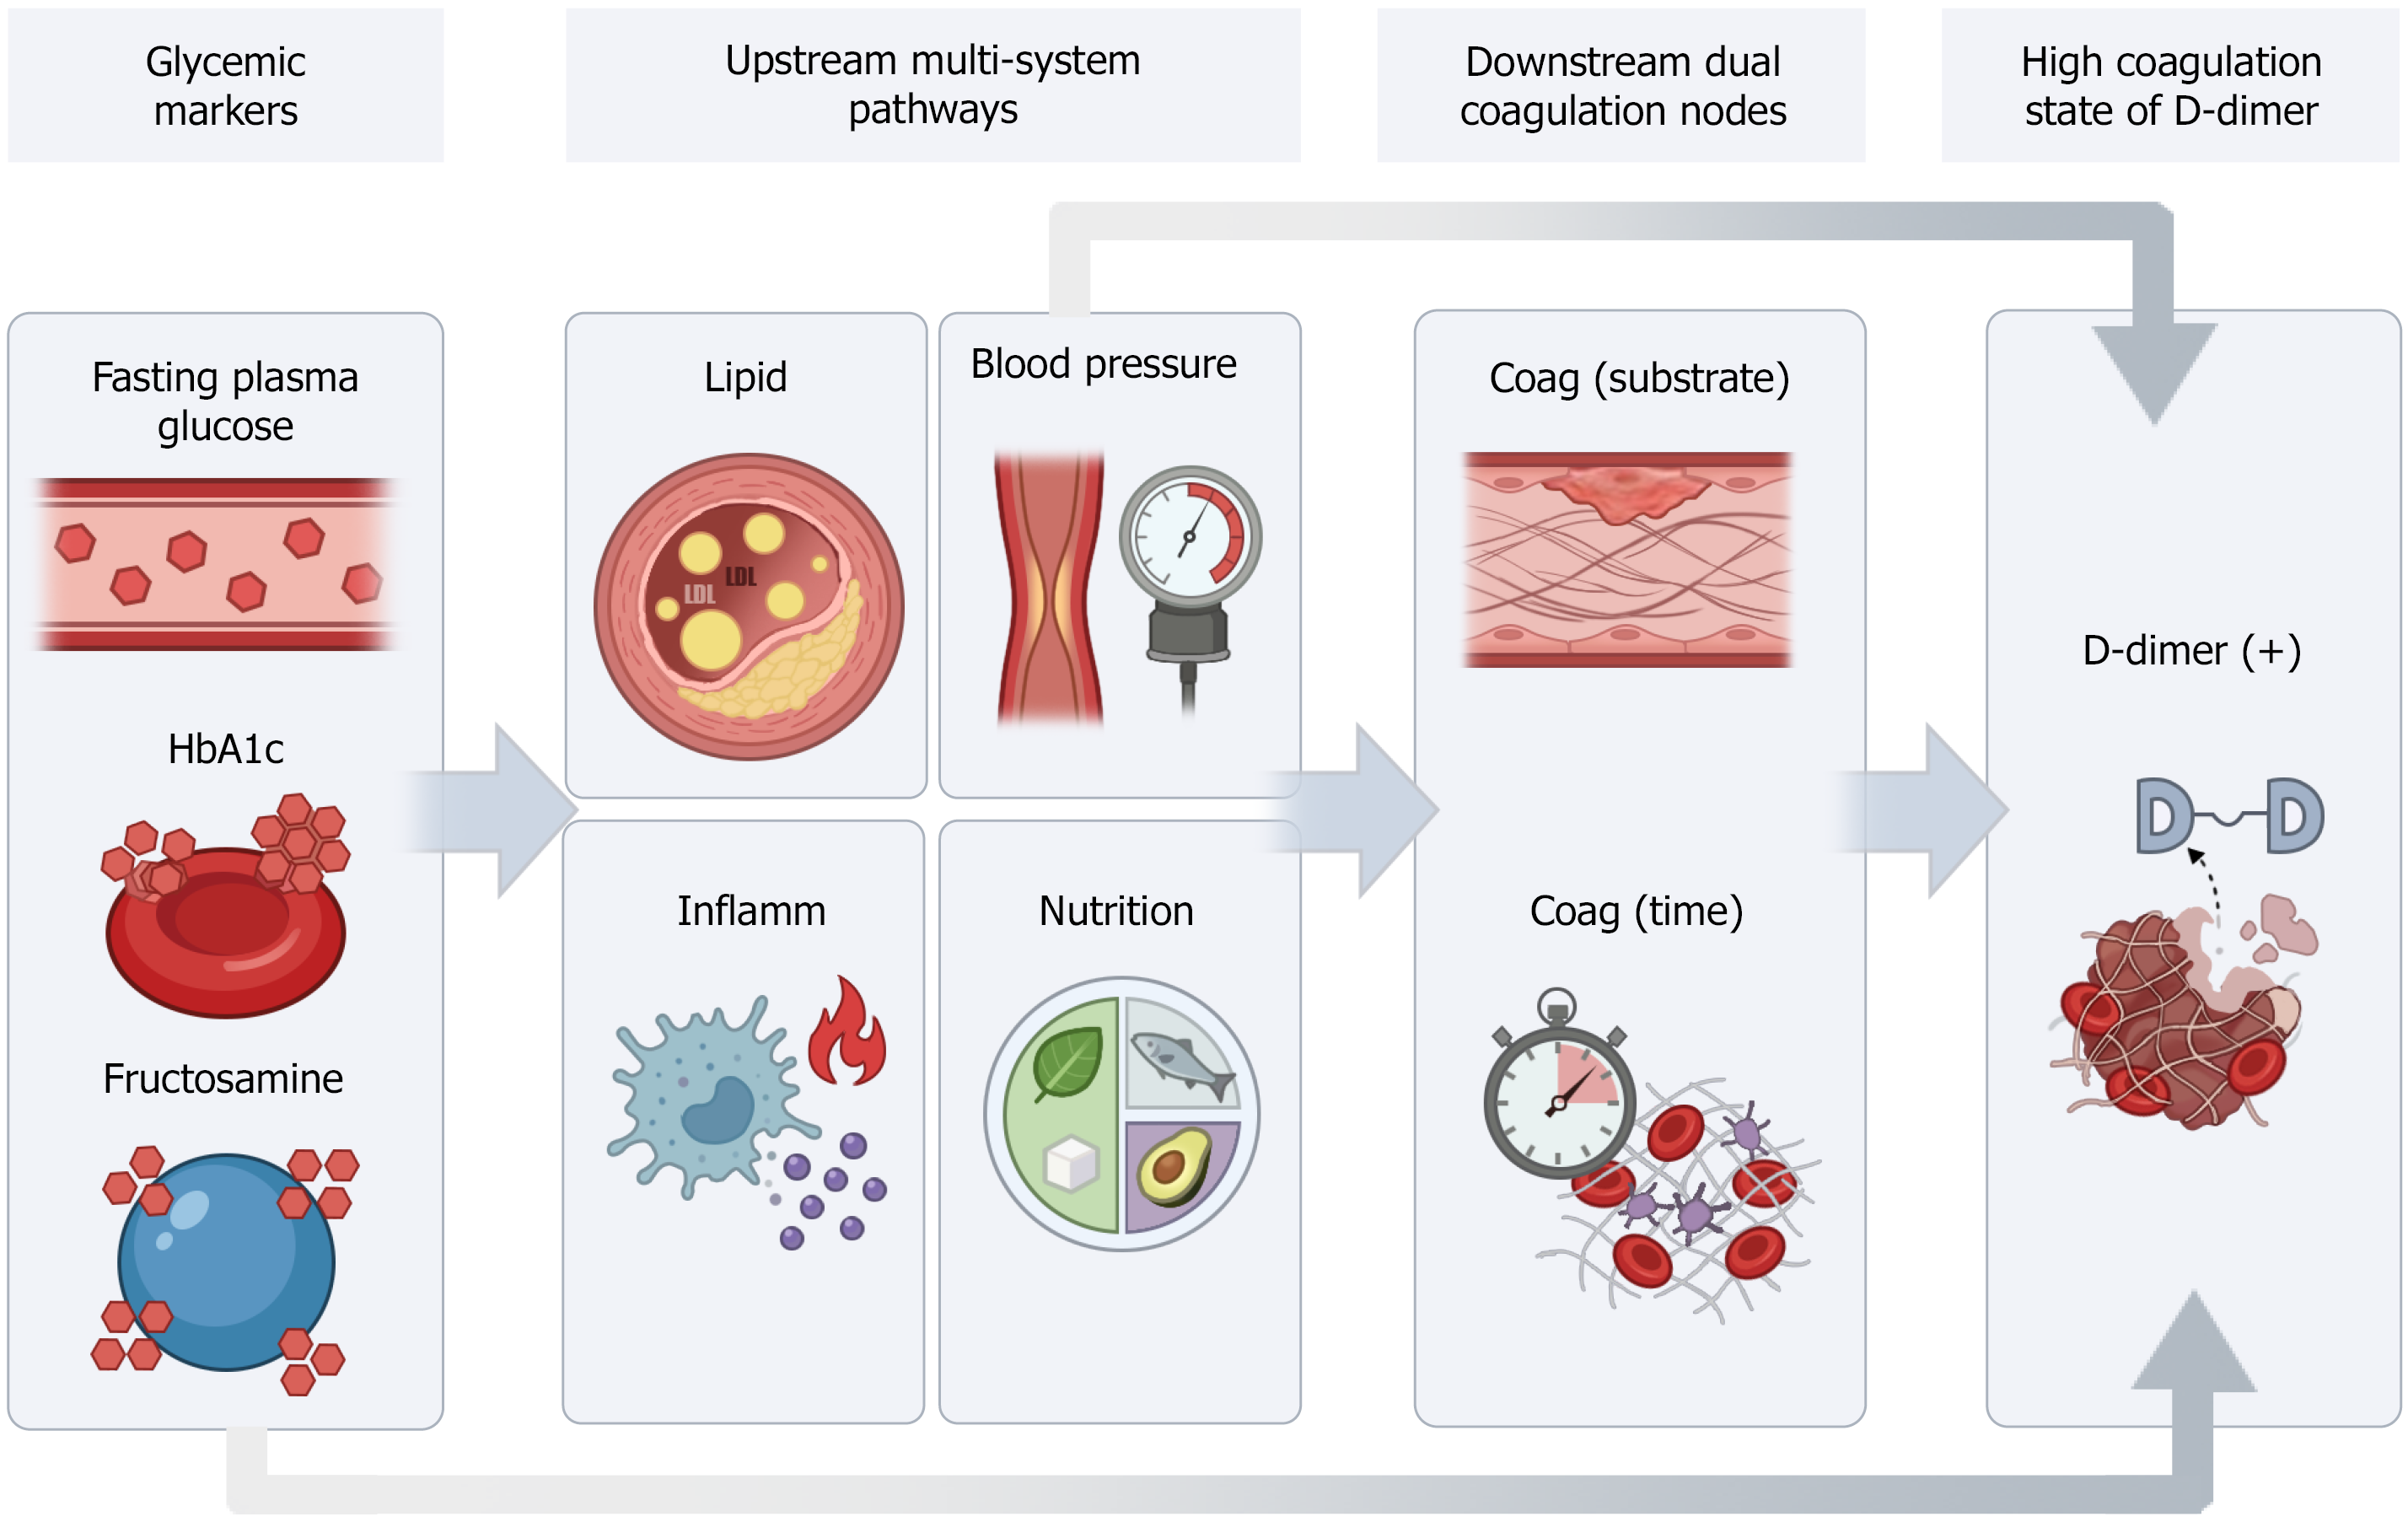
Figure 1 Multisystem pathway model linking three glycemic indicators to D-dimer hypercoagulability in psychiatric inpatients.
Three mutually adjusted glycemic indicators (fasting plasma glucose, fructosamine, and glycated hemoglobin) were modeled as competing exposures influencing four upstream multi-system pathways composites (lipid, blood pressure, inflammation, and nutrition), which in turn acted through two proximal coagulation mediators-Coag (Substrate) and Coag (Time)-to affect hypercoagulable status (D-dimer > 0.5 μg/mL). BP: Blood pressure; FA: Fructosamine; FPG: Fasting plasma glucose; HbA1c: Glycated hemoglobin.
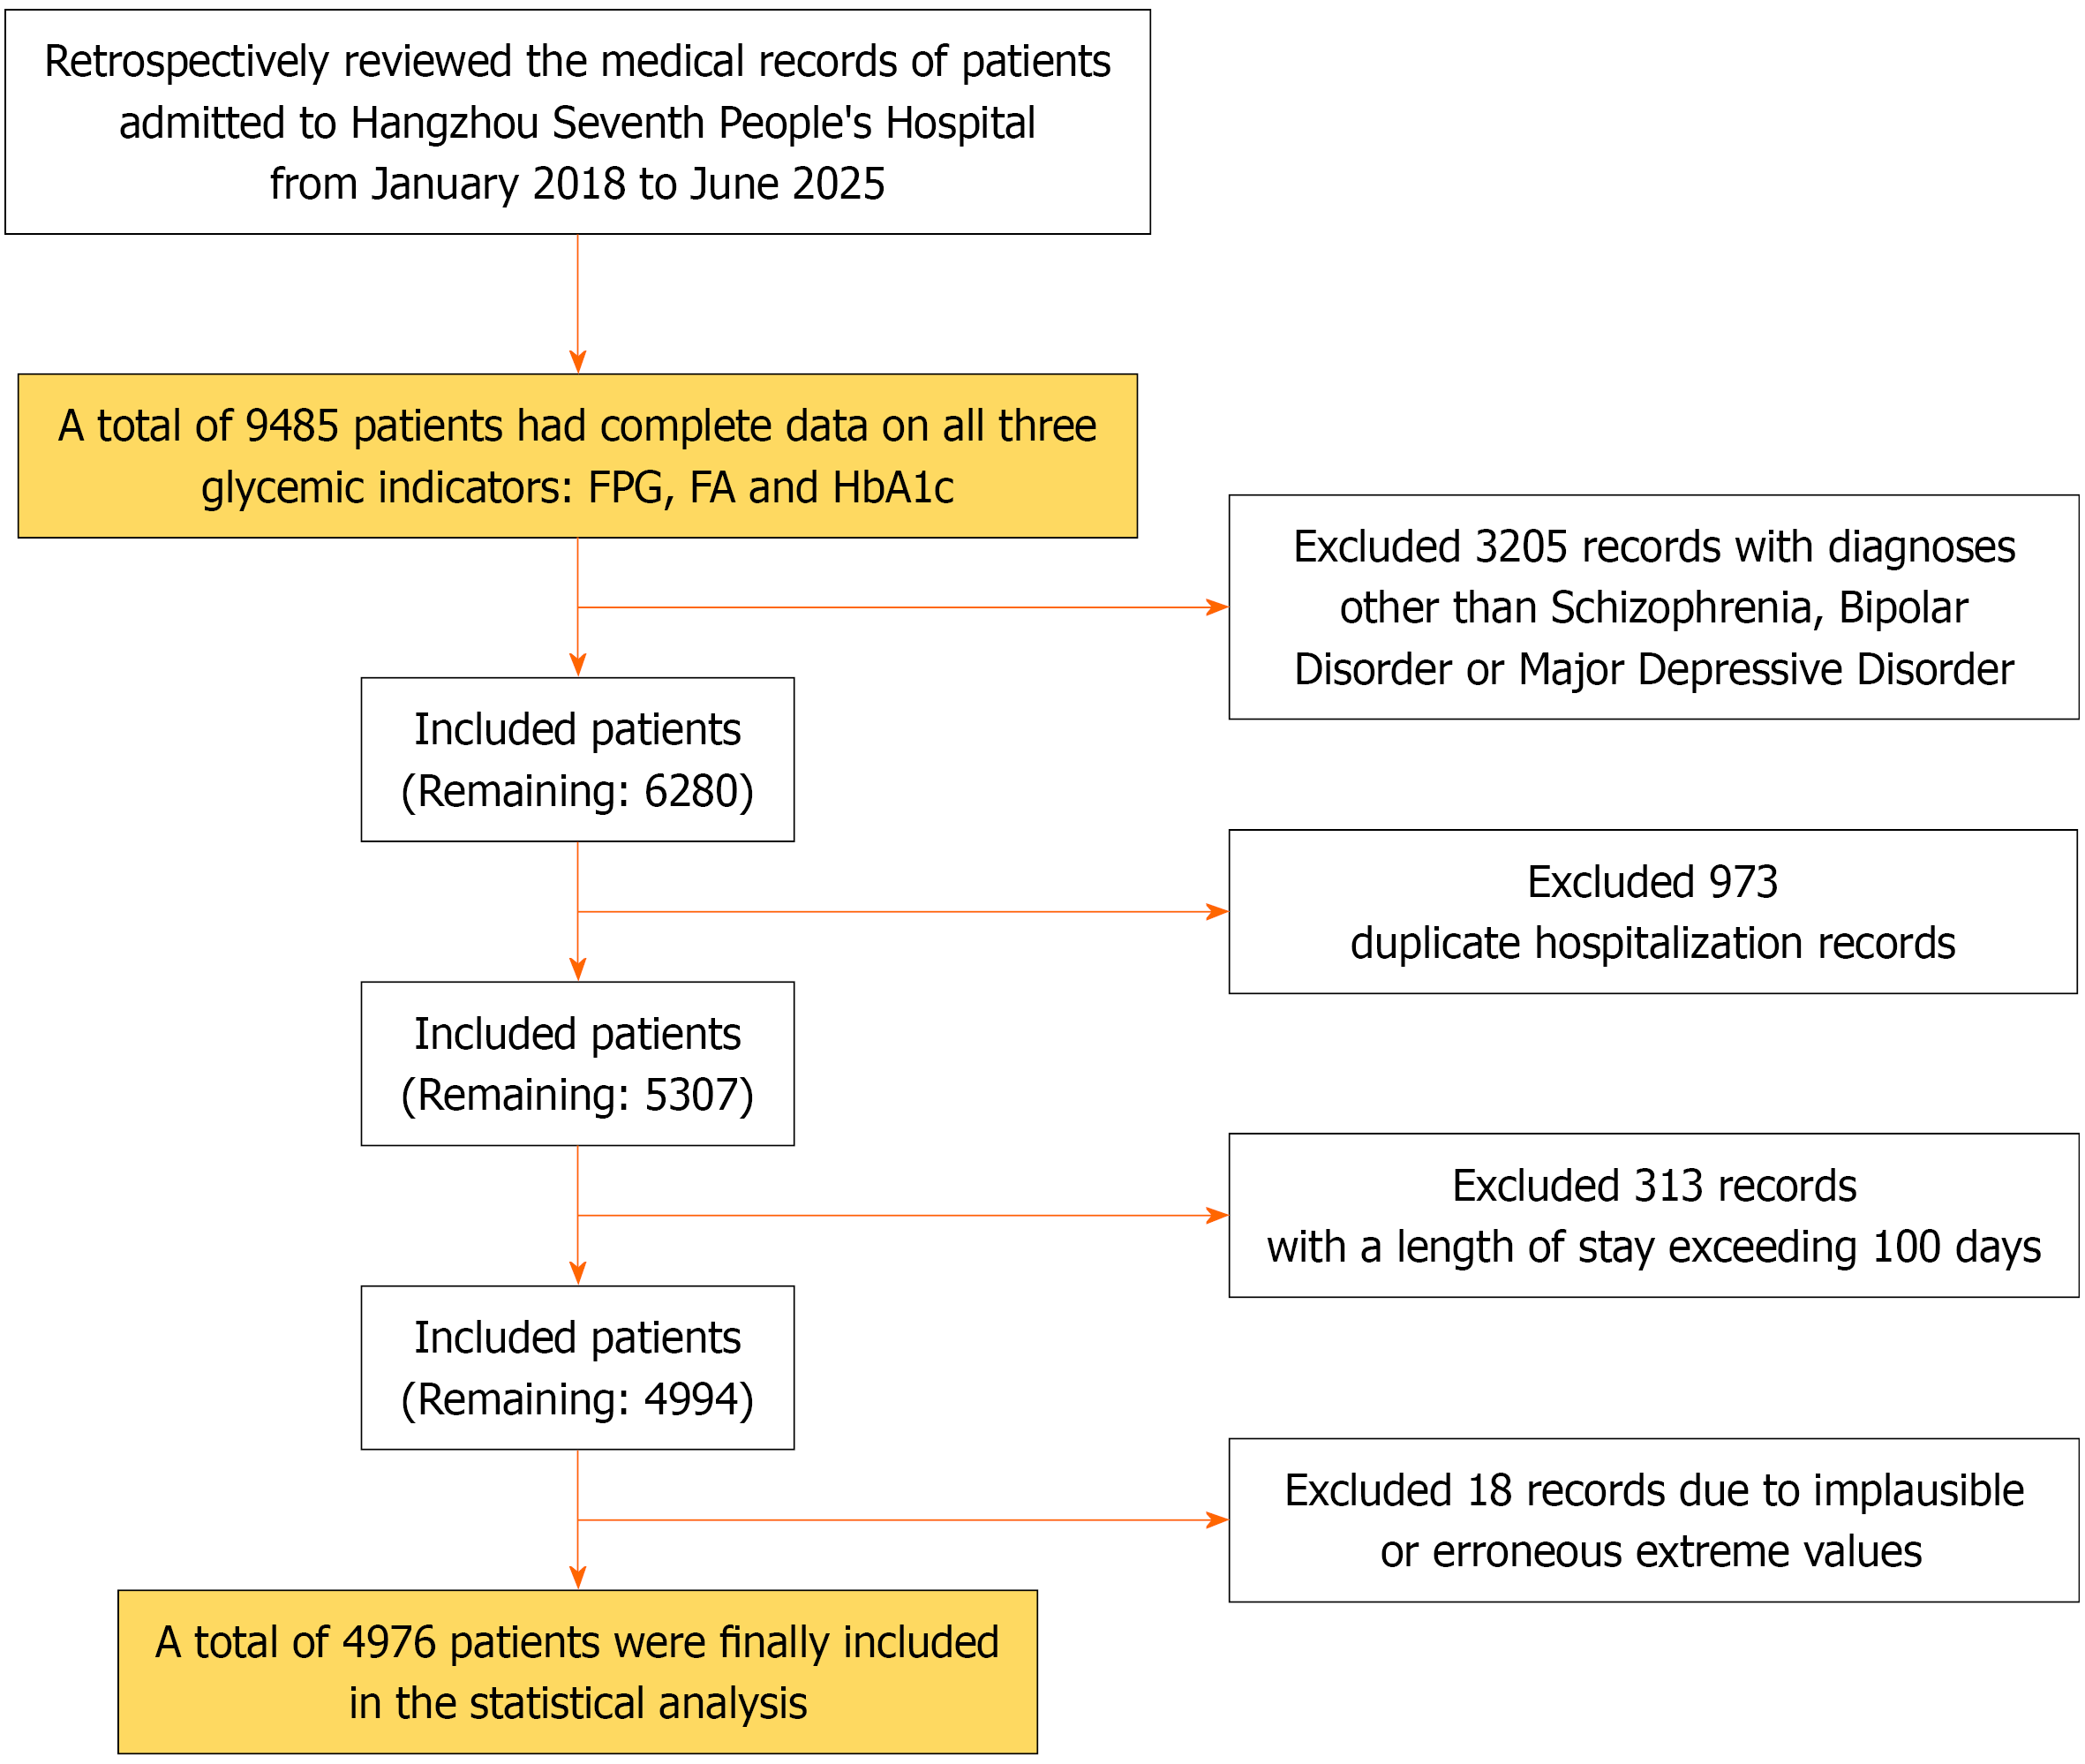
Figure 2 Flow diagram of patient selection.
This study reviewed the electronic medical records of patients admitted to Hangzhou Seventh People’s Hospital between January 2018 and June 2025. Patients with complete data on all three glycemic indicators - fasting plasma glucose, fructosamine, and glycated hemoglobin - were initially identified. Records with diagnoses other than schizophrenia, bipolar disorder, or major depressive disorder were excluded. To ensure independent observations and data quality, duplicate hospitalization records, admissions with an excessively long length of stay (> 100 days), and records containing implausible or erroneous extreme values were further excluded. The final analytical cohort consisted of 4976 patients. FA: Fructosamine; FPG: Fasting plasma glucose; HbA1c: Glycated hemoglobin.
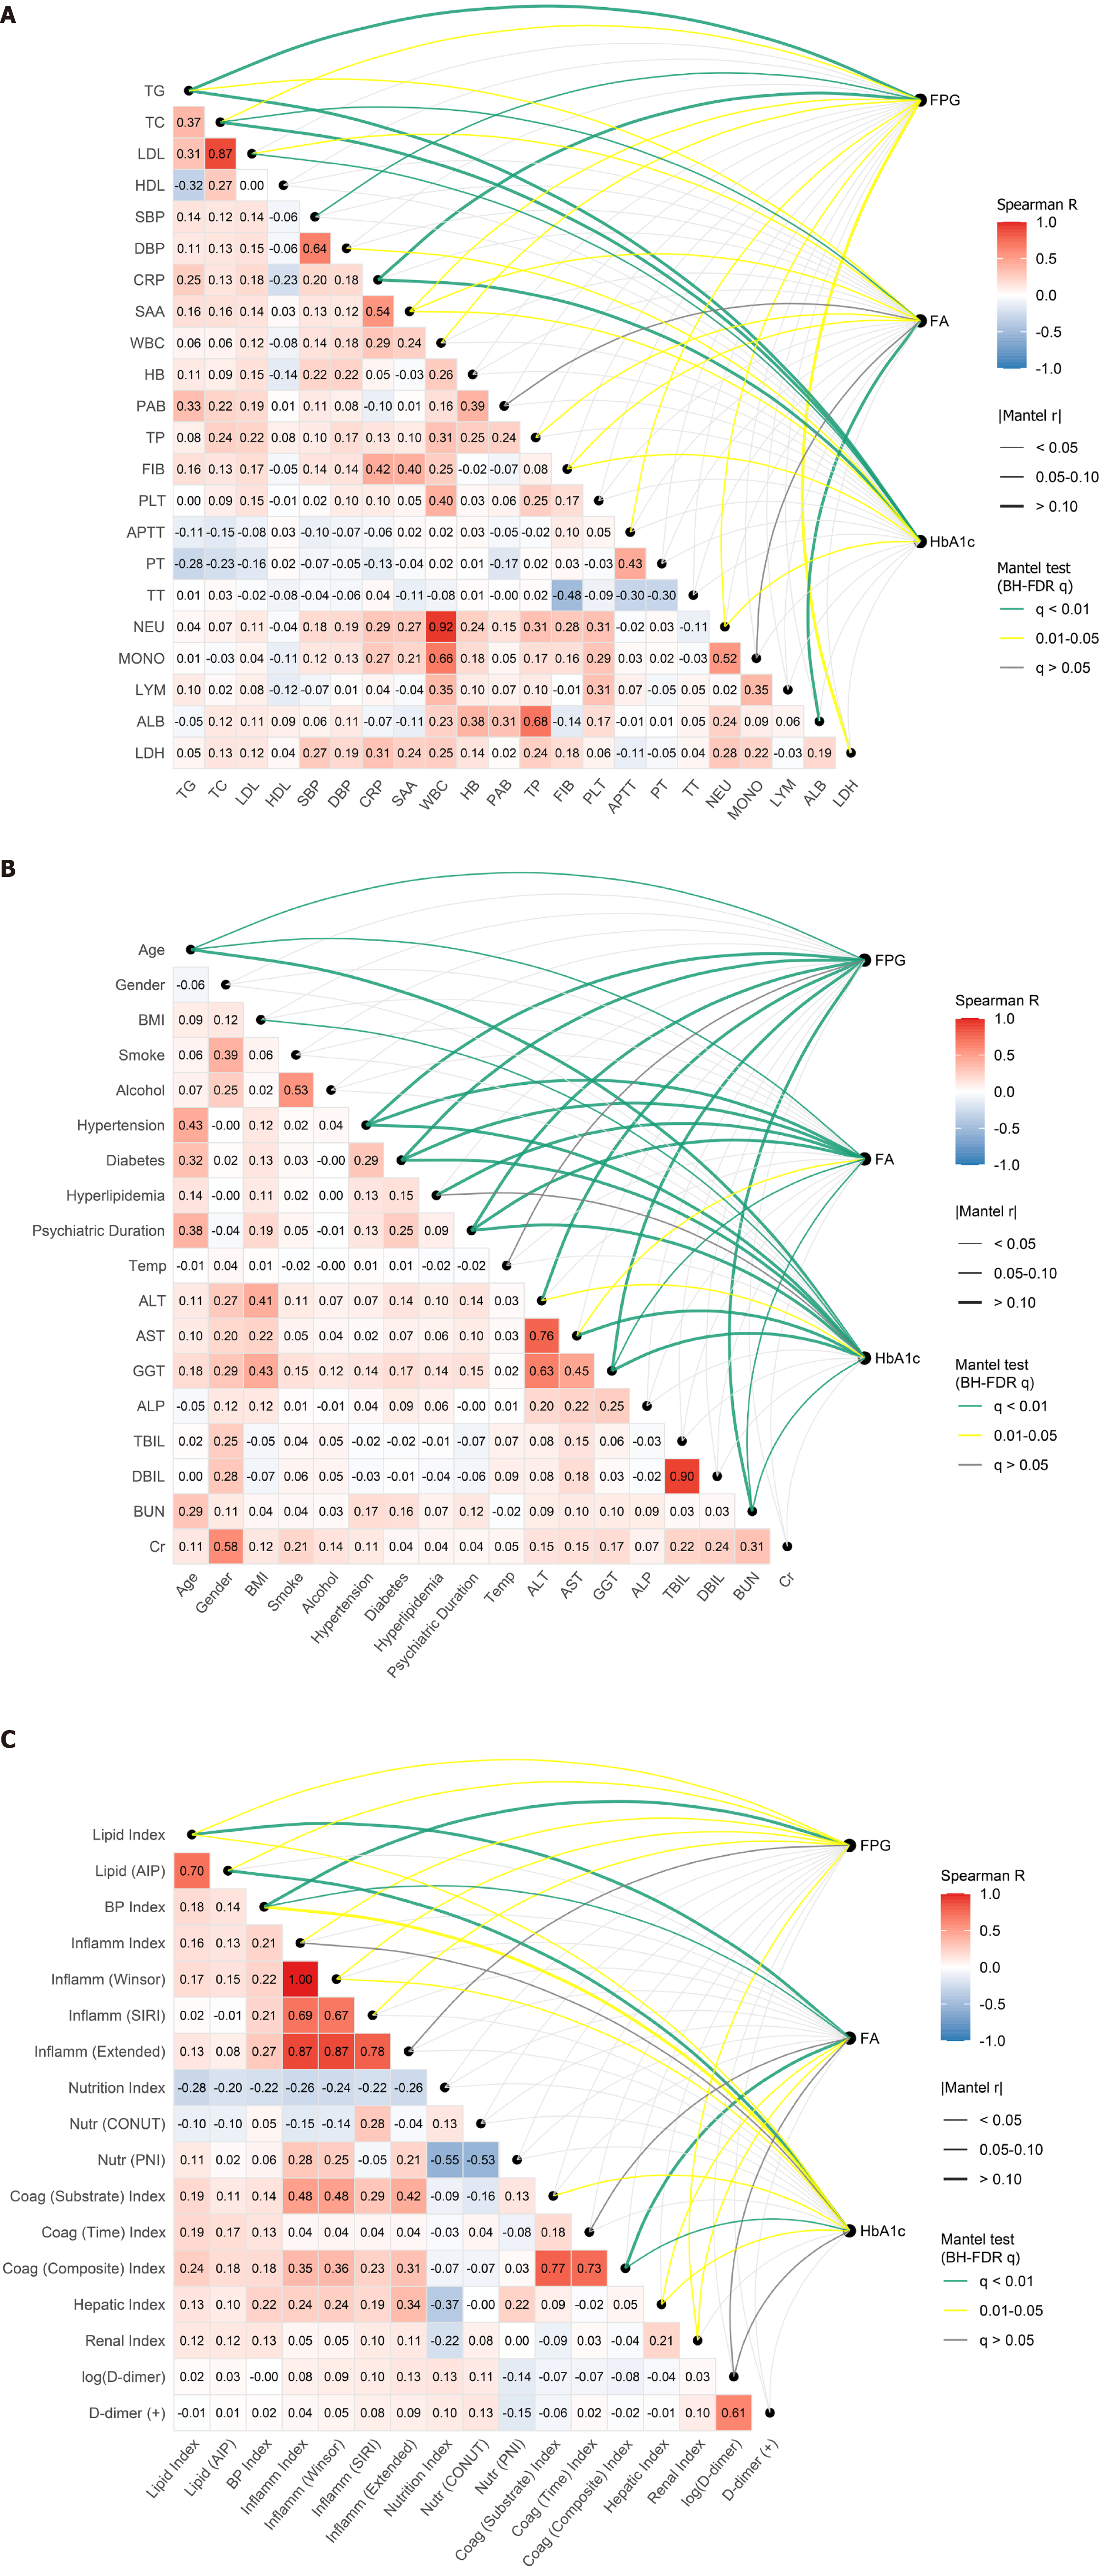
Figure 3 Associations between glycemic markers and multisystem pathway features in the overall cohort and diagnostic subgroups of psychiatric inpatients.
A: Laboratory biomarkers; B: Covariate features; C: Pathway-level indices. A-C summarize the relationships between three glycemic indicators - fasting plasma glucose, fructosamine, and glycated hemoglobin - and multilevel biological features spanning metabolic, cardiovascular, inflammatory, nutritional, and coagulation domains. In each panel, lower-triangle heatmaps display pairwise Spearman correlation coefficients among observed variables or composite pathway indices (red indicates positive correlations and blue indicates negative correlations, with numeric coefficients shown in each cell). Curved links on the right represent associations between each glycemic marker and the corresponding feature matrix assessed using Mantel tests (maximum matrix size constrained to n = 300 and significance evaluated using 999 permutations). Line thickness reflects the absolute Mantel correlation coefficient (|r|), and link color denotes statistical significance after Benjamini-Hochberg false discovery rate correction: Green, q < 0.01; yellow, q = 0.01-0.05; grey, q ≥ 0.05. A focuses on laboratory biomarkers constituting the composite pathway indices or their sensitivity-analysis components, including markers related to lipid metabolism, blood pressure, inflammation, nutritional status, and coagulation function. B presents correlations with covariate features incorporated in the structural models, including demographic characteristics, lifestyle factors, clinical comorbidities, psychiatric illness duration, body temperature status, and hepatic and renal function indicators. C visualizes pathway-level composite indices aligned with the structural modeling framework, including lipid, blood pressure, inflammatory, nutritional, hepatic, renal, and coagulation pathway constructs, together with downstream coagulation dimensions - coagulation substrate and coagulation time/function - as well as D-dimer outcomes. Visually, the heatmaps show clustered correlation patterns within biologically related domains, with relatively stronger intra-domain correlations among laboratory biomarkers (A) and more heterogeneous correlation structures among covariate features (B) and pathway-level composite indices (C).
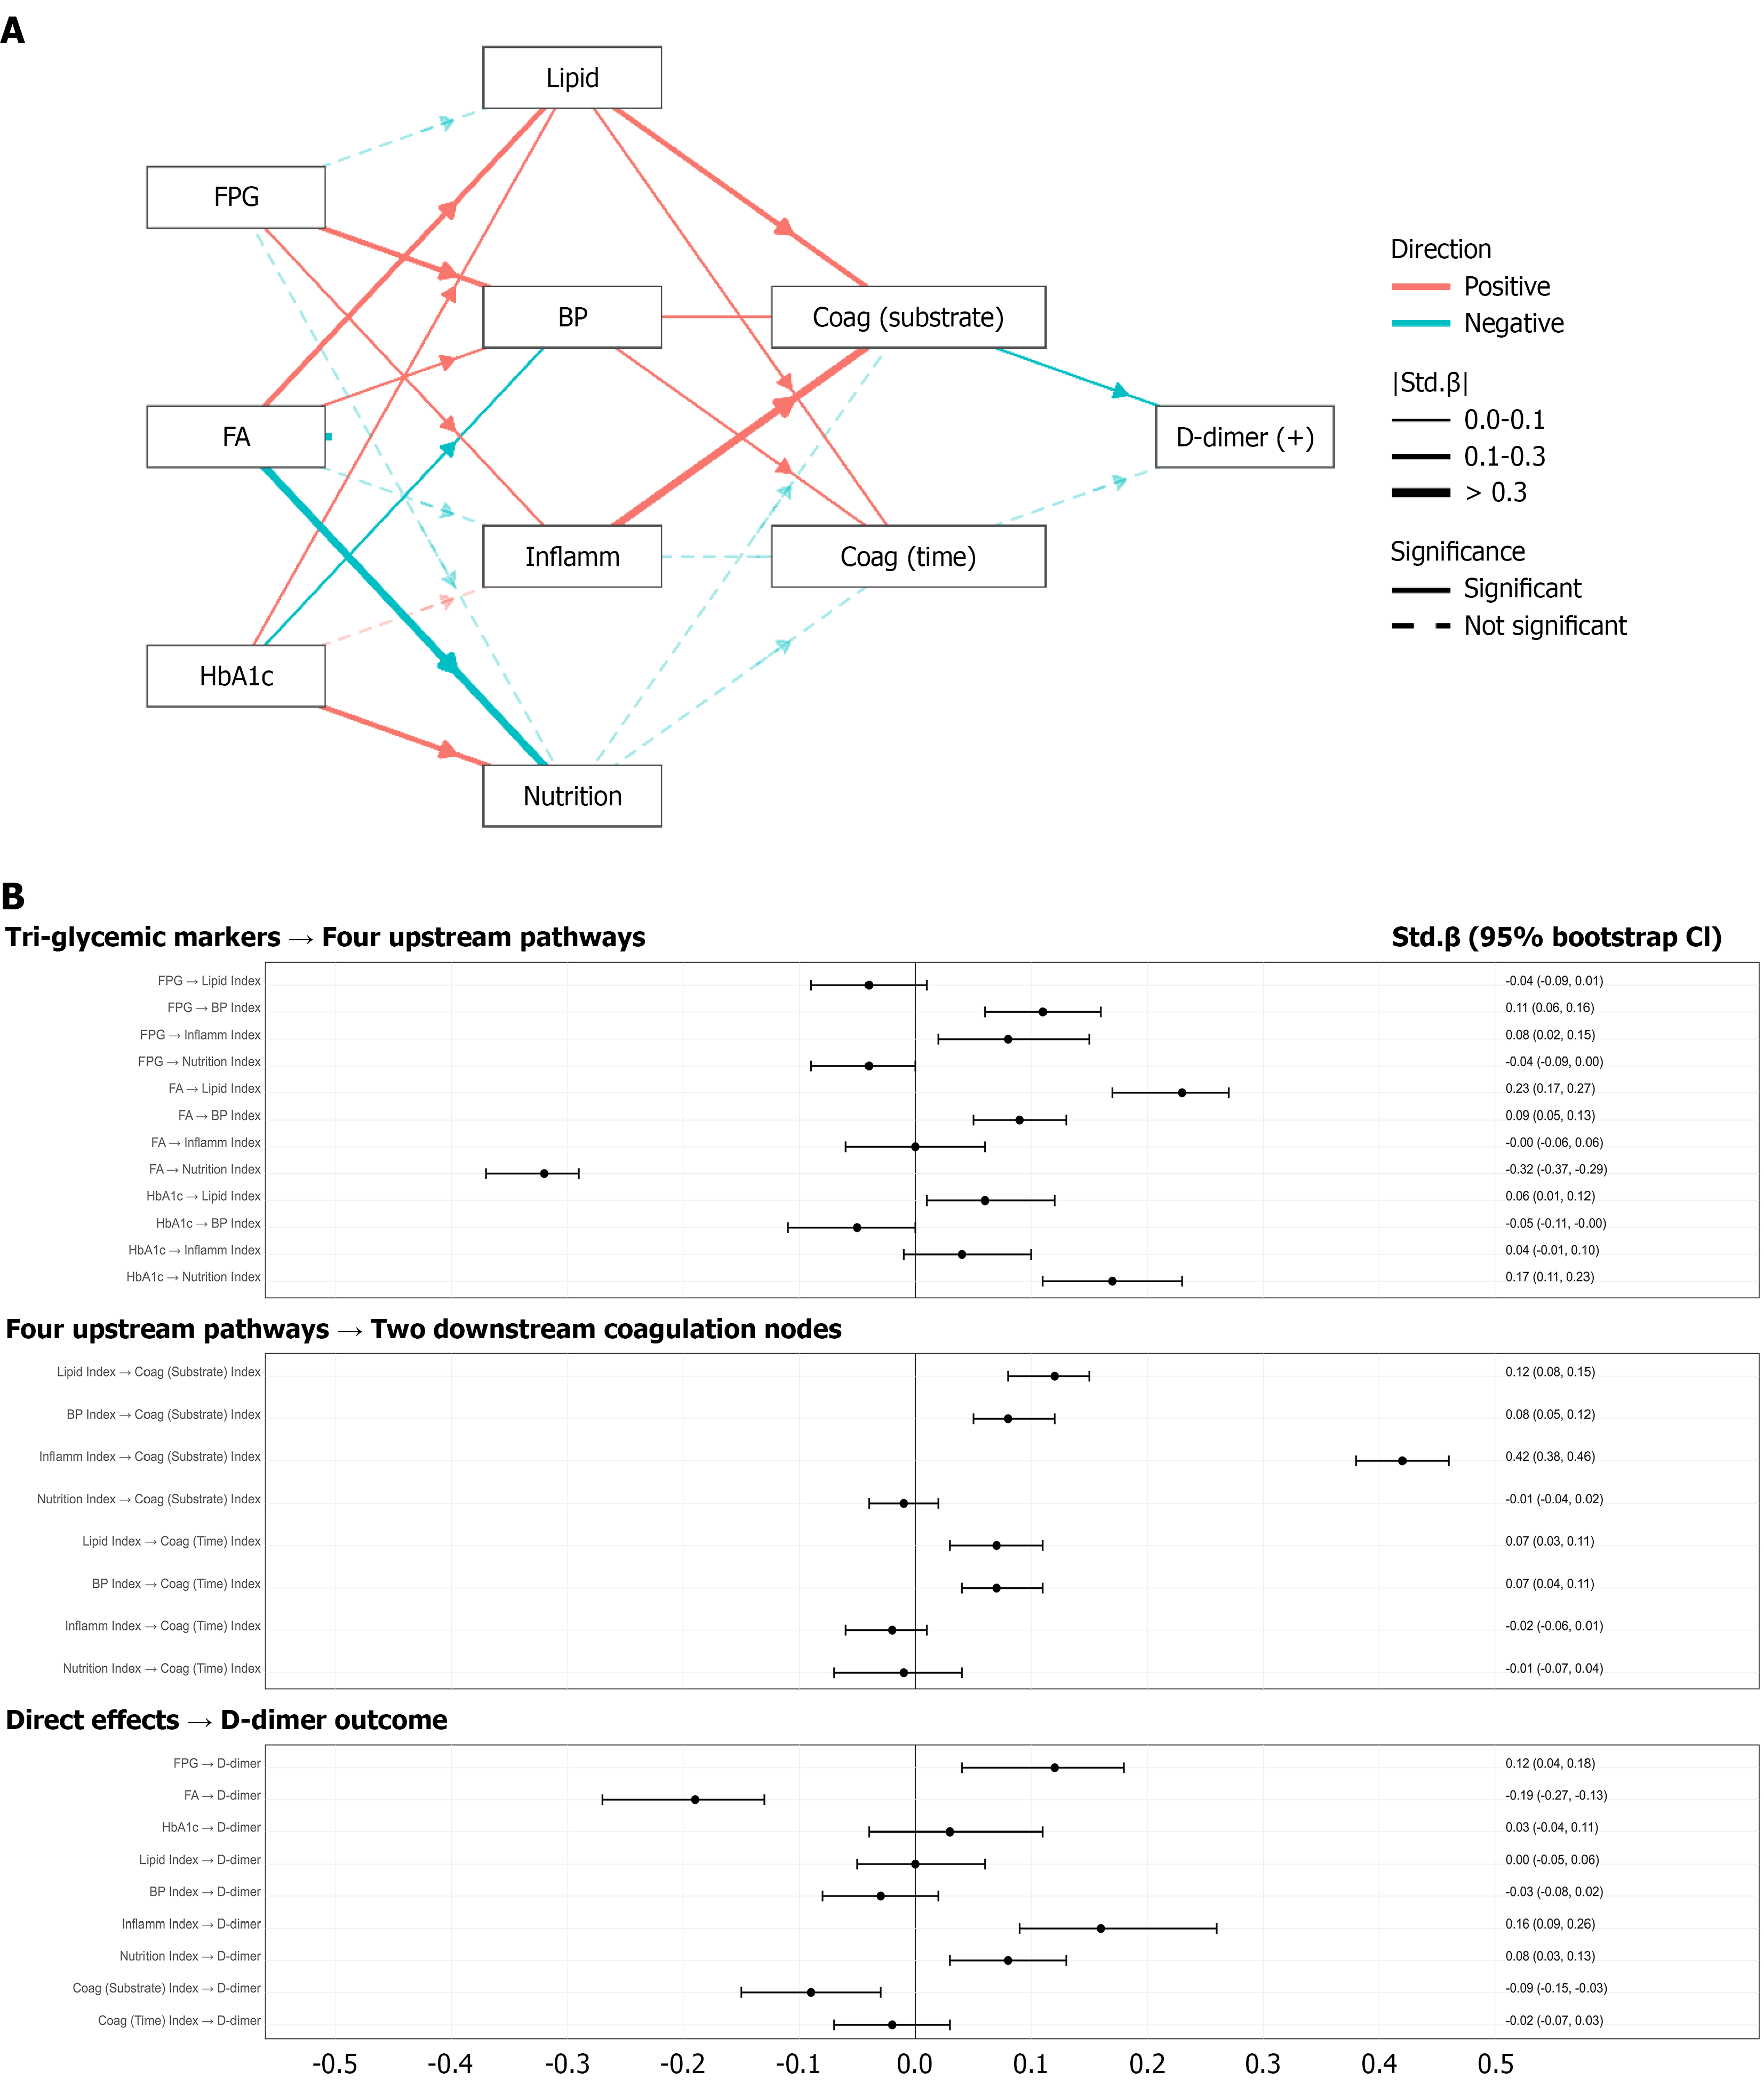
Figure 4 Overview of the main serial structural equation model pathways and standardized bootstrap-estimated effects on D-dimer outcomes.
A: Main serial structural equation modeling pathways; B: Bootstrap-estimated effects. The left (A) depicts the estimated serial structural equation modeling pathways linking three glycemic indicators - fasting plasma glucose, fructosamine, and glycated hemoglobin - to D-dimer outcomes in the main model. Glycemic indicators are modeled to relate to D-dimer through four upstream pathway-level indices (lipid index, blood pressure index, inflammation index, and nutrition index) and two downstream coagulation-related nodes capturing complementary aspects of hemostasis (coagulation substrate index and coagulation time index). Red arrows indicate positive standardized associations and blue arrows indicate negative associations. Solid lines denote statistically significant paths, whereas dashed lines indicate non-significant paths. Line width reflects the magnitude of the standardized coefficient (|Std.β|). Collectively, the structural component explains a non-trivial proportion of variance (R2) in key endogenous nodes: Lipid index = 0.207, blood pressure index = 0.186, inflammation index = 0.084, nutrition index = 0.291, coagulation substrate index = 0.265, coagulation time/function index = 0.048, and D-dimer = 0.184. The right (B) summarizes the corresponding standardized path estimates using forest plots with bootstrap-derived 95% confidence intervals [Std.β (95% confidence interval), 500 bootstrap resamples]. Effects are organized into three sequential layers aligned with the hypothesized serial pathway structure: (1) Glycemic indicators → upstream pathway indices; (2) Upstream pathway indices → downstream coagulation nodes; and (3) Direct effects on D-dimer. Points represent standardized coefficients, horizontal bars indicate bootstrap-derived 95% confidence intervals, and the vertical reference line denotes the null effect (Std.β = 0). Together, these combined visualization provides an integrated overview of the modeled multisystem associations linking glycemic markers, intermediate physiological pathways, and D-dimer outcomes within the main structural equation modeling framework. FA: Fructosamine; FPG: Fasting plasma glucose; HbA1c: Glycated hemoglobin; BP: Blood pressure; CI: Confidence interval.
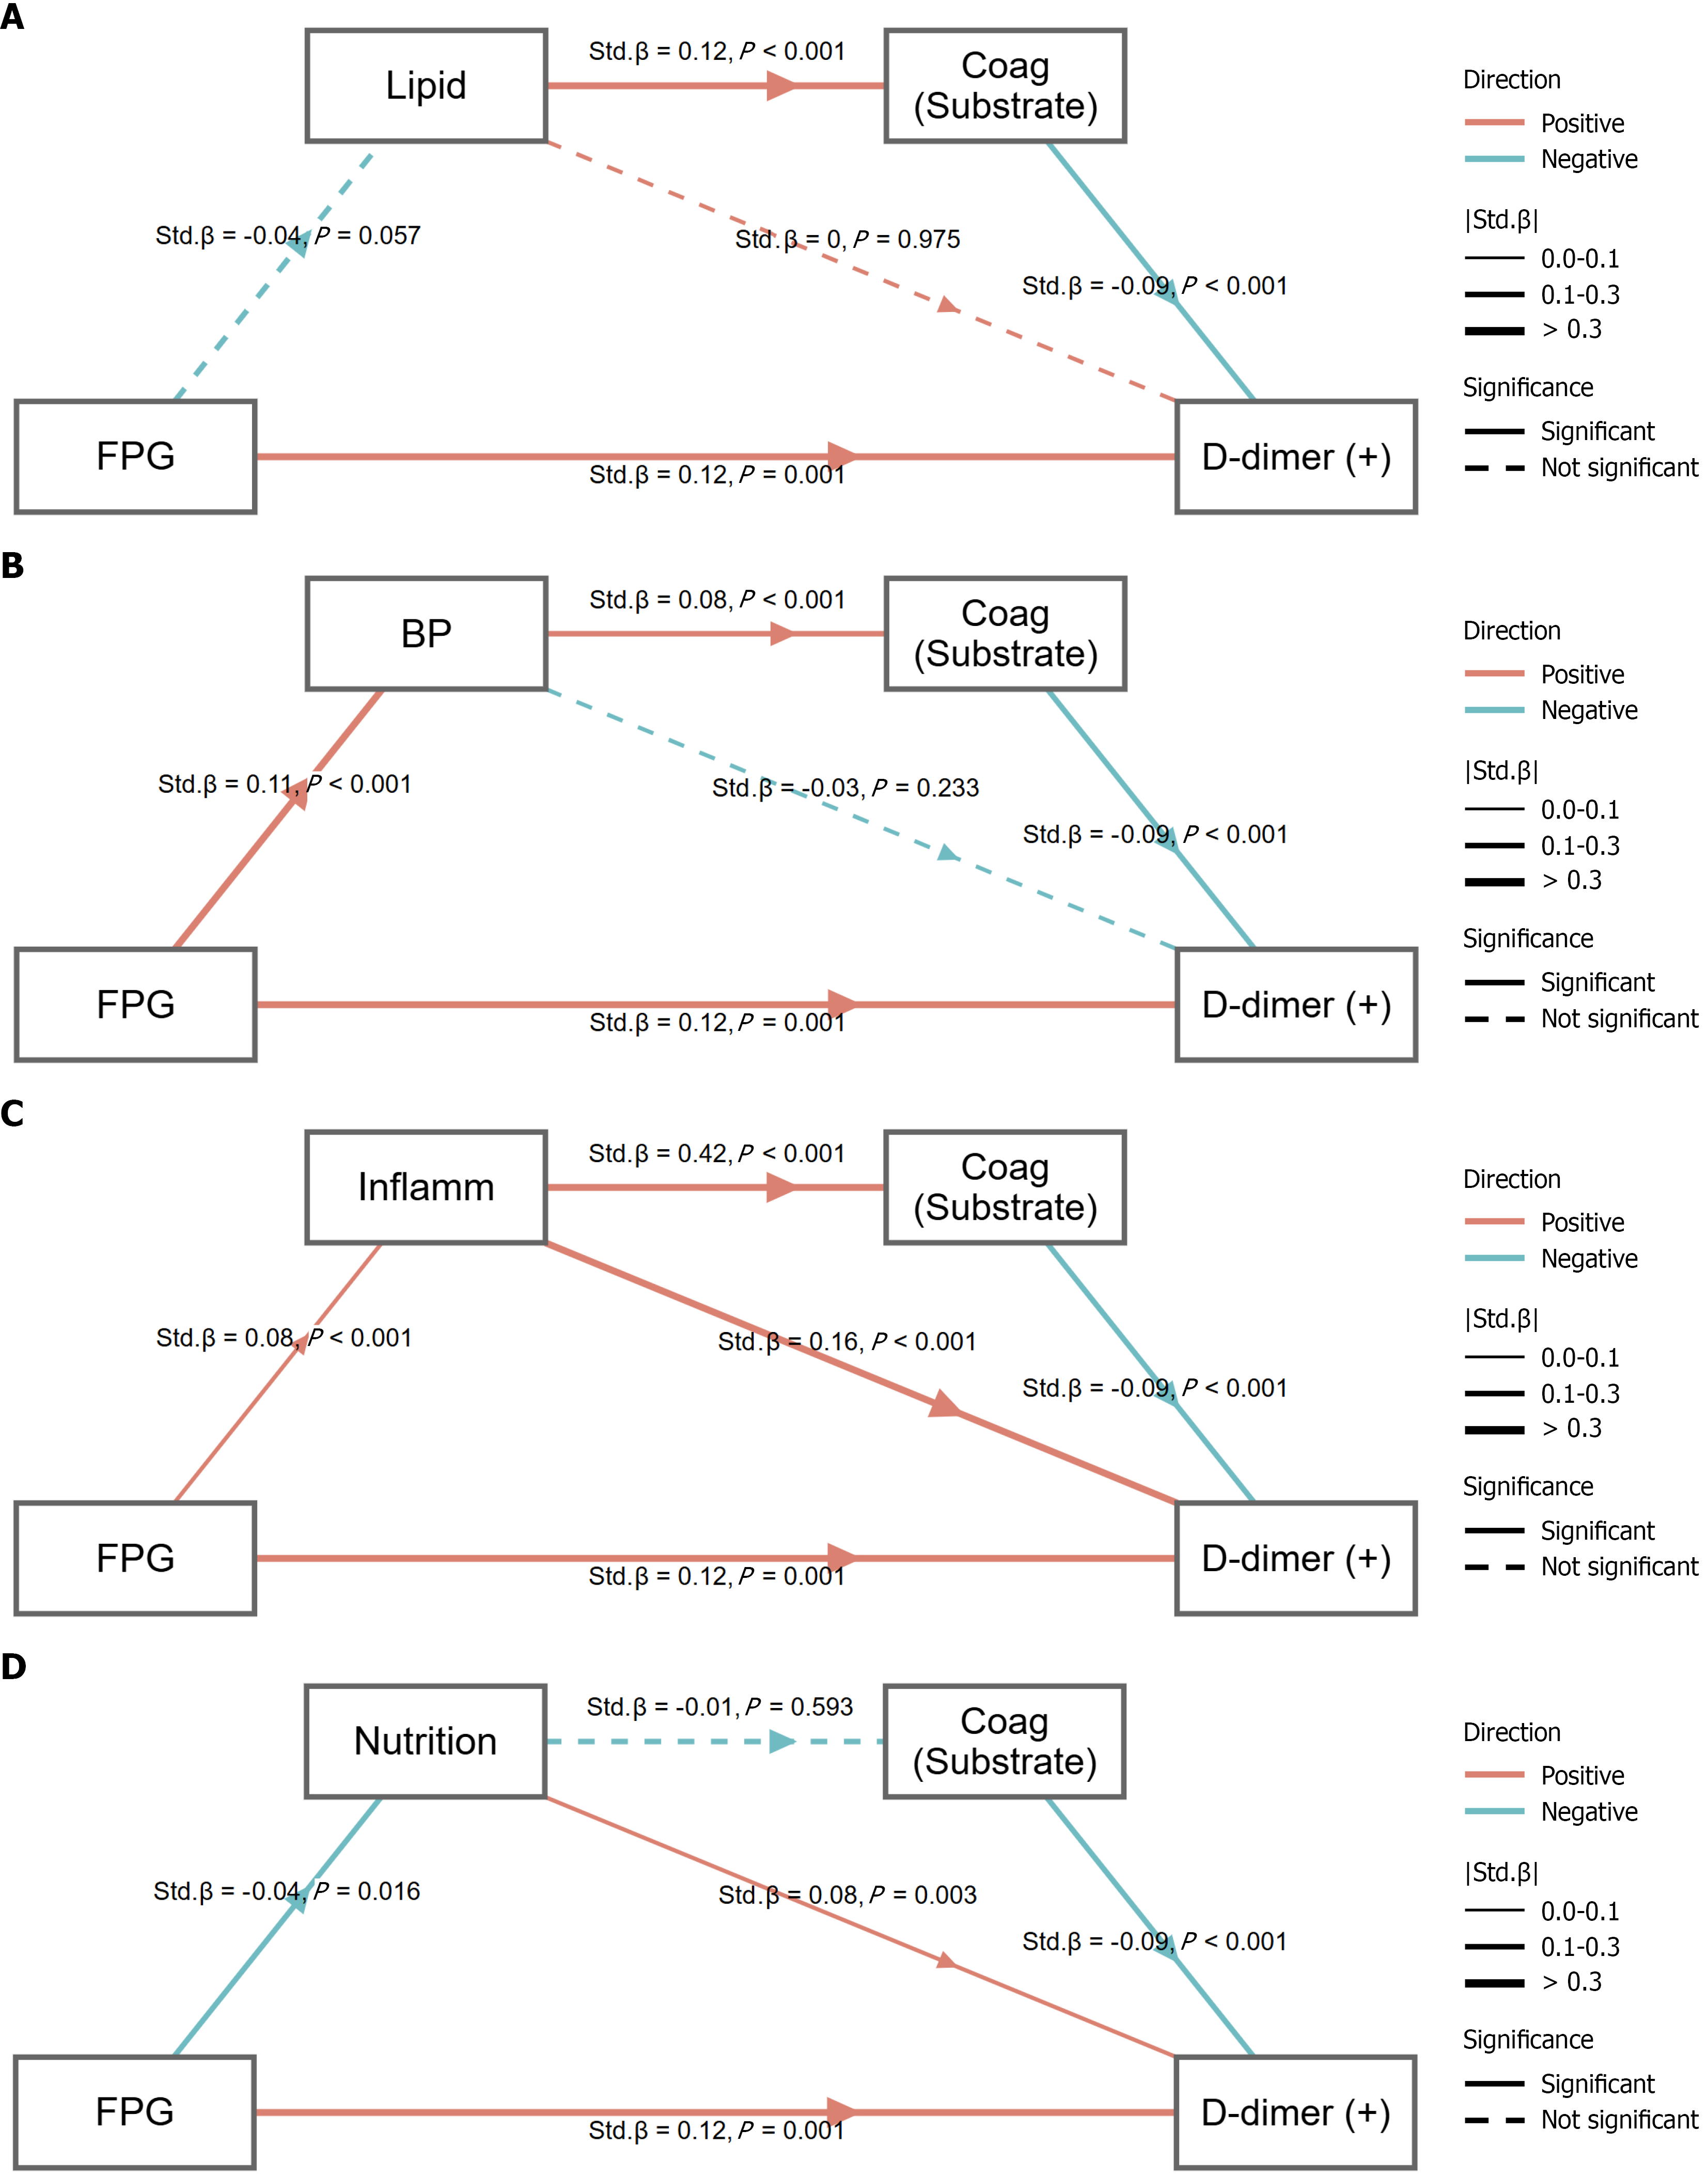
Figure 5 Pathways linking fasting plasma glucose to D-dimer across four upstream pathways.
A: Lipid pathway; B: Blood pressure pathway; C: Inflammation pathway; D: Nutrition pathway. A-D present system-specific path diagrams illustrating how fasting plasma glucose relates to D-dimer through upstream physiological pathway indices and a downstream coagulation substrate node. Each panel displays the full set of modeled pathways within the corresponding domain, including the direct association fasting plasma glucose → D-dimer and the indirect pathway fasting plasma glucose → upstream pathway index → coagulation (substrate) → D-dimer. Direct paths from each upstream pathway index to D-dimer are also shown, where specified. Panels correspond to four upstream pathway domains: (A) Lipid metabolism; (B) Blood pressure; (C) Inflammation; and (D) Nutrition. Arrow color denotes the direction of the standardized association (red = positive; cyan = negative), arrow thickness reflects the magnitude of the standardized coefficient (|Std.β|; 0-0.1, 0.1-0.3, > 0.3), and line type indicates statistical significance (solid = significant; dashed = not significant). FPG: Fasting plasma glucose; BP: Blood pressure.
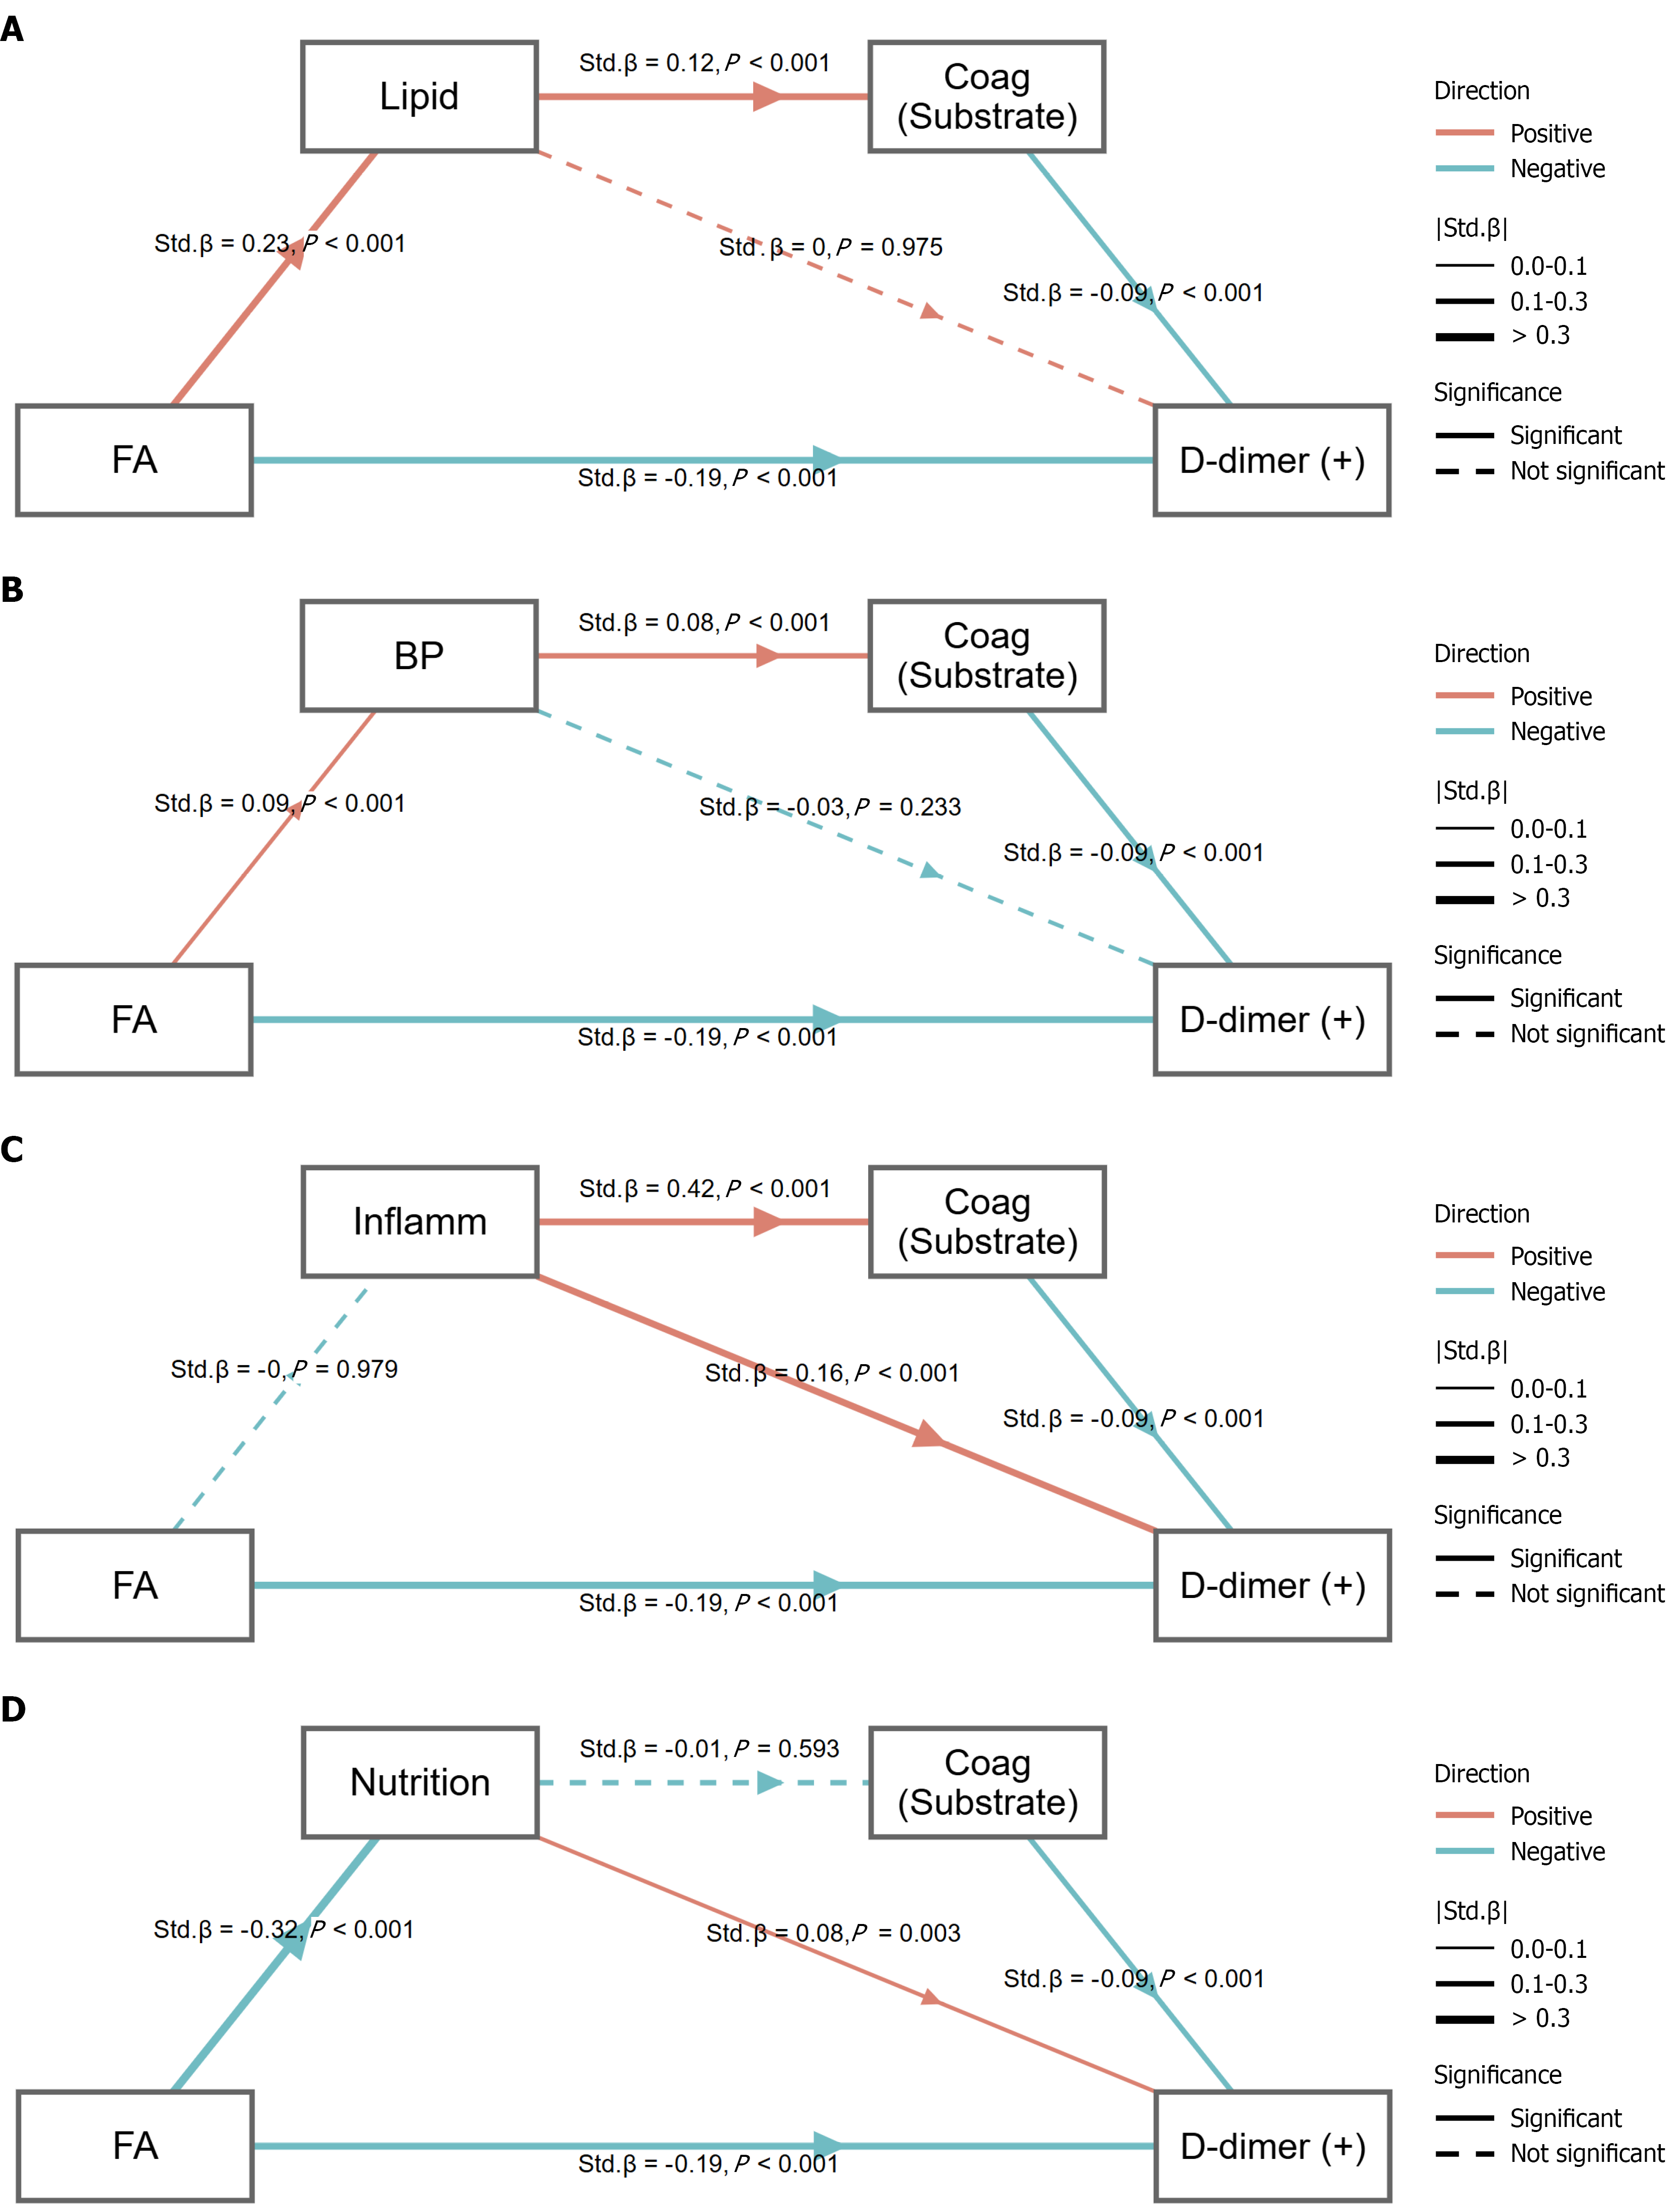
Figure 6 Pathways linking fructosamine to D-dimer across four upstream pathway domains.
A: Lipid pathway; B: Blood pressure pathway; C: Inflammation pathway; D: Nutrition pathway. A-D present system-specific path diagrams illustrating how fructosamine relates to D-dimer through upstream physiological pathway indices and a downstream coagulation substrate node. Each panel displays the full set of modeled pathways within the corresponding domain, including the direct association fructosamine → D-dimer and the indirect pathway fructosamine → upstream pathway index → coagulation (substrate) → D-dimer. Direct paths from each upstream pathway index to D-dimer are also shown, where specified. Panels correspond to four upstream pathway domains: (A) Lipid metabolism; (B) Blood pressure; (C) Inflammation; and (D) Nutrition. Arrow color denotes the direction of the standardized association (red = positive; cyan = negative), arrow thickness reflects the magnitude of the standardized coefficient (|Std.β|; 0-0.1, 0.1-0.3, > 0.3), and line type indicates statistical significance (solid = significant; dashed = not significant). FA: Fructosamine; BP: Blood pressure.
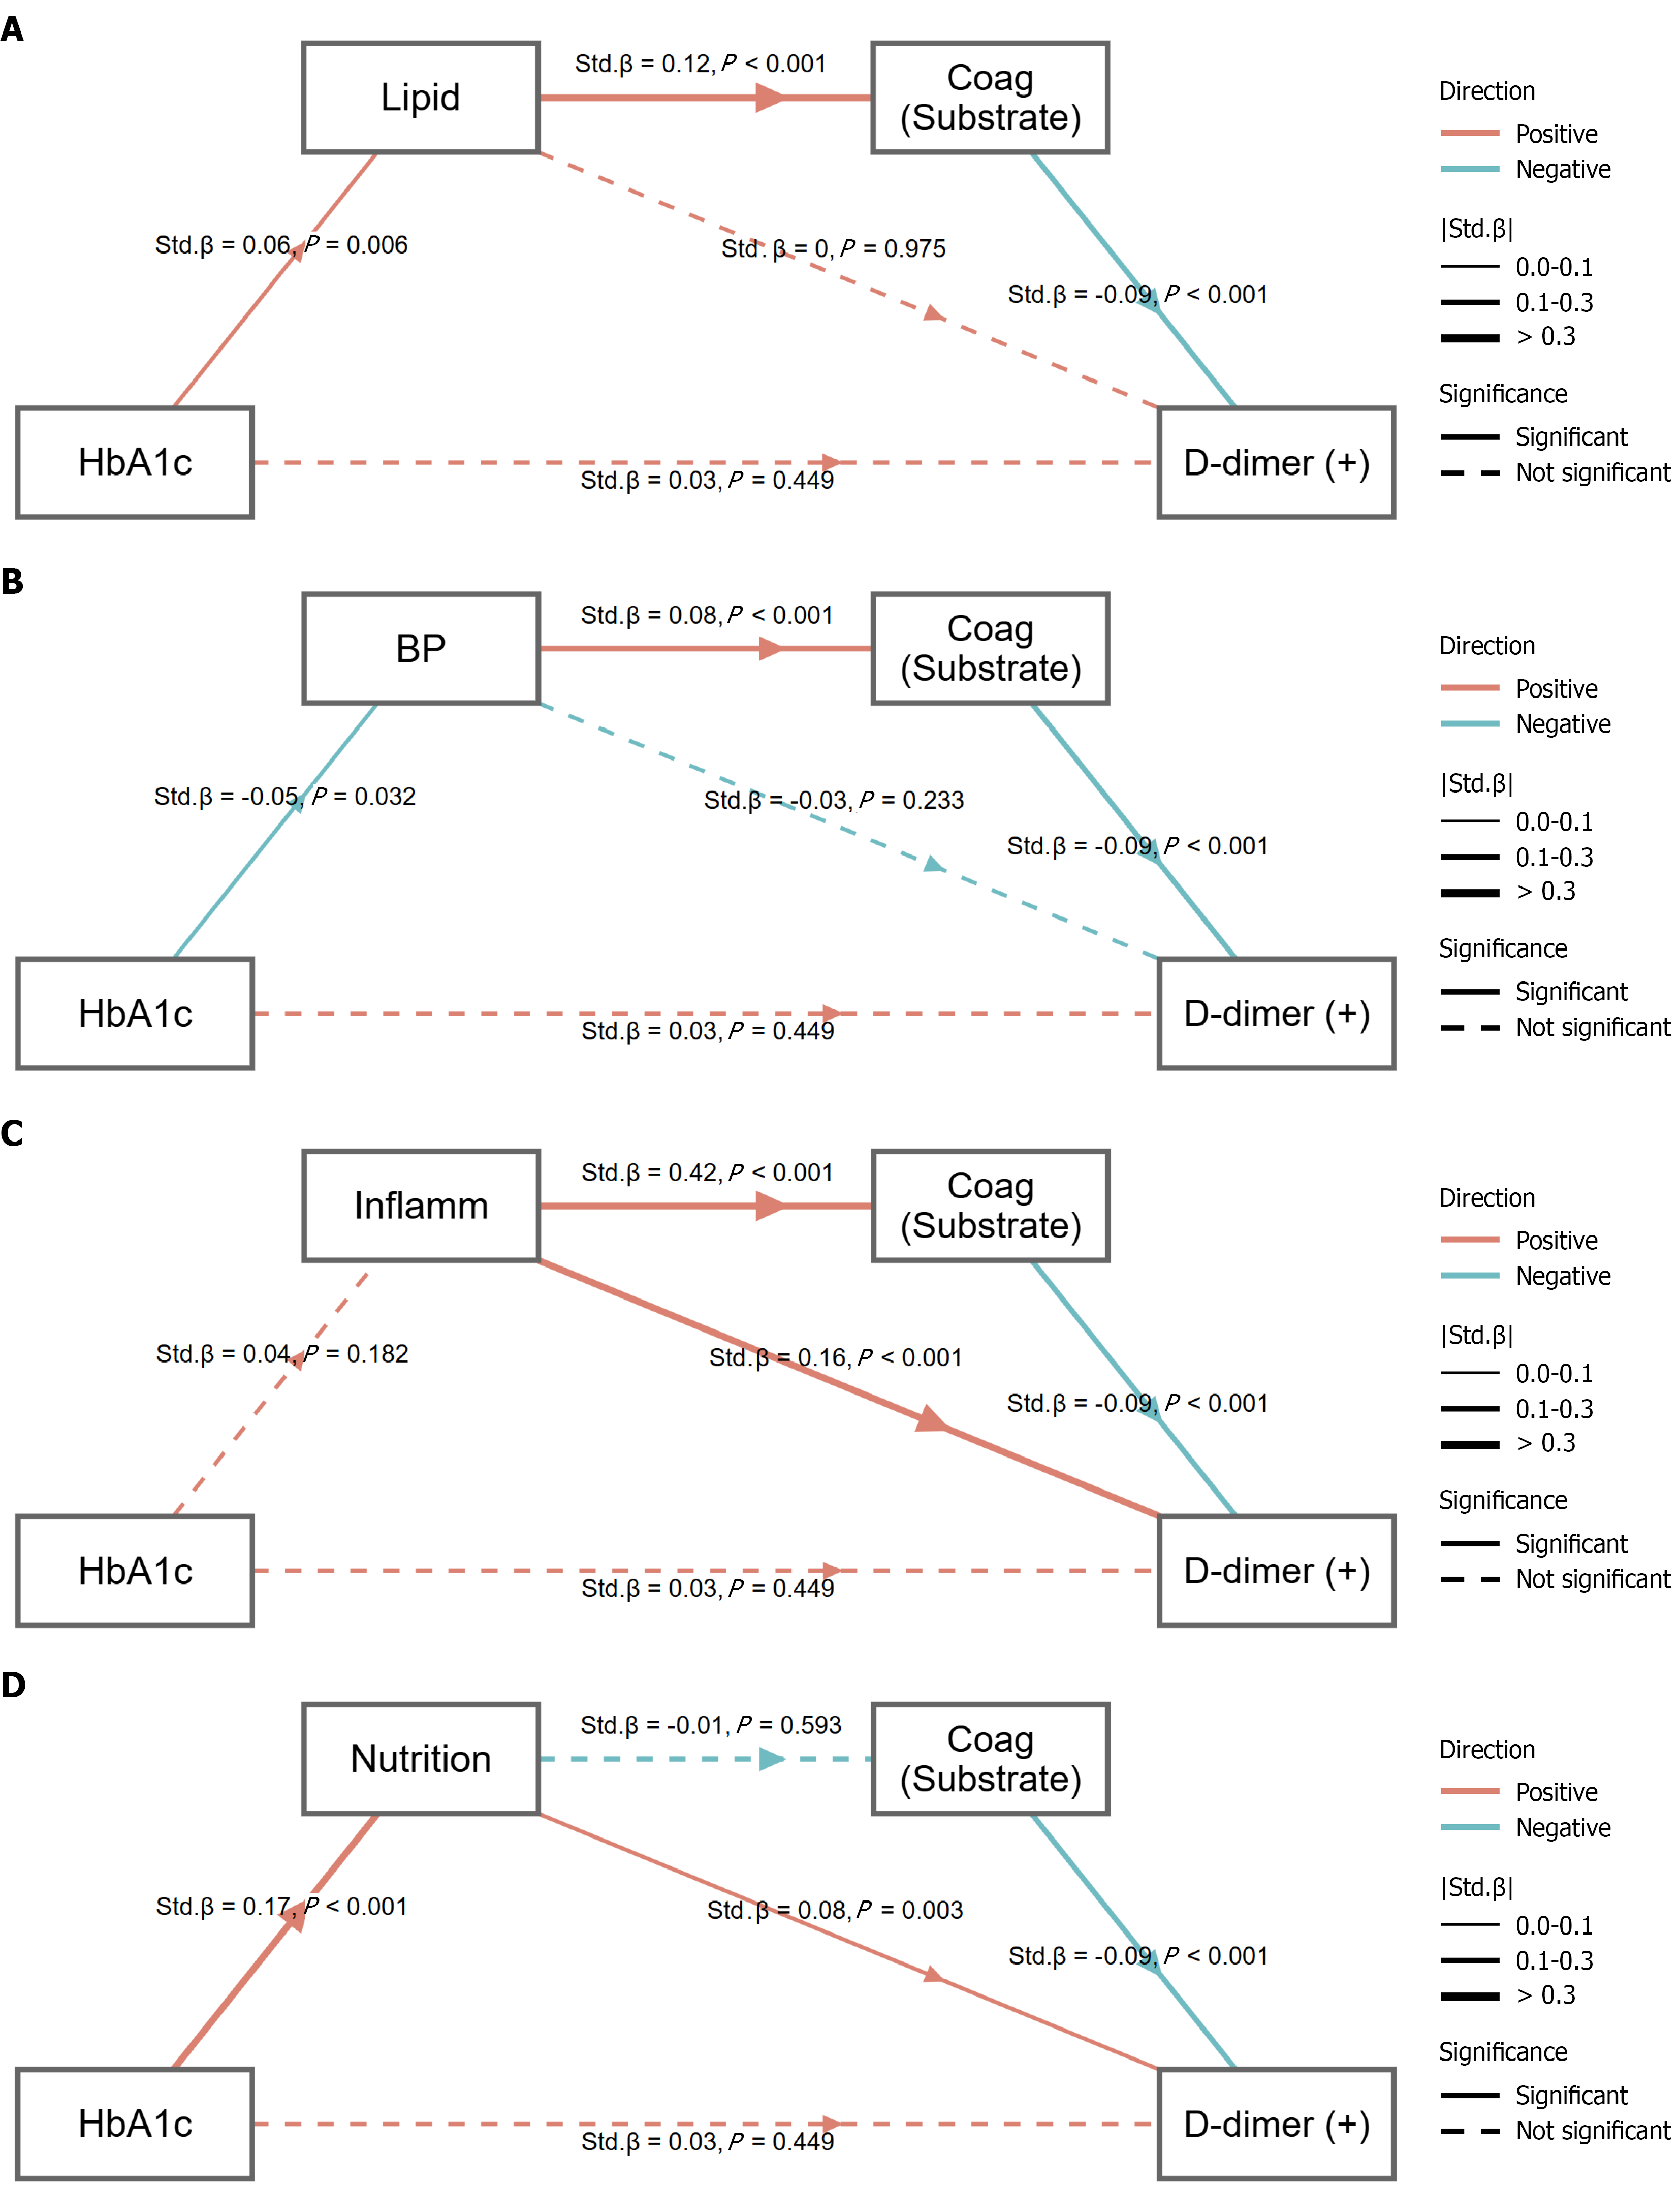
Figure 7 Pathways linking glycated hemoglobin to D-dimer across four upstream pathway domains.
A: Lipid pathway; B: Blood pressure pathway; C: Inflammation pathway; D: Nutrition pathway. A-D present system-specific path diagrams illustrating how glycated hemoglobin relates to D-dimer through upstream physiological pathway indices and a downstream coagulation substrate node. Each panel displays the full set of modeled pathways within the corresponding domain, including the direct association glycated hemoglobin → D-dimer and the indirect pathway glycated hemoglobin → upstream pathway index → coagulation (substrate) → D-dimer. Direct paths from each upstream pathway index to D-dimer are also shown, where specified. Panels correspond to four upstream pathway domains: (A) Lipid metabolism; (B) Blood pressure; (C) Inflammation; and (D) Nutrition. Arrow color denotes the direction of the standardized association (red = positive; cyan = negative), arrow thickness reflects the magnitude of the standardized coefficient (|Std.β|; 0-0.1, 0.1-0.3, > 0.3), and line type indicates statistical significance (solid = significant; dashed = not significant). HbA1c: Glycated hemoglobin; BP: Blood pressure.
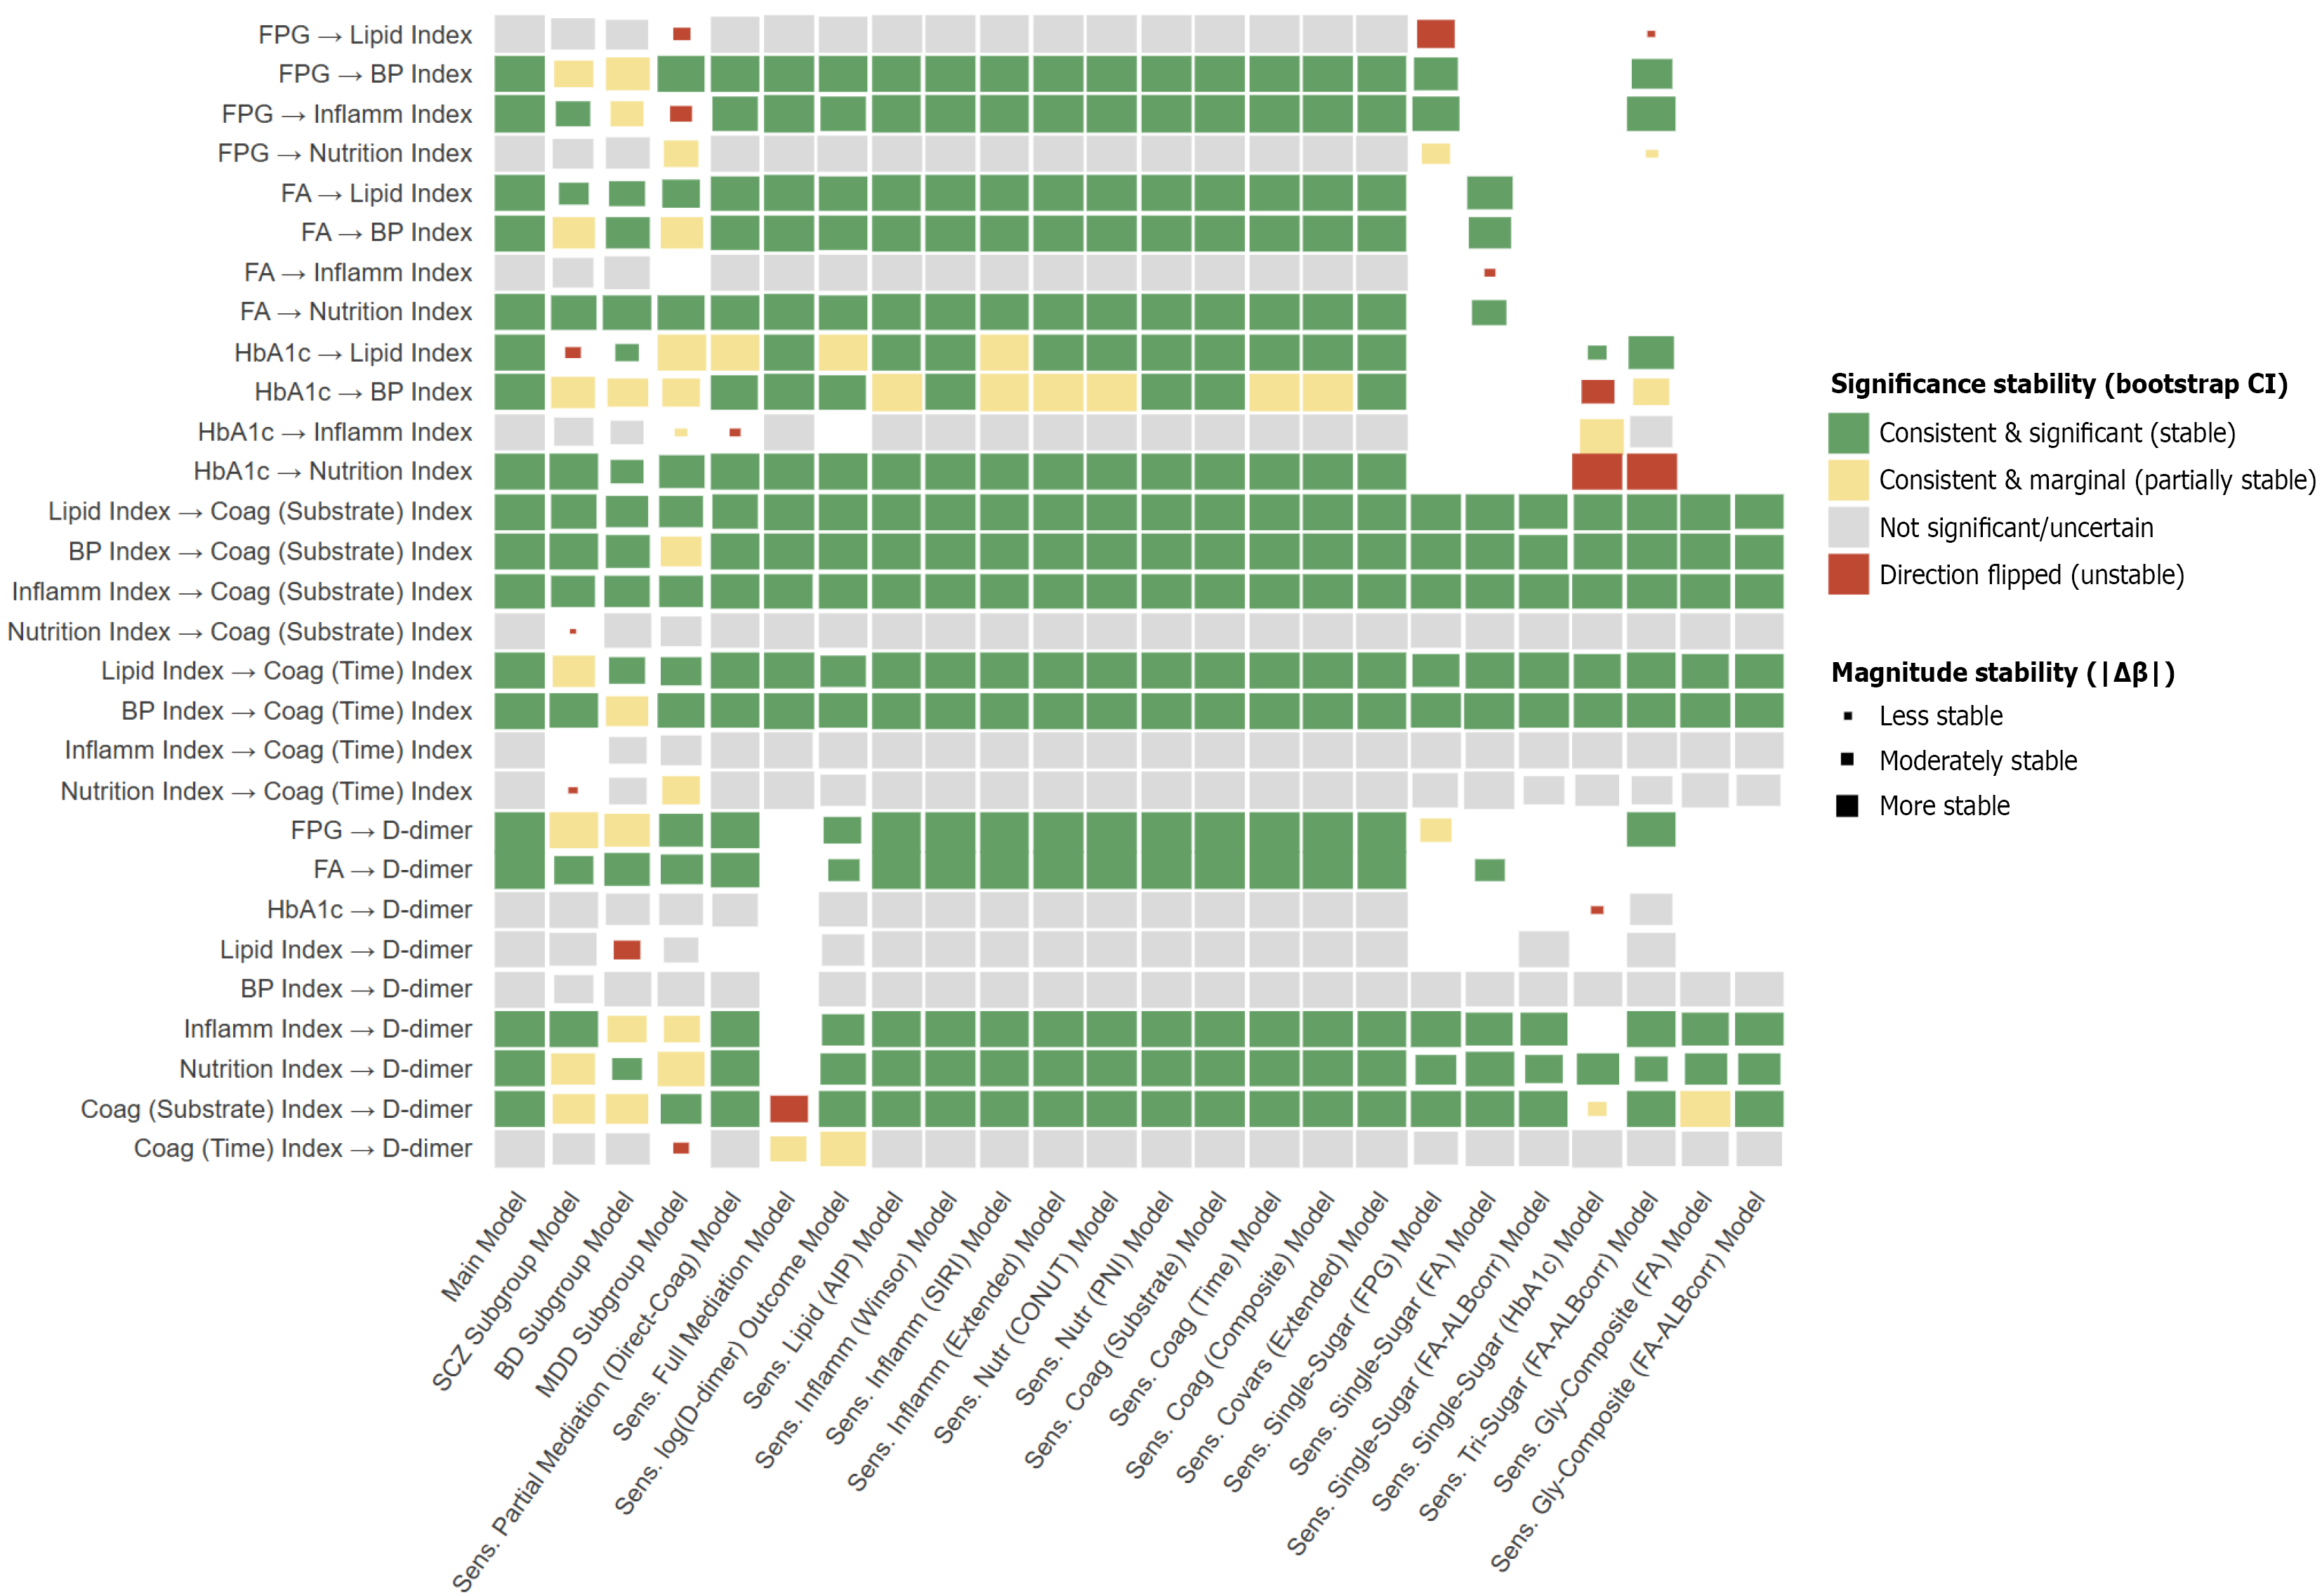
Figure 8 Heatmap of structural pathway stability across the main model and multiple sensitivity analyses.
This heatmap summarizes the stability of each retained structural path (rows) across the main model and all subgroup/sensitivity models (columns). For each model-path cell, the standardized path coefficient (β) and its bootstrap 95% confidence interval (CI) were compared with the corresponding coefficient in the main model (baseline). Statistical significance was defined as a CI that does not cross zero: A path was considered significant if the CI lower > 0 or the CI upper < 0; otherwise, it was treated as non-significant or uncertain. Direction was determined from the sign of β (with a near-zero tolerance ε = 1 × 10⁻12): Β > ε (positive), β < -ε (negative), and |β| ≤ ε (zero/neutral). Direction consistency was defined as “same direction” when the current sign matched the baseline sign, or when either sign was zero (i.e., baseline = 0 or current = 0 was treated as direction-compatible). A direction flip was flagged when both baseline and current signs were non-zero and opposite (sign_baseline ≠ sign_current). Cells were assigned to four stability classes (tile color): (1) Consistent and significant (stable): Direction compatible and both baseline and current paths significant; (2) Consistent and marginal (partially stable): Direction compatible but statistical significance differed between baseline and current (exactly one significant); (3) Not significant/uncertain: All remaining non-flipped cases, including when both paths were non-significant; and (4) Direction flipped (unstable): Opposite non-zero signs between baseline and current. To quantify magnitude stability, the change in standardized coefficient relative to baseline was computed as Δβ = β_current - β_baseline, and its absolute value |Δβ| was used for visualization. |Δβ| was clipped at 0.20 (DELTA MAX = 0.20). Tile size encodes magnitude stability in a direction-dependent manner: For direction-consistent paths, tile size decreases with increasing |Δβ|, whereas for direction-flipped paths, tile size increases with increasing |Δβ|. Cells with missing coefficients or unavailable paths were not drawn to avoid visual misinterpretation.
- Citation: Wei J, Du HY, He Q, Jia SS, Luo FG, Wang YC. Glycemic indicators influence hypercoagulability via multisystem pathways in psychiatric inpatients: Structural equation modeling. World J Psychiatry 2026; 16(10): 121314
- URL: https://www.wjgnet.com/2220-3206/full/v16/i10/121314.htm
- DOI: https://dx.doi.org/10.5498/wjp.121314