















Copyright: ©Author(s) 2026.
World J Psychiatry. Oct 19, 2026; 16(10): 119983
Published online Oct 19, 2026. doi: 10.5498/wjp.119983
Published online Oct 19, 2026. doi: 10.5498/wjp.119983
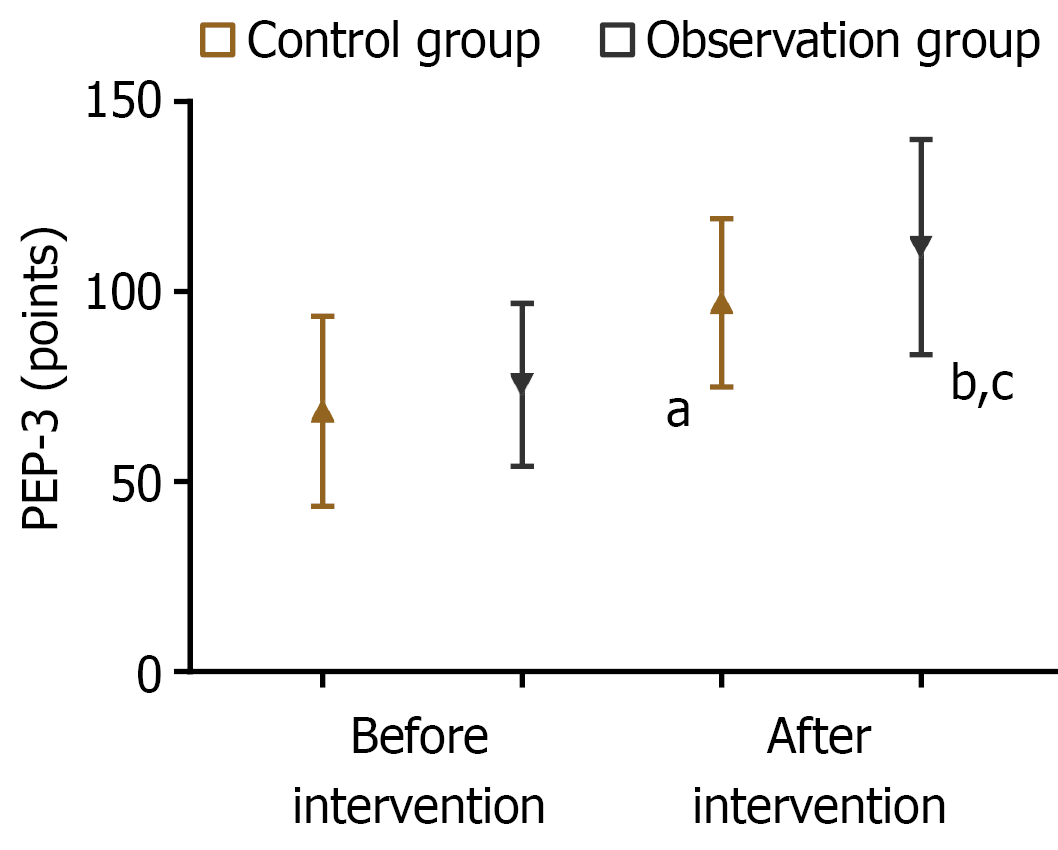
Figure 1 Comparative analysis of developmental levels.
Psychoeducational Profile-Third Edition scores before and after intervention in the control group and the observation group. aP < 0.05, bP < 0.01 vs before intervention. cP < 0.05 vs the control group. PEP-3: Psychoeducational Profile-Third Edition.
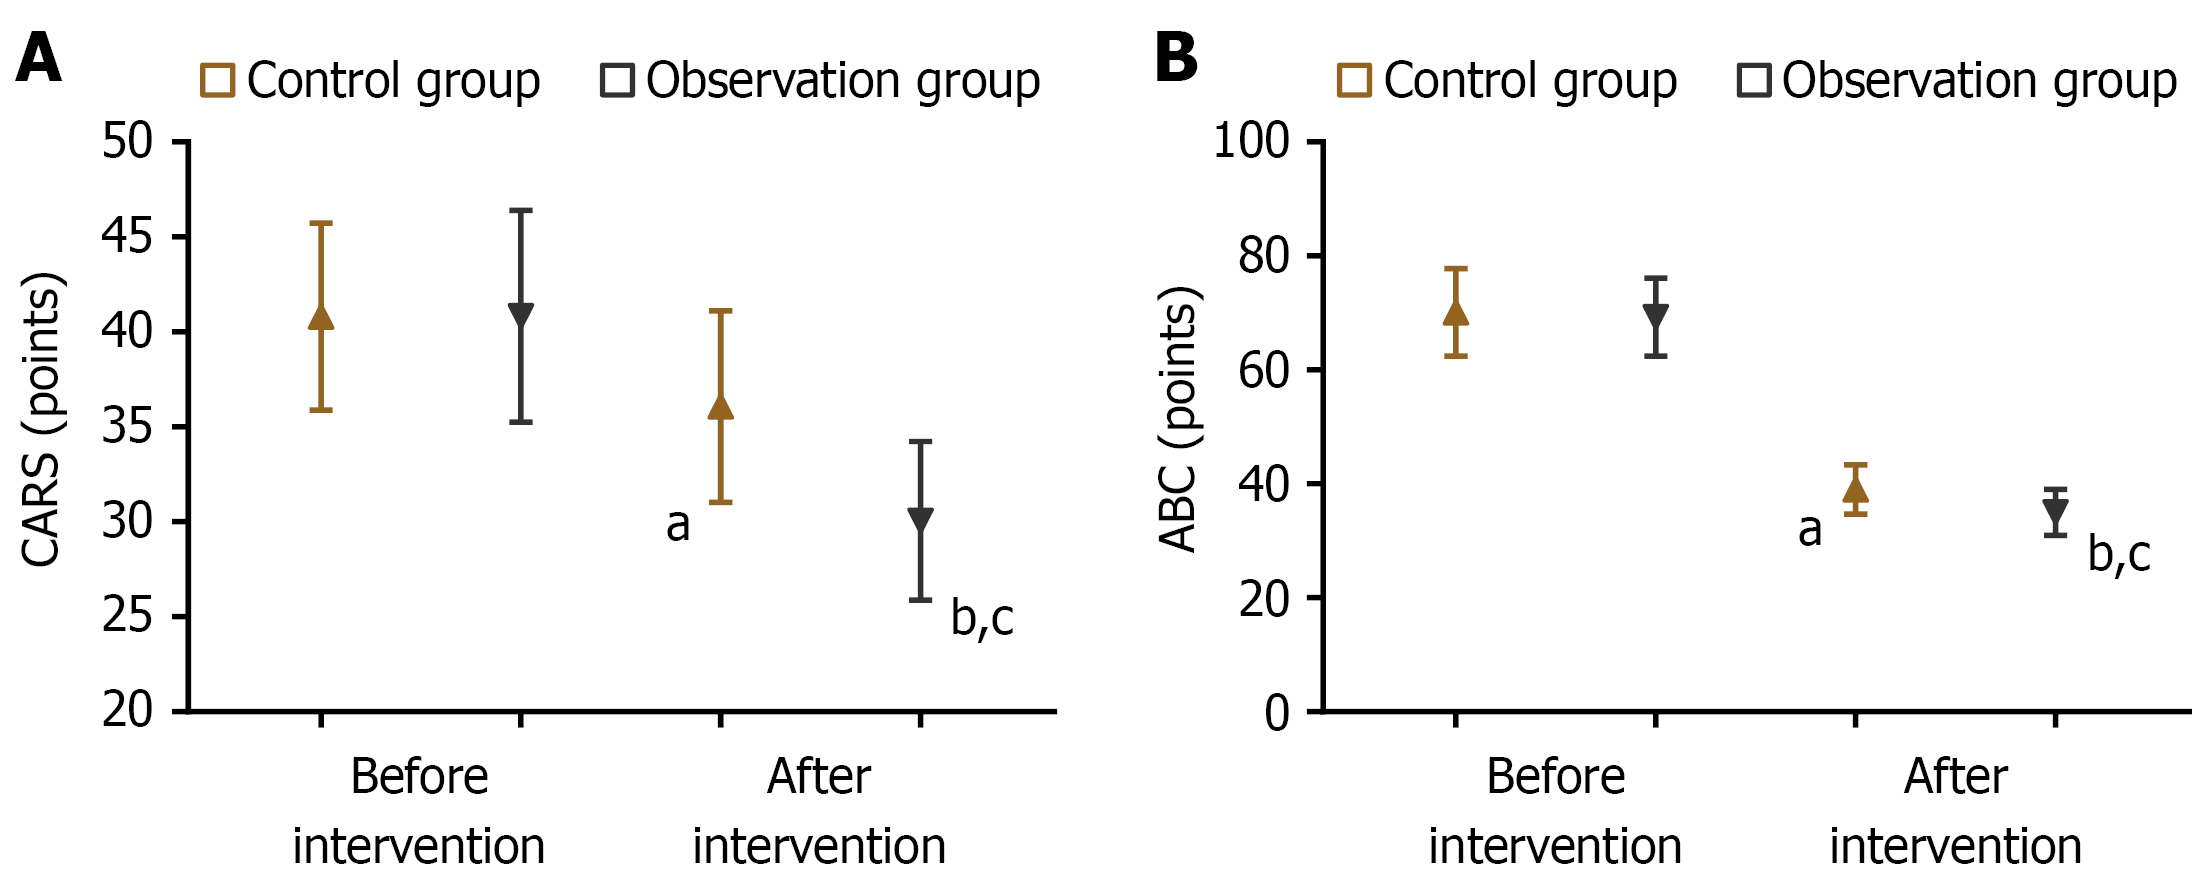
Figure 2 Comparative analysis of autistic severity.
A: Childhood Autism Rating Scale scores before and after intervention; B: Autism Behavior Checklist scores before and after intervention. aP < 0.05, bP < 0.01 vs before intervention. cP < 0.05 vs the control group. CARS: Childhood Autism Rating Scale; ABC: Autism Behavior Checklist.
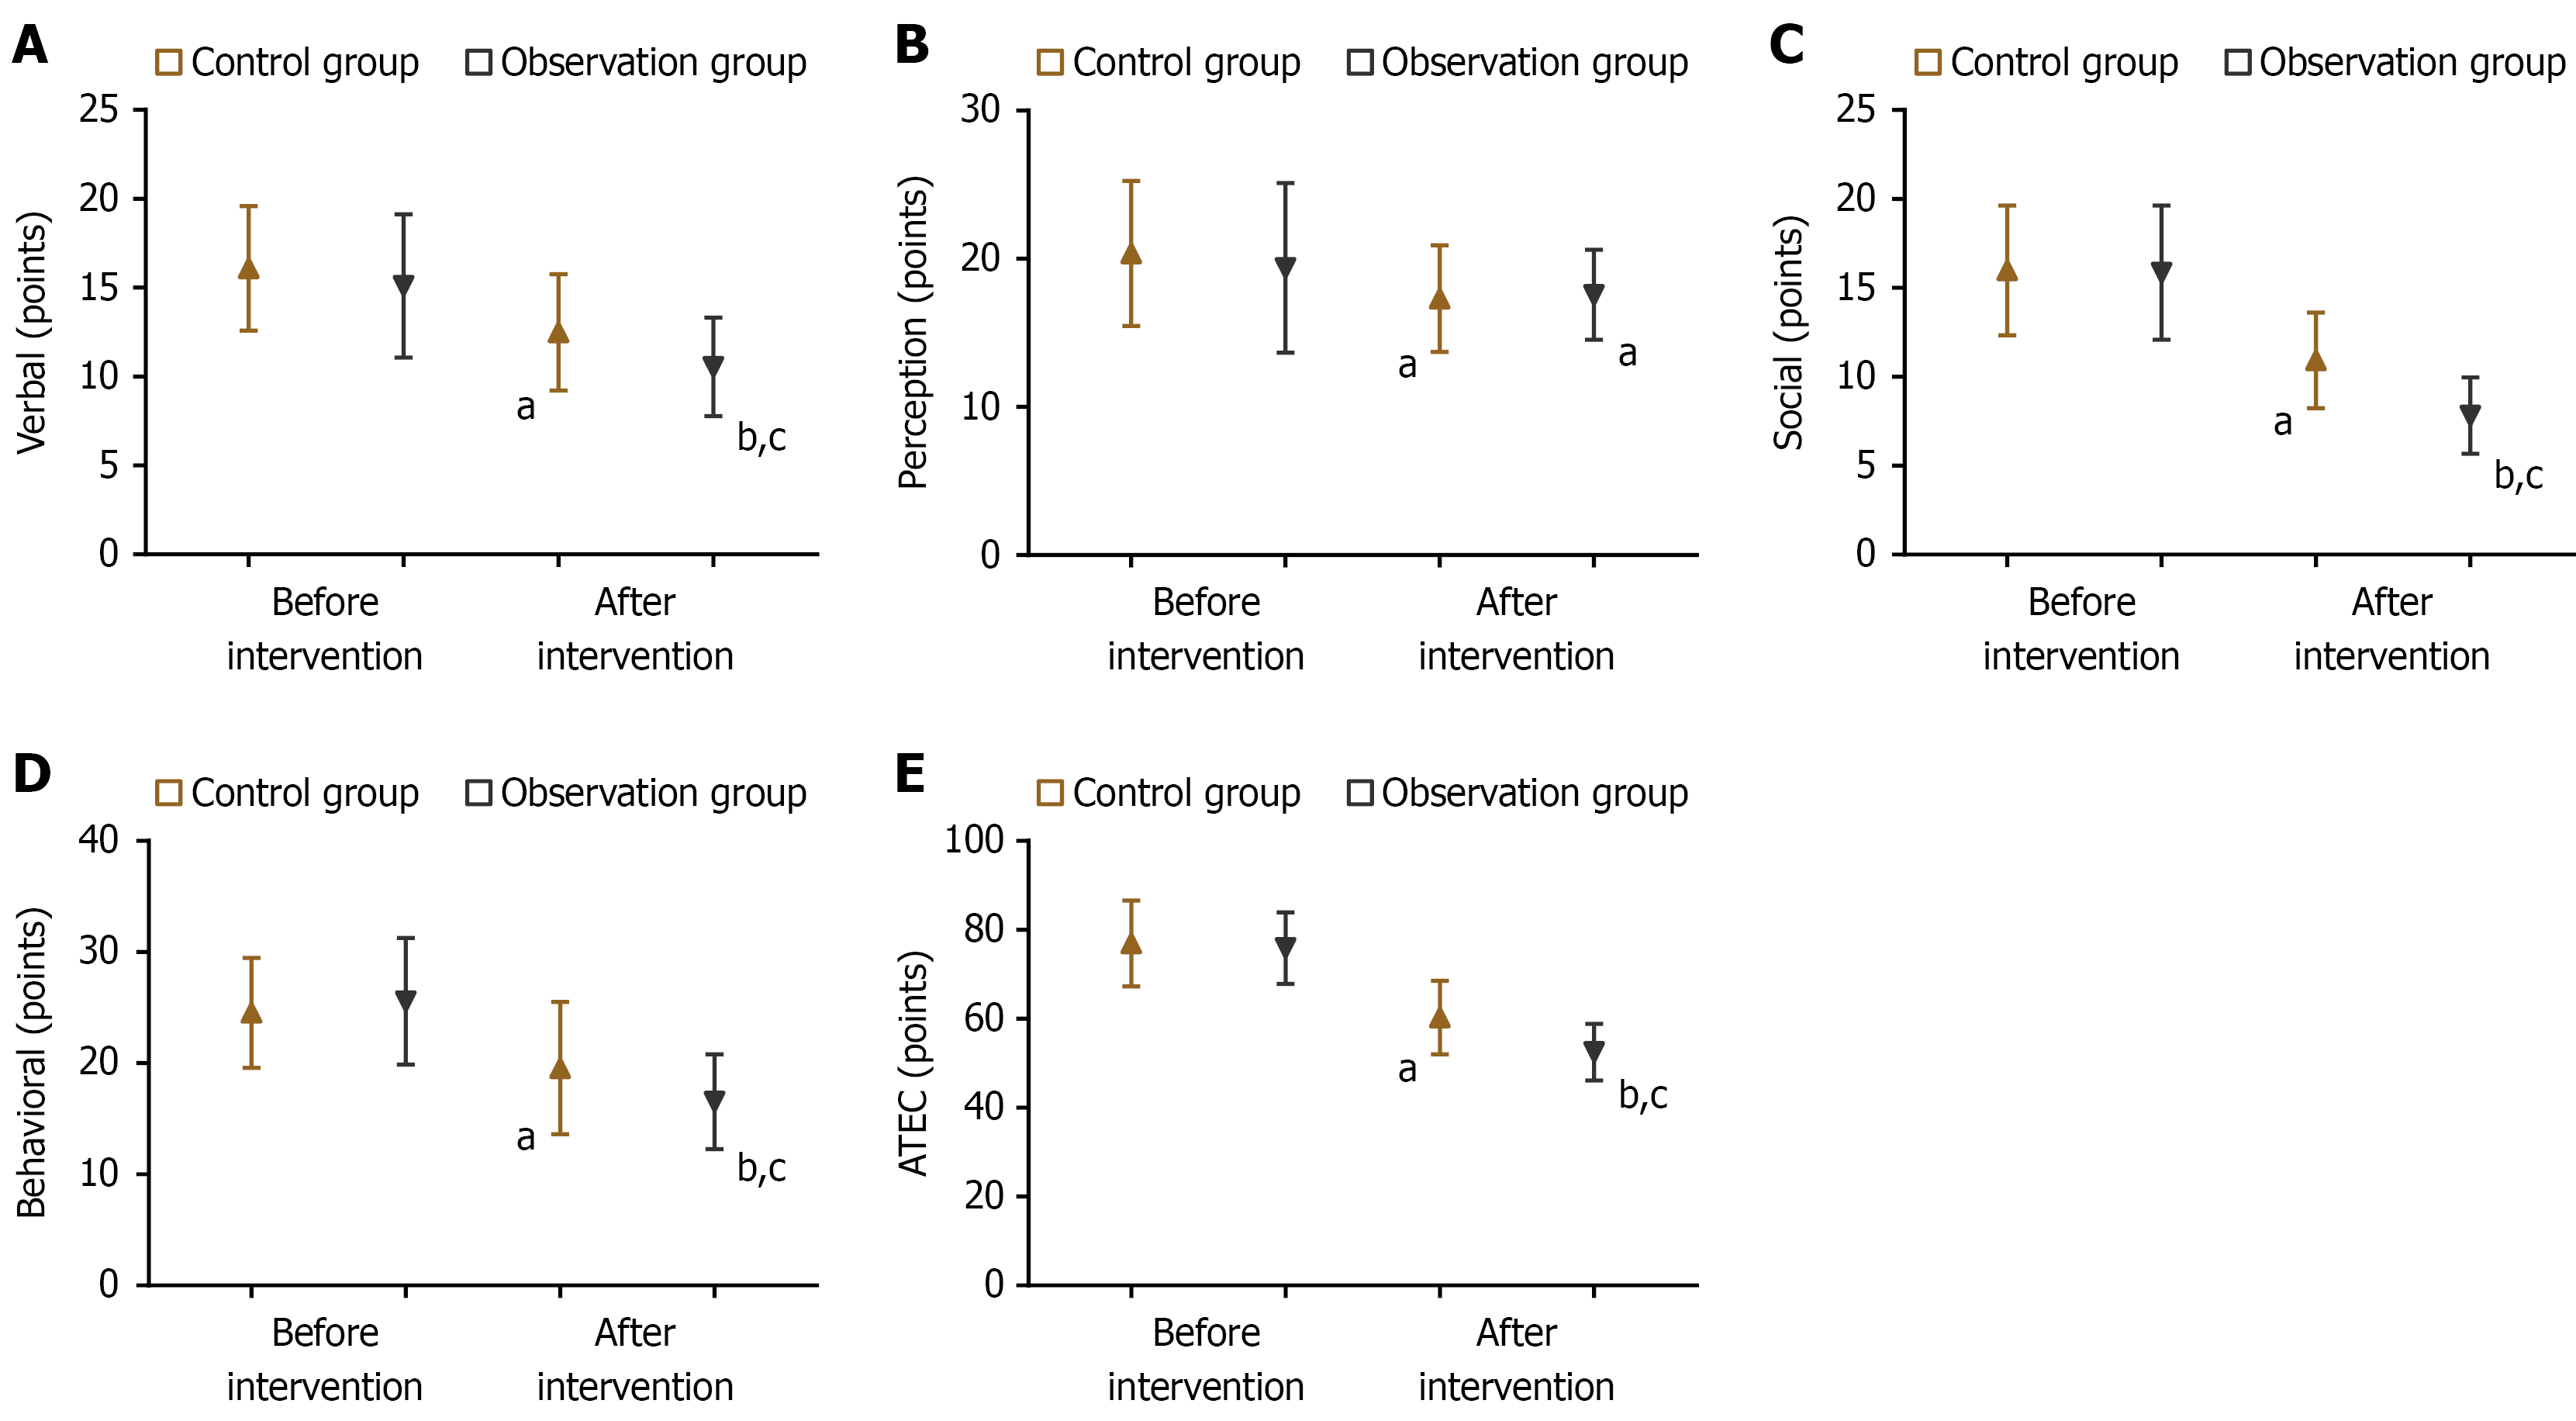
Figure 3 Comparative analysis of intervention effects.
A: Speech/Language communication scores before and after intervention; B: Sensory/cognitive awareness scores before and after intervention; C: Sociability scores before and after intervention; D: Health/physical/behavior scores before and after intervention; E: Total Autism Treatment Evaluation Checklist scores before and after intervention. aP < 0.05, bP < 0.01 vs before intervention. cP < 0.05 vs the control group. ATEC: Autism Treatment Evaluation Checklist.
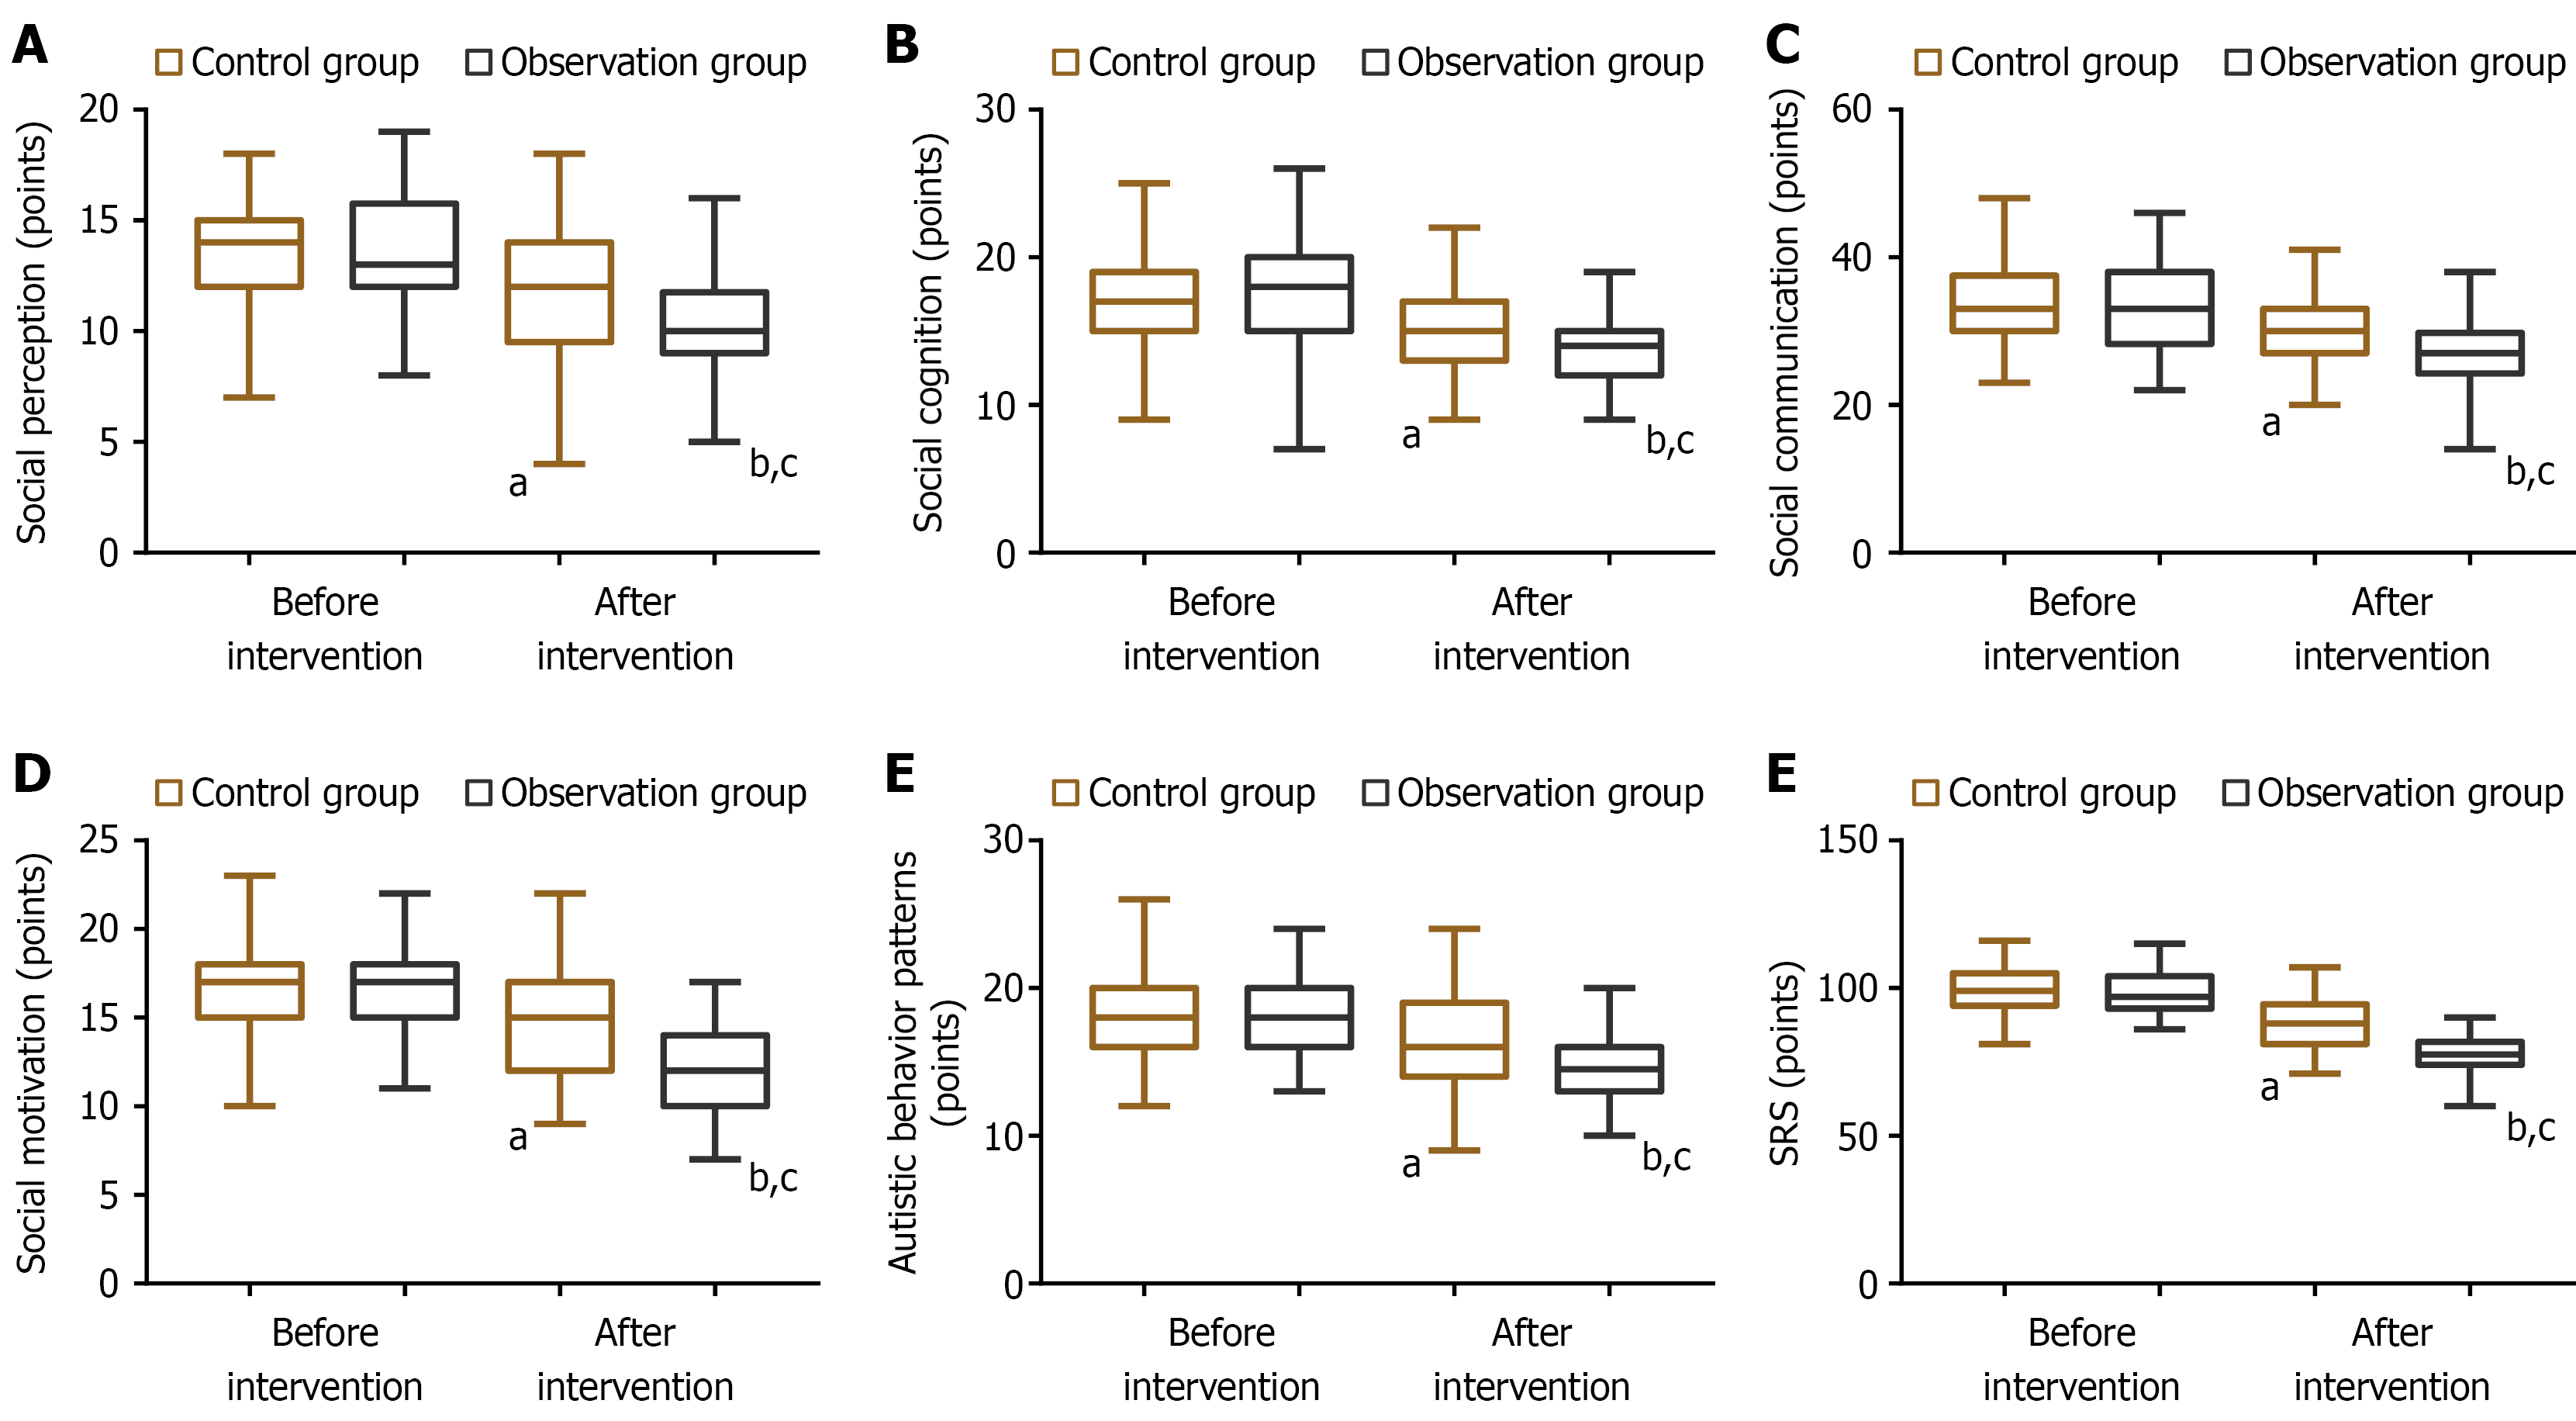
Figure 4 Comparative analysis of sociability.
A: Social awareness scores before and after intervention; B: Social cognition scores before and after intervention; C: Social communication scores before and after intervention; D: Social motivation scores before and after intervention; E: Autistic mannerisms scores before and after intervention; F: Total Social Responsiveness Scale scores before and after intervention. aP < 0.05, bP < 0.01 vs before intervention. cP < 0.05 vs the control group. SRS: Social Responsiveness Scale.
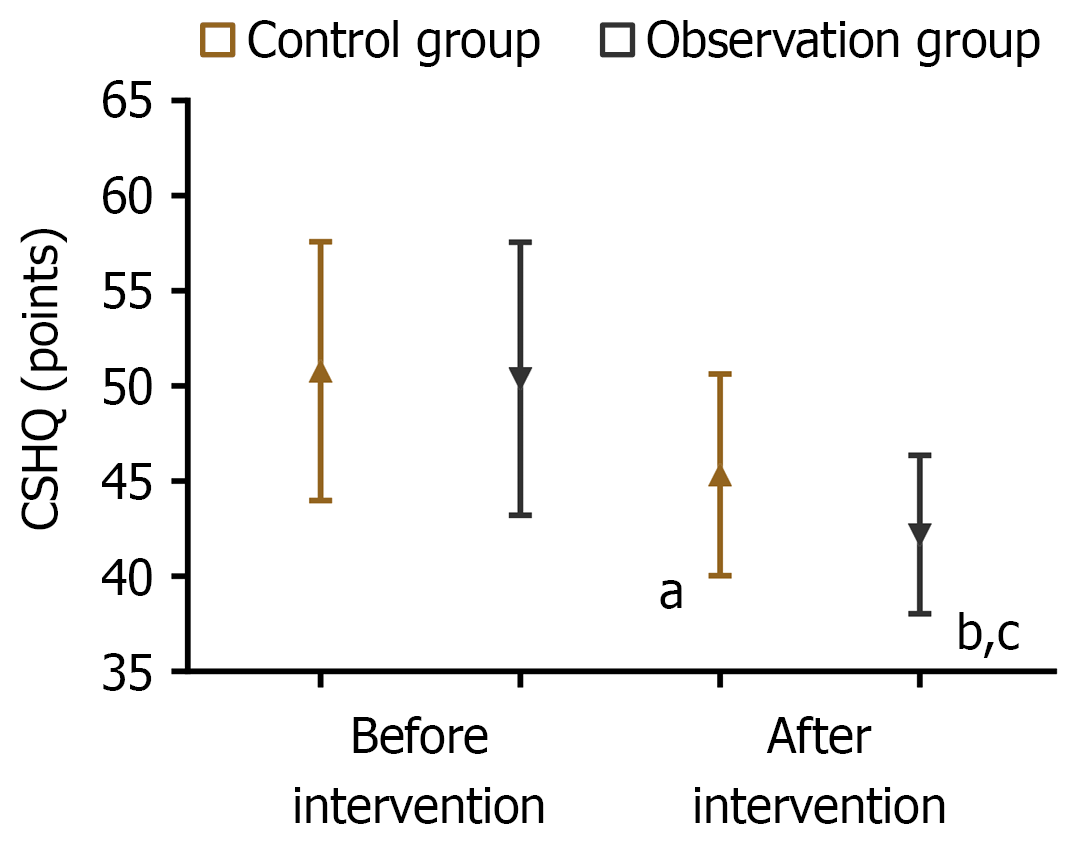
Figure 5 Comparative analysis of sleep status.
Children’s Sleep Habits Questionnaire scores before and after intervention in the control group and the observation group. aP < 0.05, bP < 0.01 vs before intervention. cP < 0.05 vs the control group. CSHQ: Children’s Sleep Habits Questionnaire.
- Citation: Li T, Han L, Feng SB, Li ZL, Zhang G. Effects of repetitive transcranial magnetic stimulation plus sandplay therapy on children with autism spectrum disorder. World J Psychiatry 2026; 16(10): 119983
- URL: https://www.wjgnet.com/2220-3206/full/v16/i10/119983.htm
- DOI: https://dx.doi.org/10.5498/wjp.119983