Copyright
©The Author(s) 2025.
World J Psychiatry. Sep 19, 2025; 15(9): 108359
Published online Sep 19, 2025. doi: 10.5498/wjp.v15.i9.108359
Published online Sep 19, 2025. doi: 10.5498/wjp.v15.i9.108359
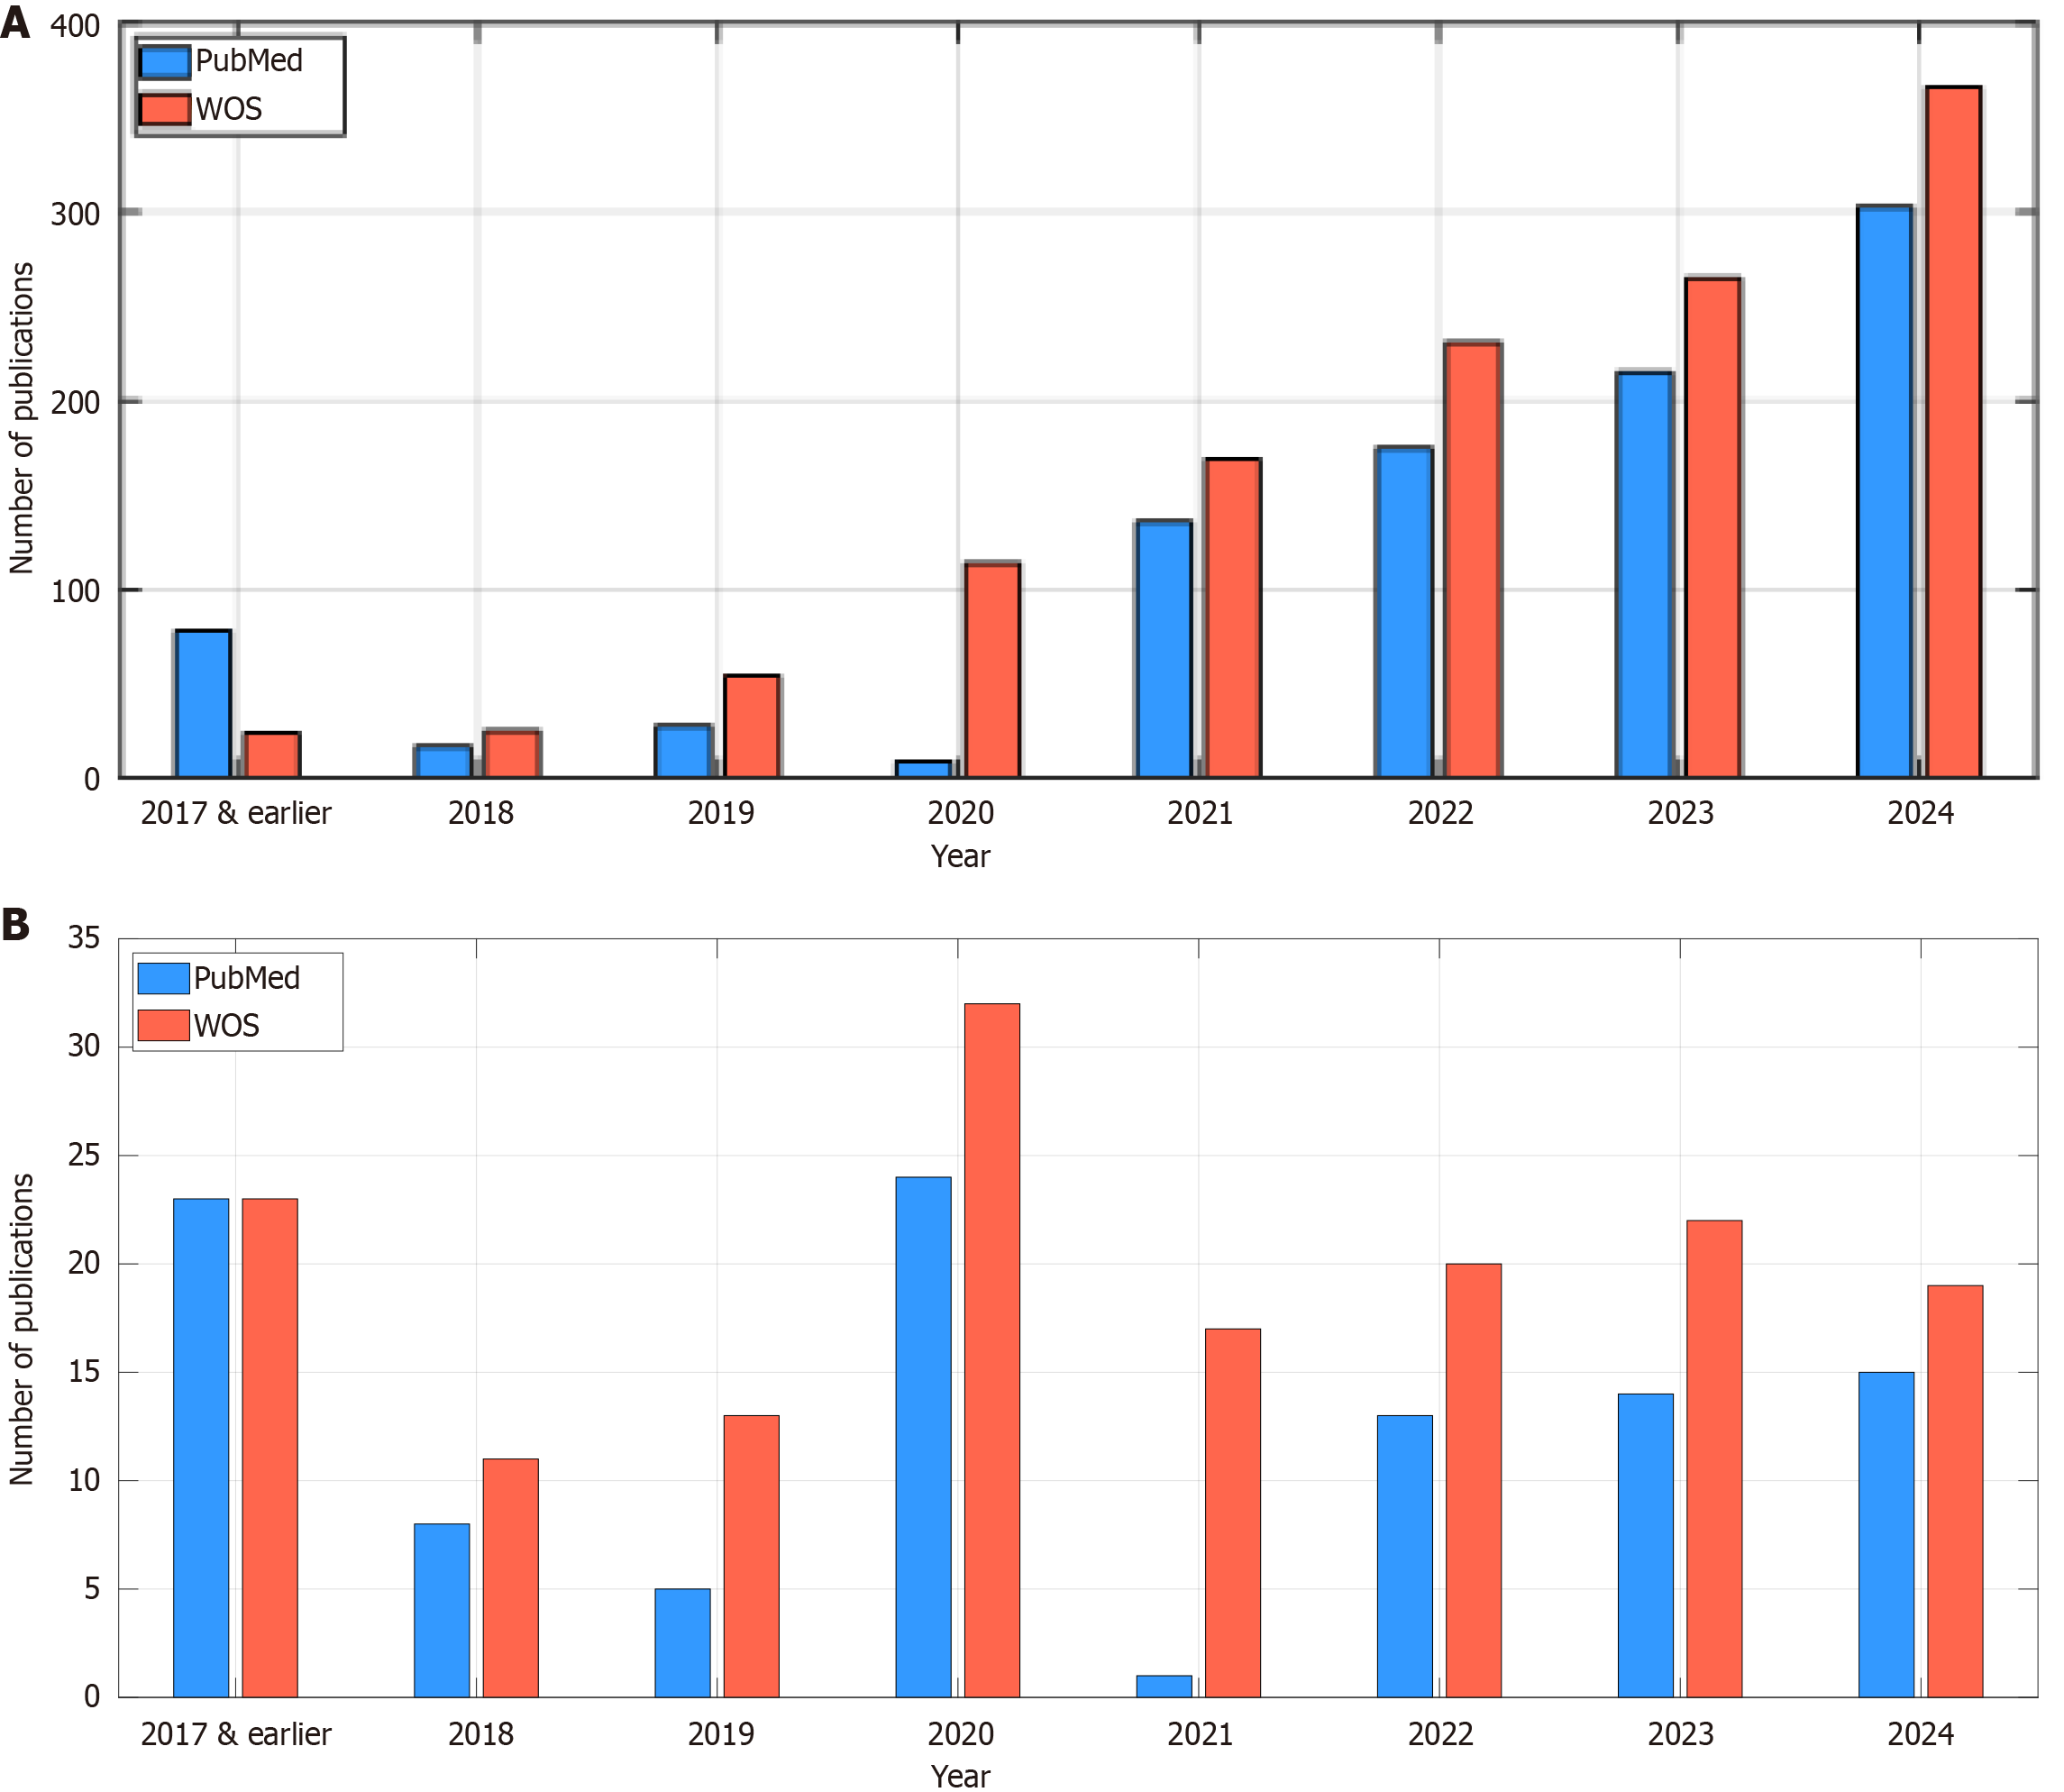
Figure 1 Publications featuring the key terms “optical coherence tomography”, “artificial intelligence”, and “schizophrenia”.
A: Optical coherence tomography (OCT)-based artificial intelligence papers; B: OCT-based automated schizophrenia detection papers. WOS: Web of Science.
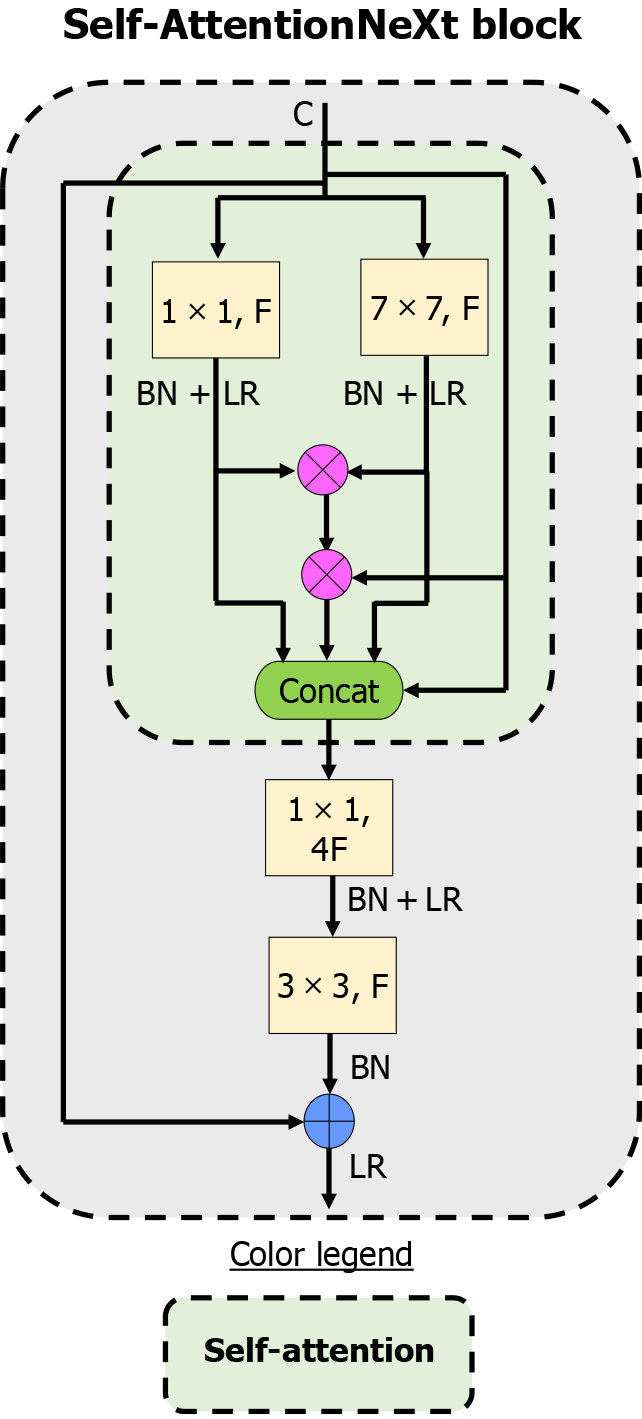
Figure 2 Proposed Self-AttentionNeXt block.
1 × 1, 3 × 3, 7 × 7: Convolutional kernel sizes; BN: Batch normalization; Concat: Depth concatenation; F: Number of filters; LR: Leaky ReLu.
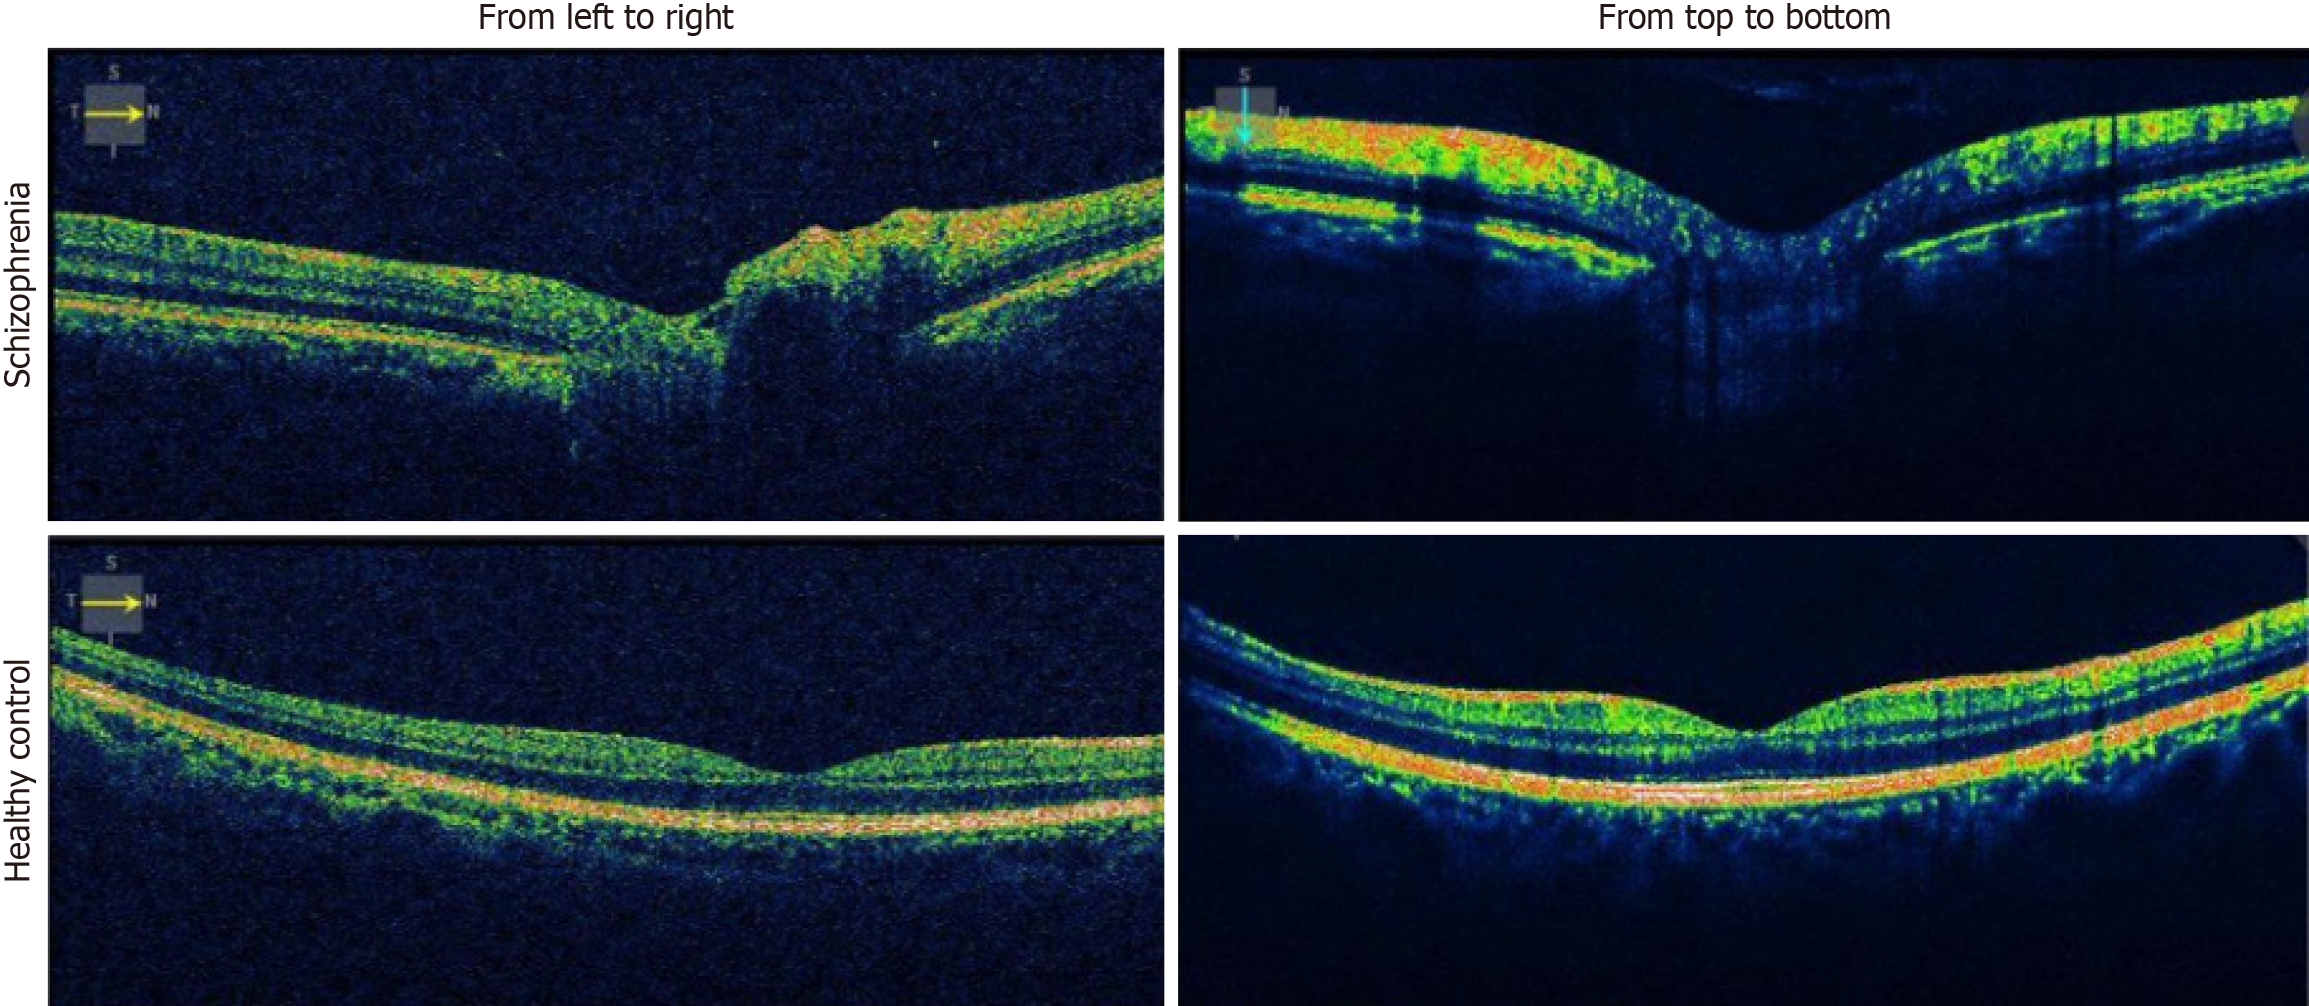
Figure 3
Sample images from the collected dataset.
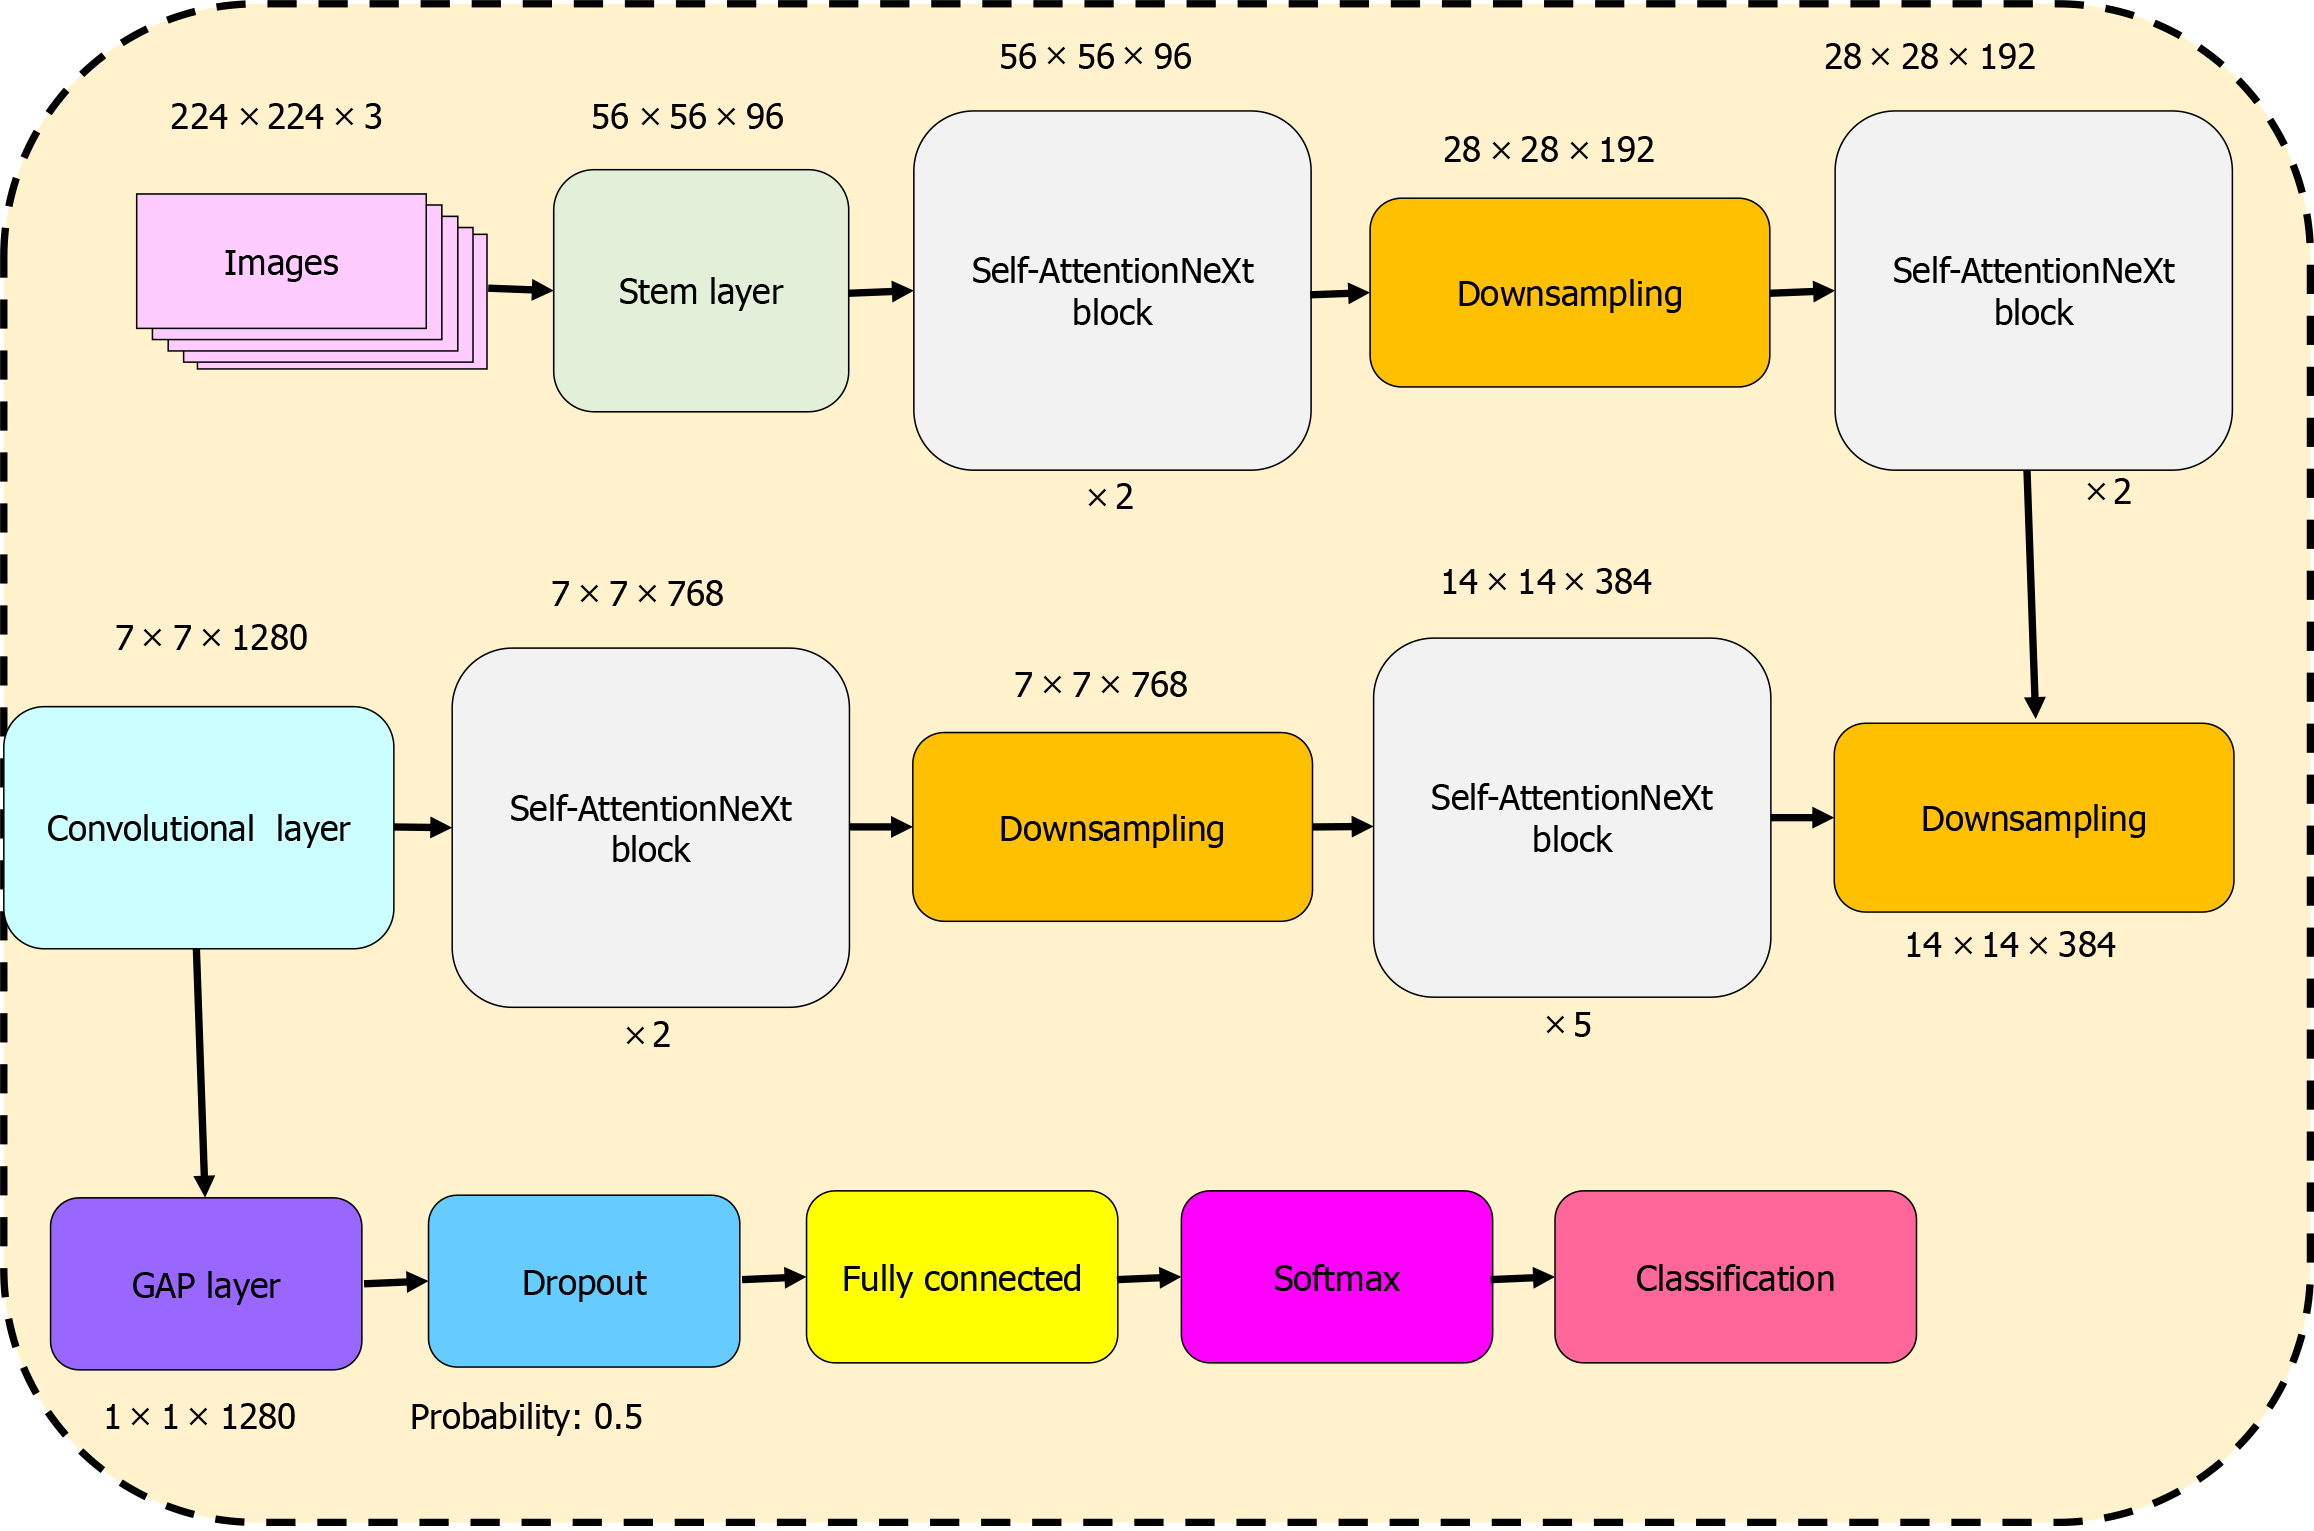
Figure 4 Block diagram of the proposed Self-AttentionNeXt.
Dropout layer was used to mitigate overfitting. GAP: Global average pooling.
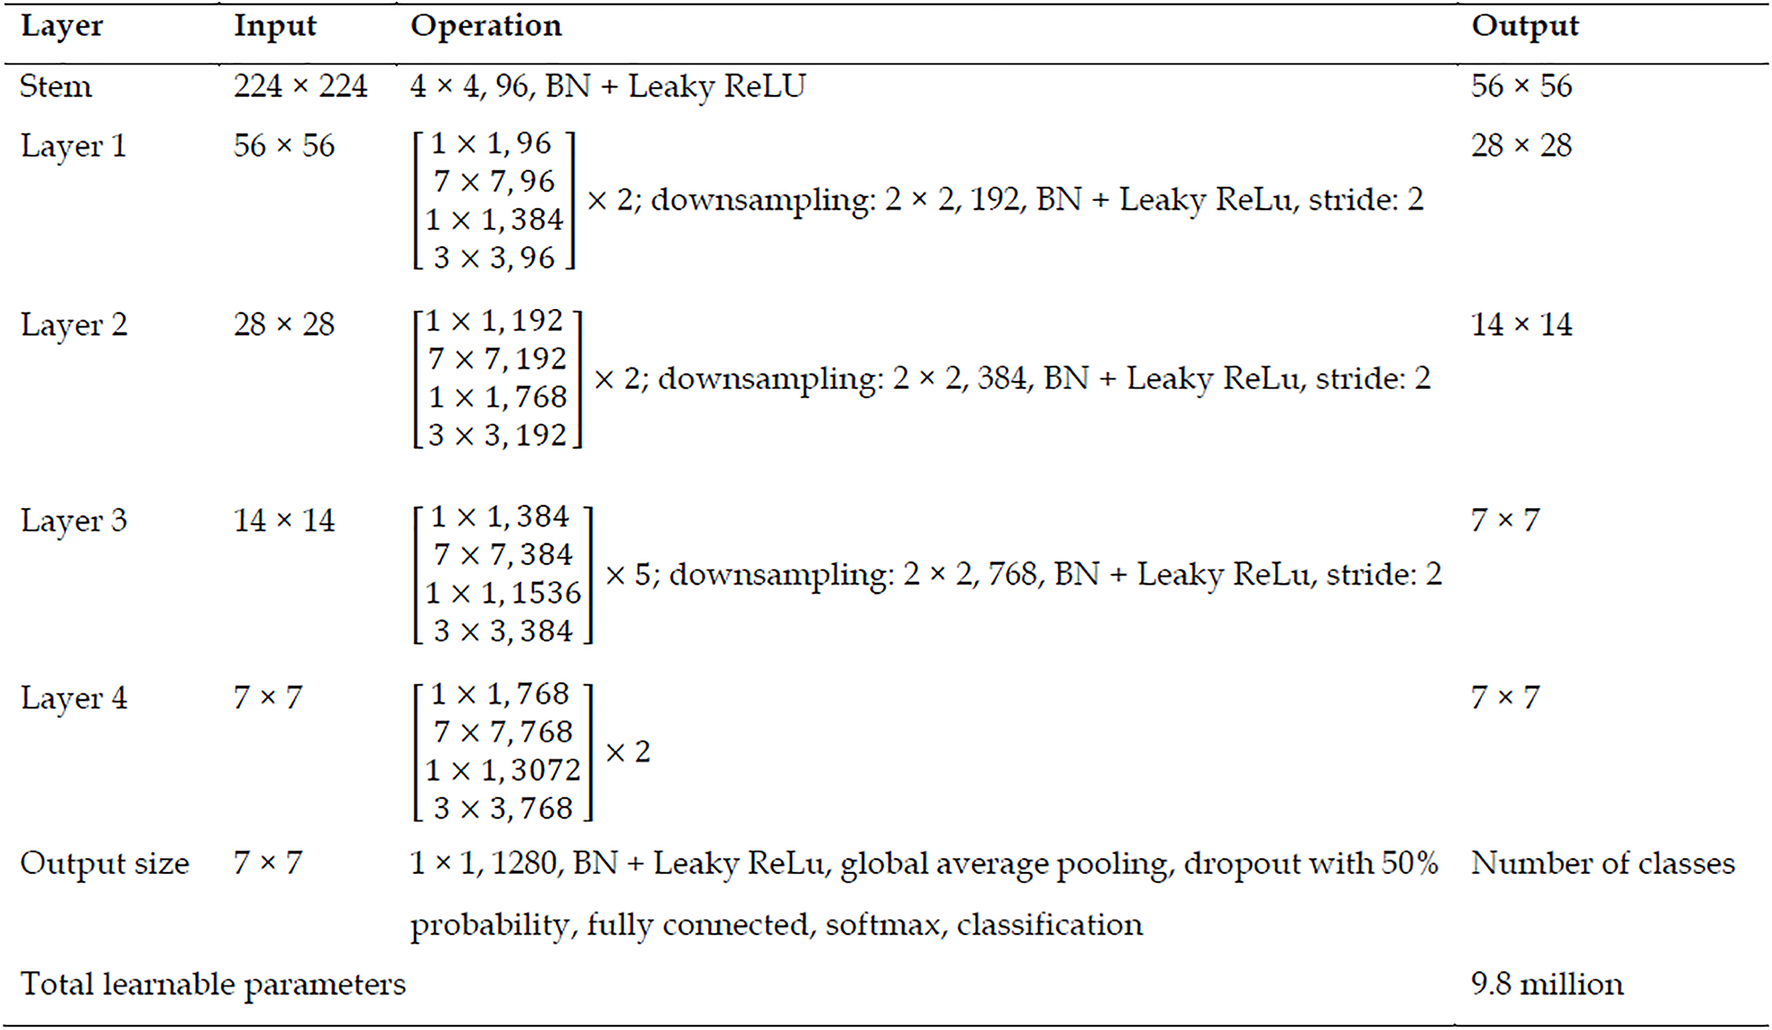
Figure 5 Detailed specification of the recommended Self-AttentionNeXt.
BN: Batch normalization.
Figure 6 Training and validation curves of the collected dataset and the Mendeley dataset.
A: From left to right case of our collected dataset. Training accuracy: 100%, validation accuracy: 8.03%; B: From top to bottom case of our collected dataset. Training accuracy: 100%, validation accuracy: 7.75%; C: Mendeley dataset (OCT2017). Training accuracy: 98.44%, validation accuracy: 89.85%.
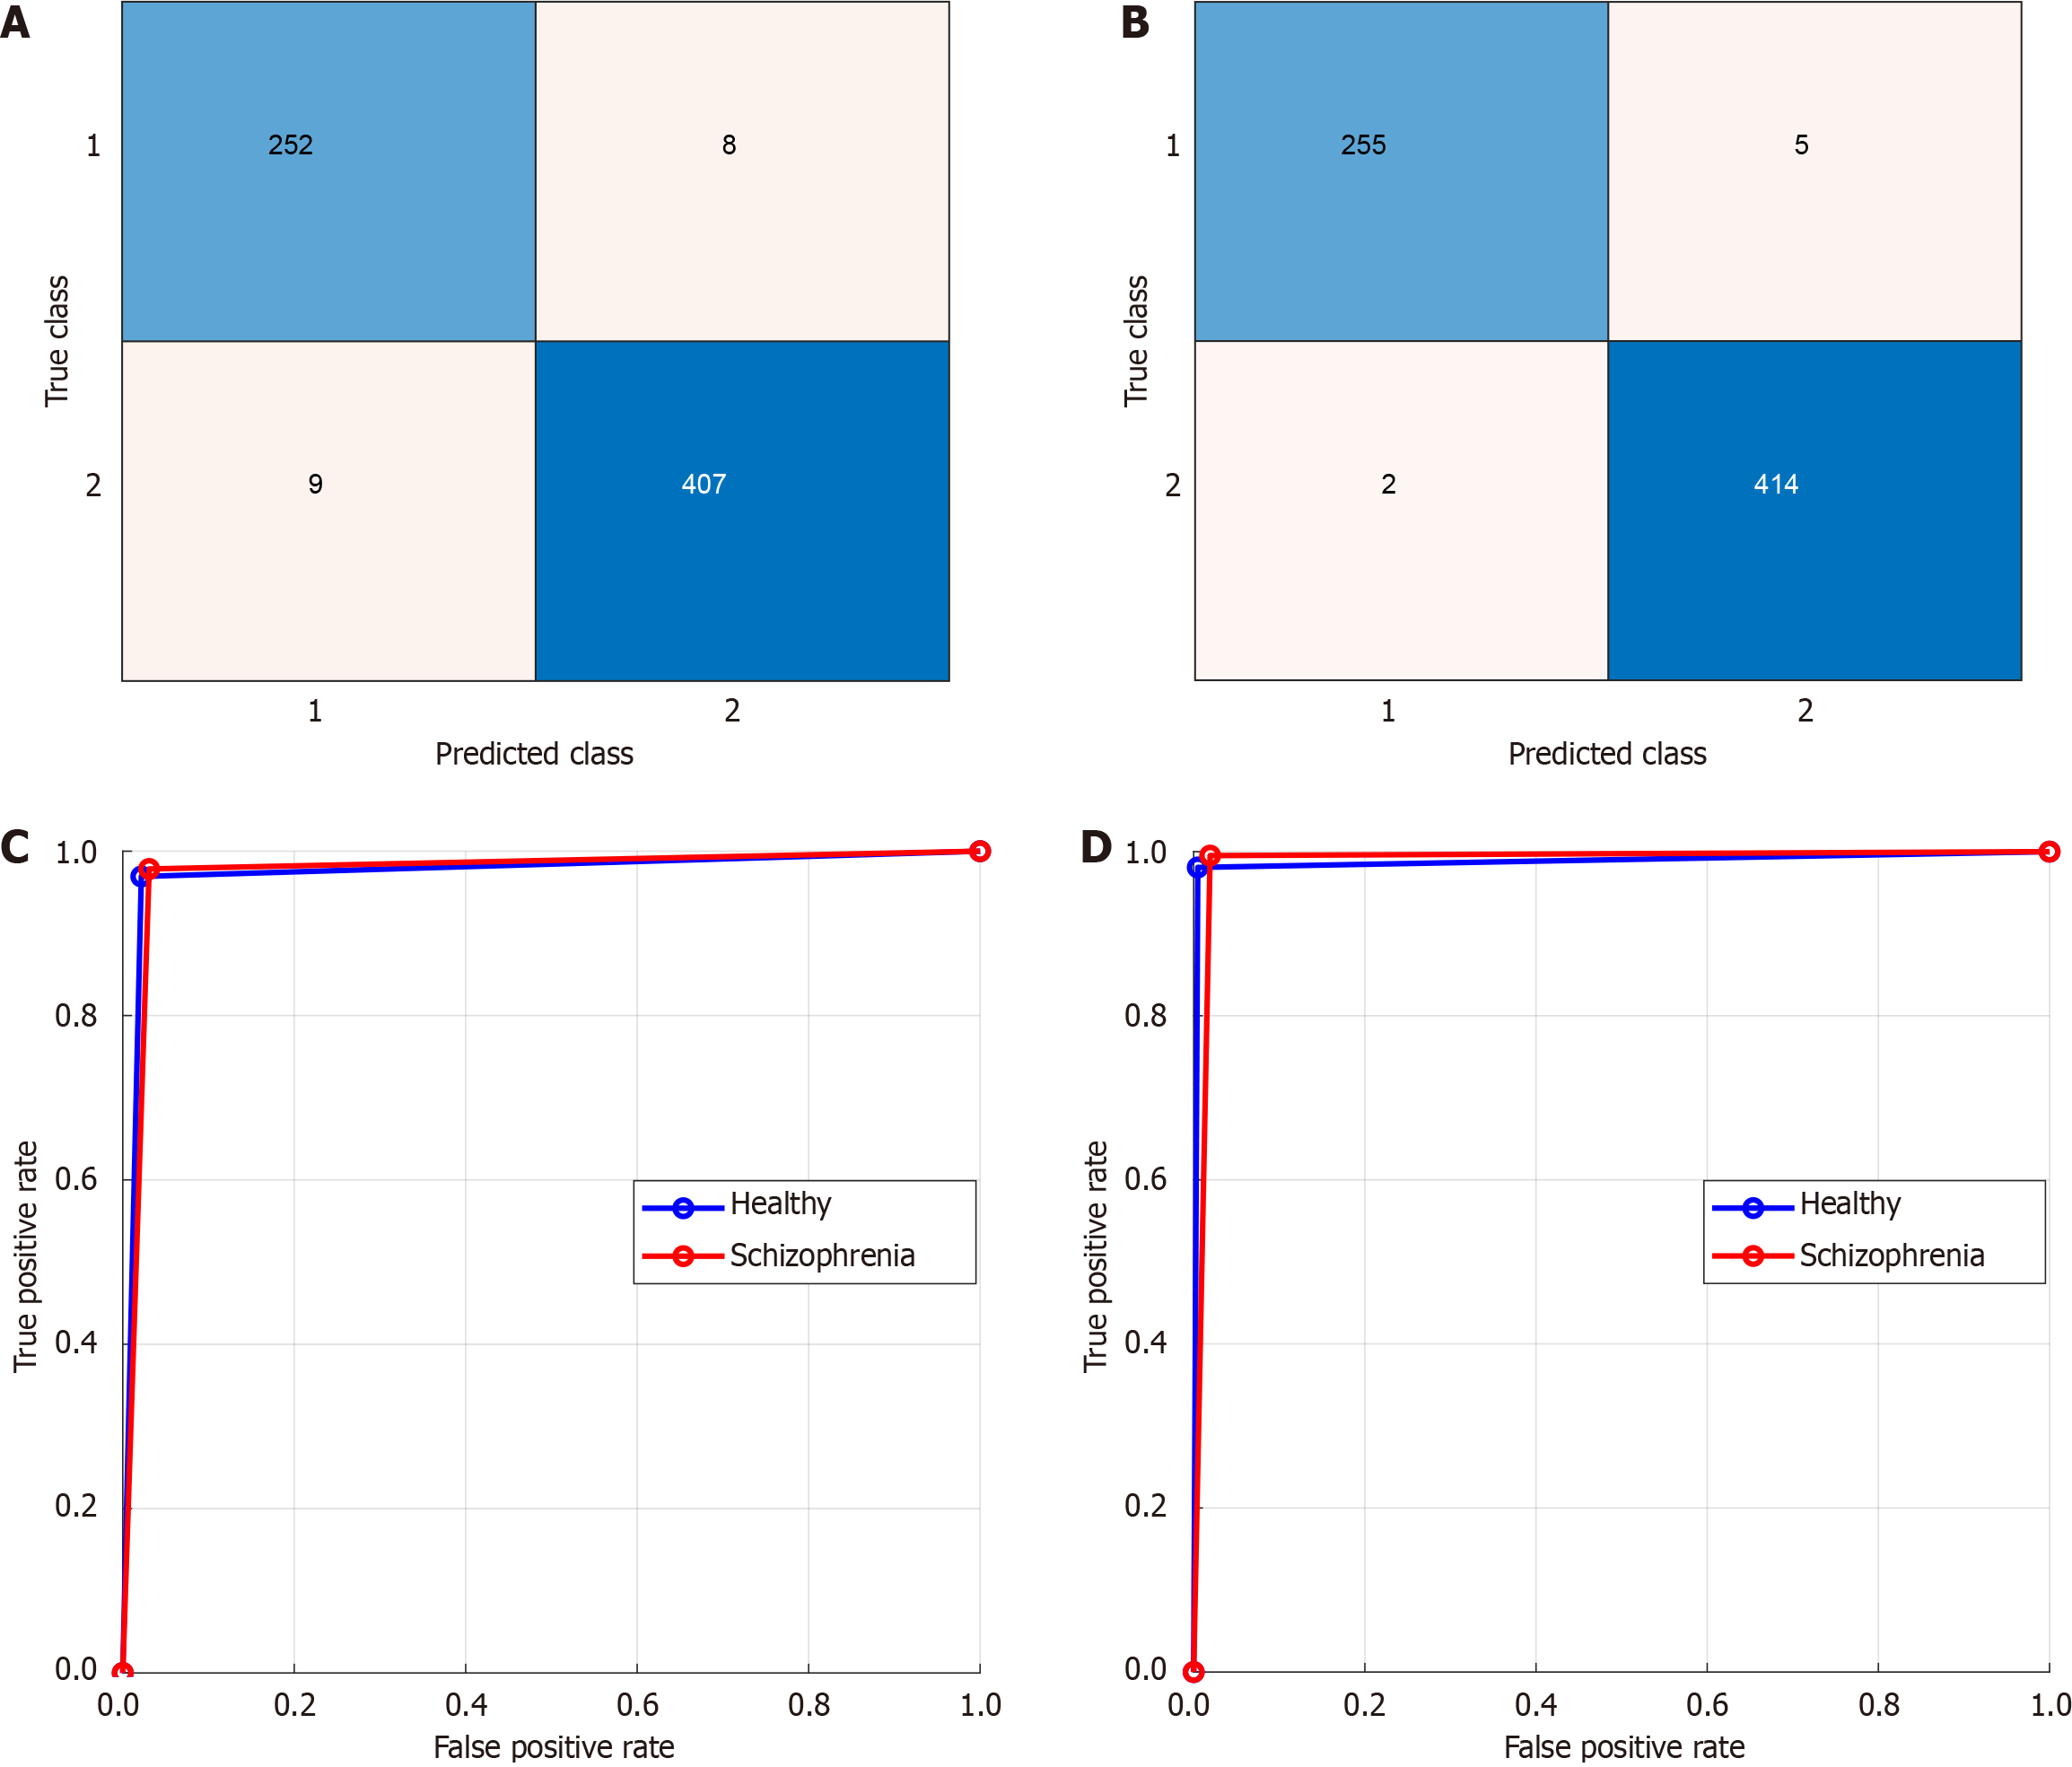
Figure 7 Confusion matrices and receiver operating curve for the collected dataset.
A: Confusion matrices of from left to right; B: Confusion matrices of from top to bottom; C: Receiver operating curve of from left to right; D: Receiver operating curve of from top to bottom. 1: Healthy; 2: Schizophrenia.
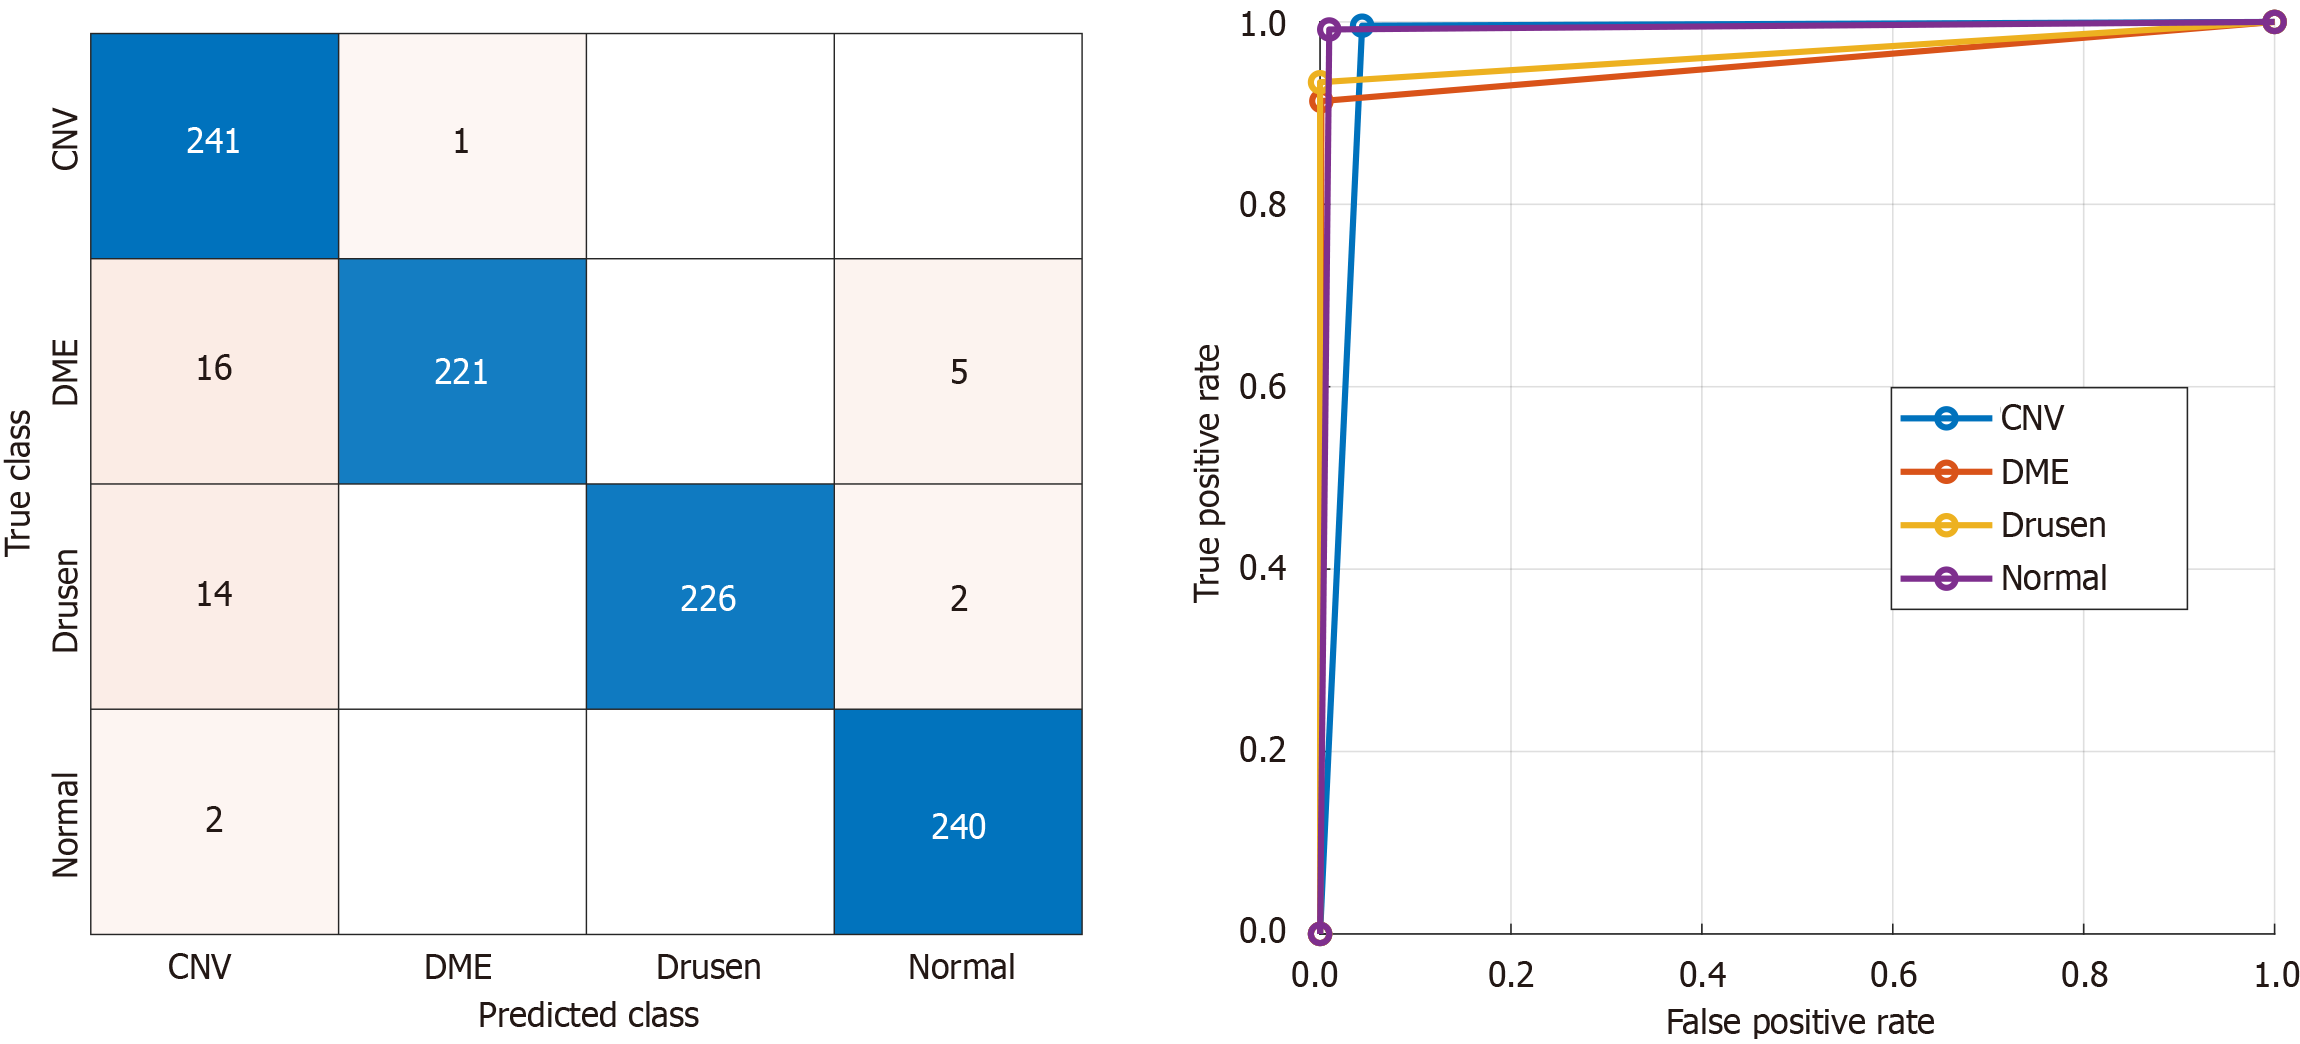
Figure 8 Confusion matrix and receiver operating curve for the Mendeley dataset.
CNV: Choroidal neovascularization; DME: Diabetic macular edema.
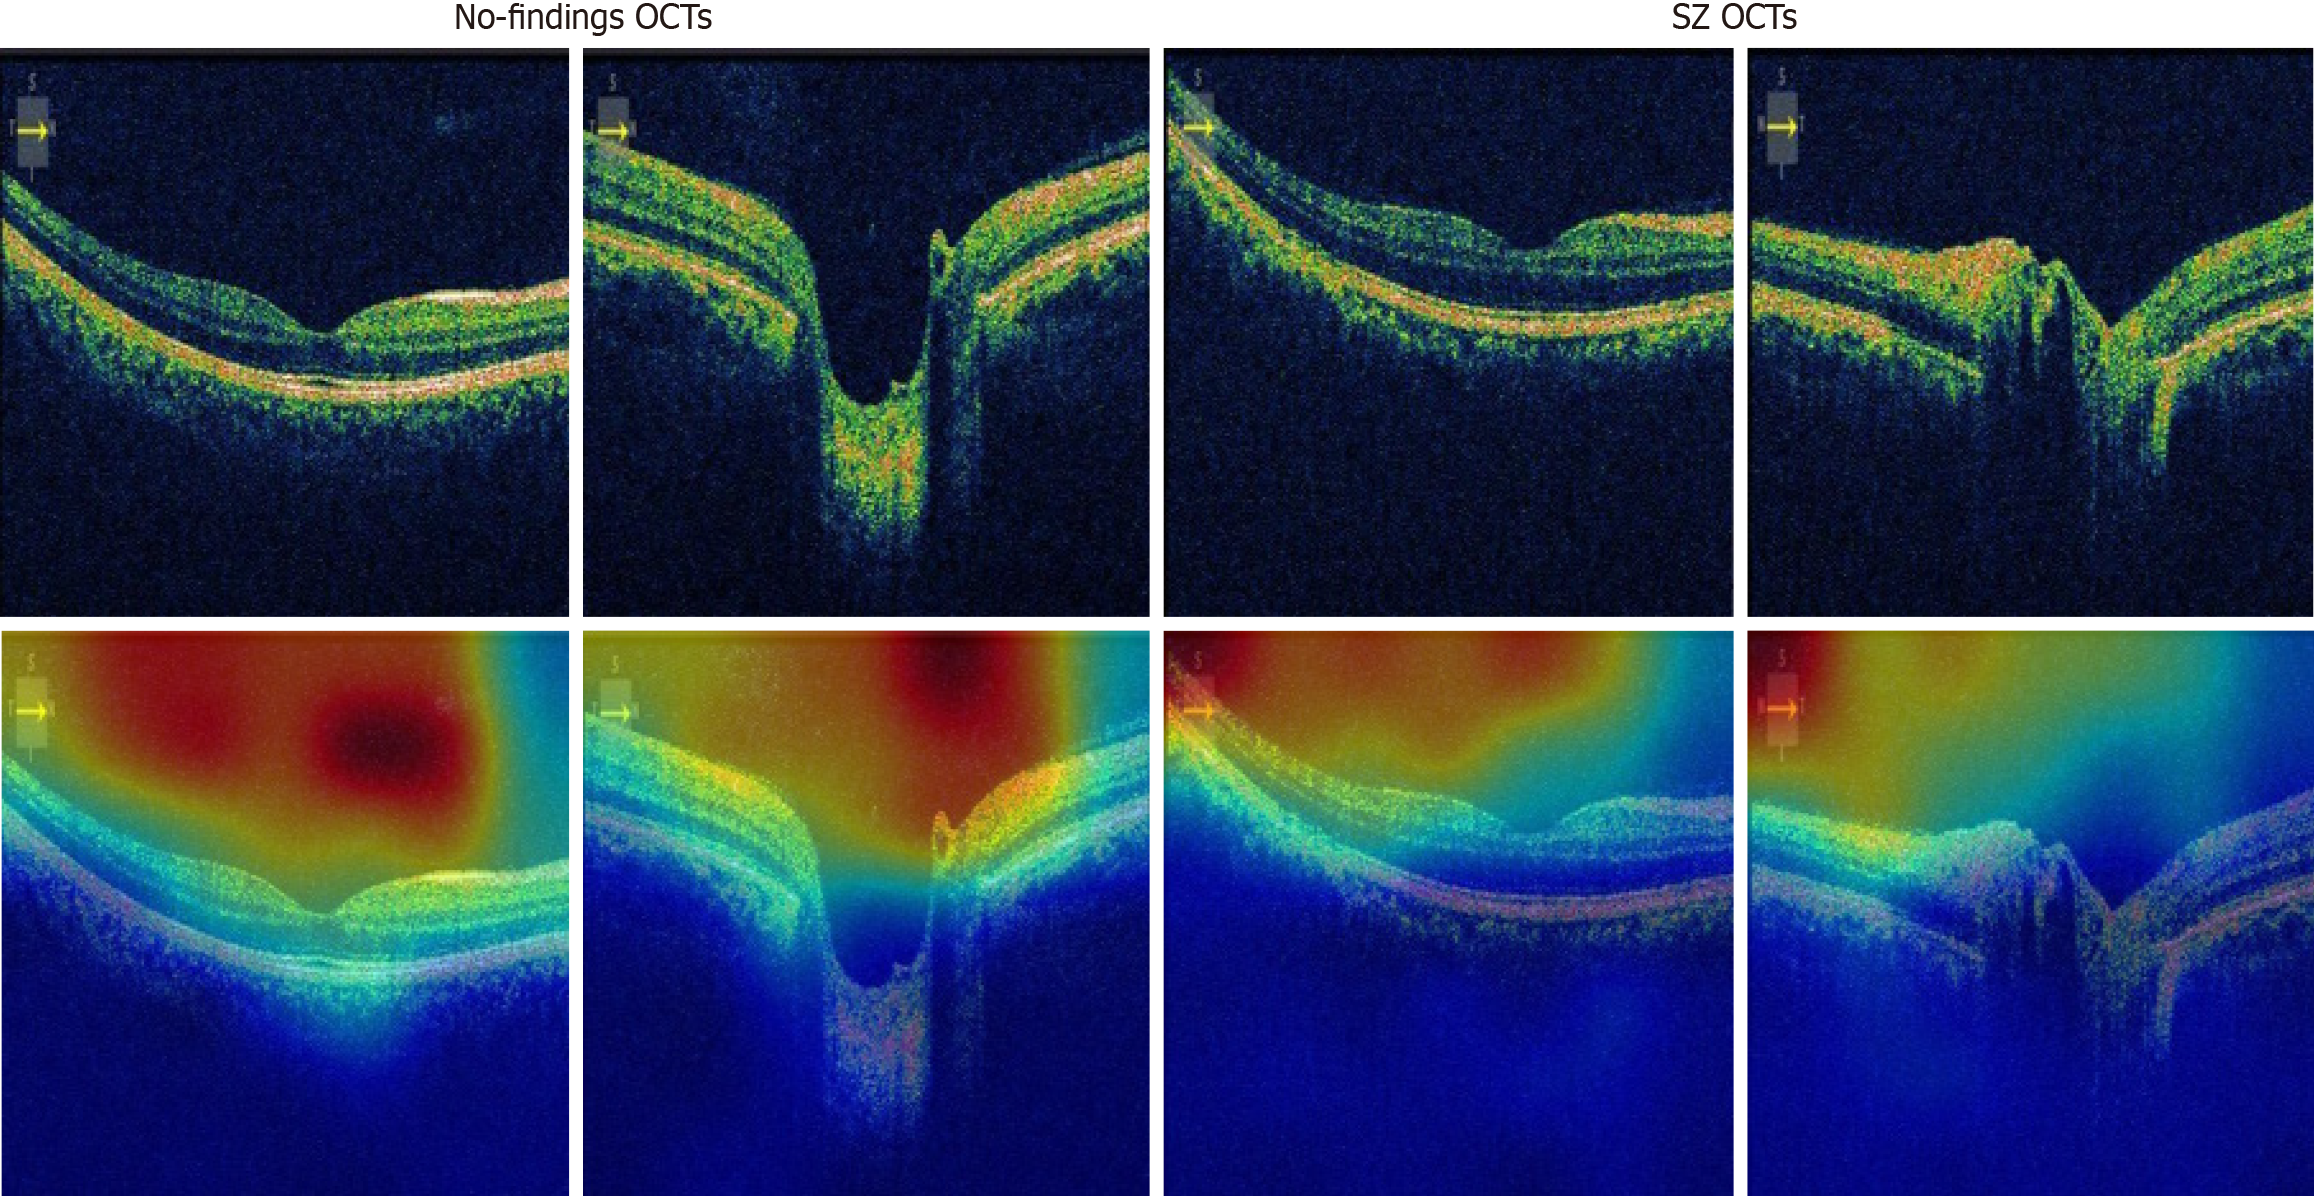
Figure 9 Heatmaps of the sample optical coherence tomography images.
OCT: Optical coherence tomography; SZ: Schizophrenia.
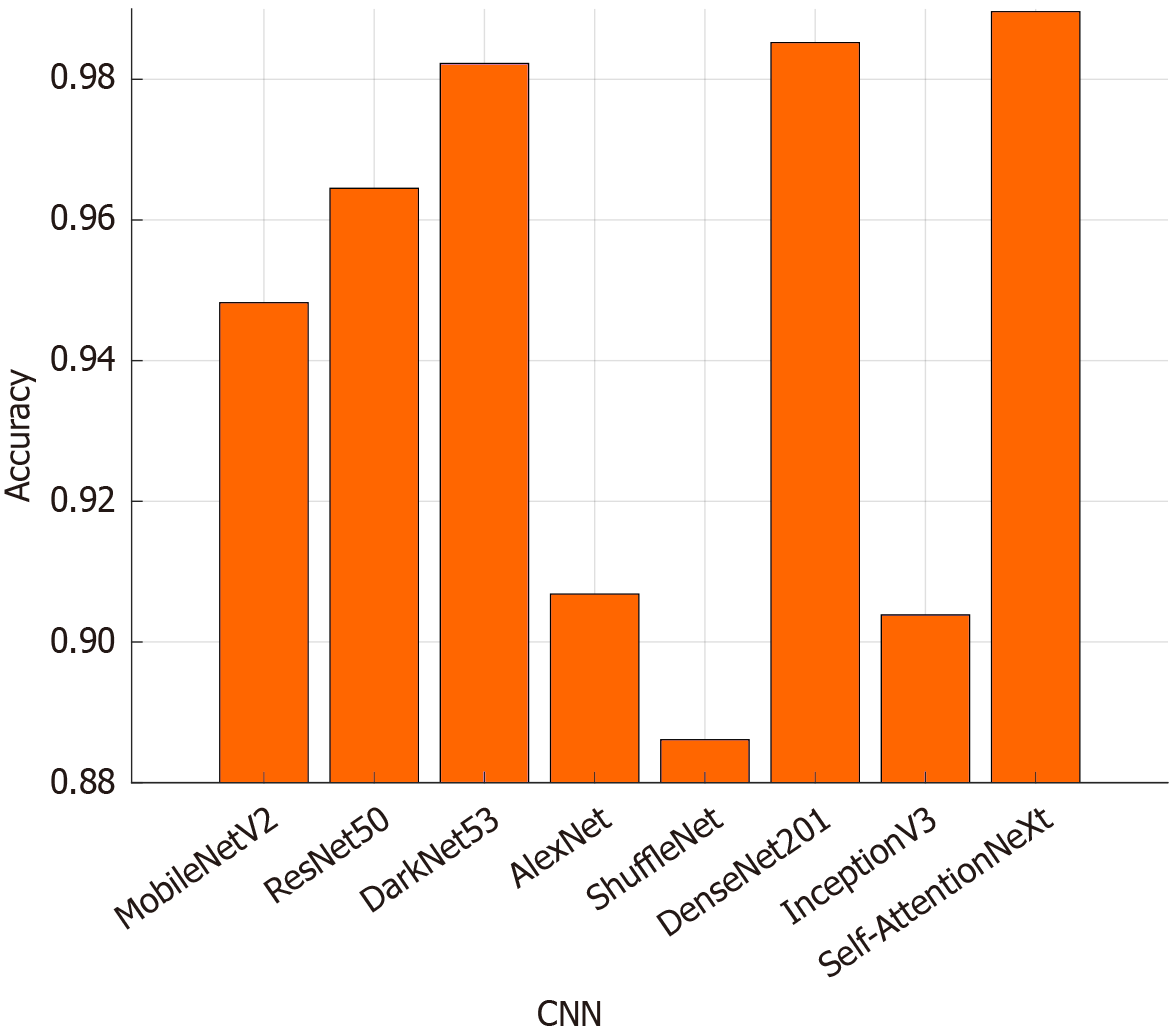
Figure 10 Comparison with well-known convolutional neural networks.
CNN: Convolutional neural network.
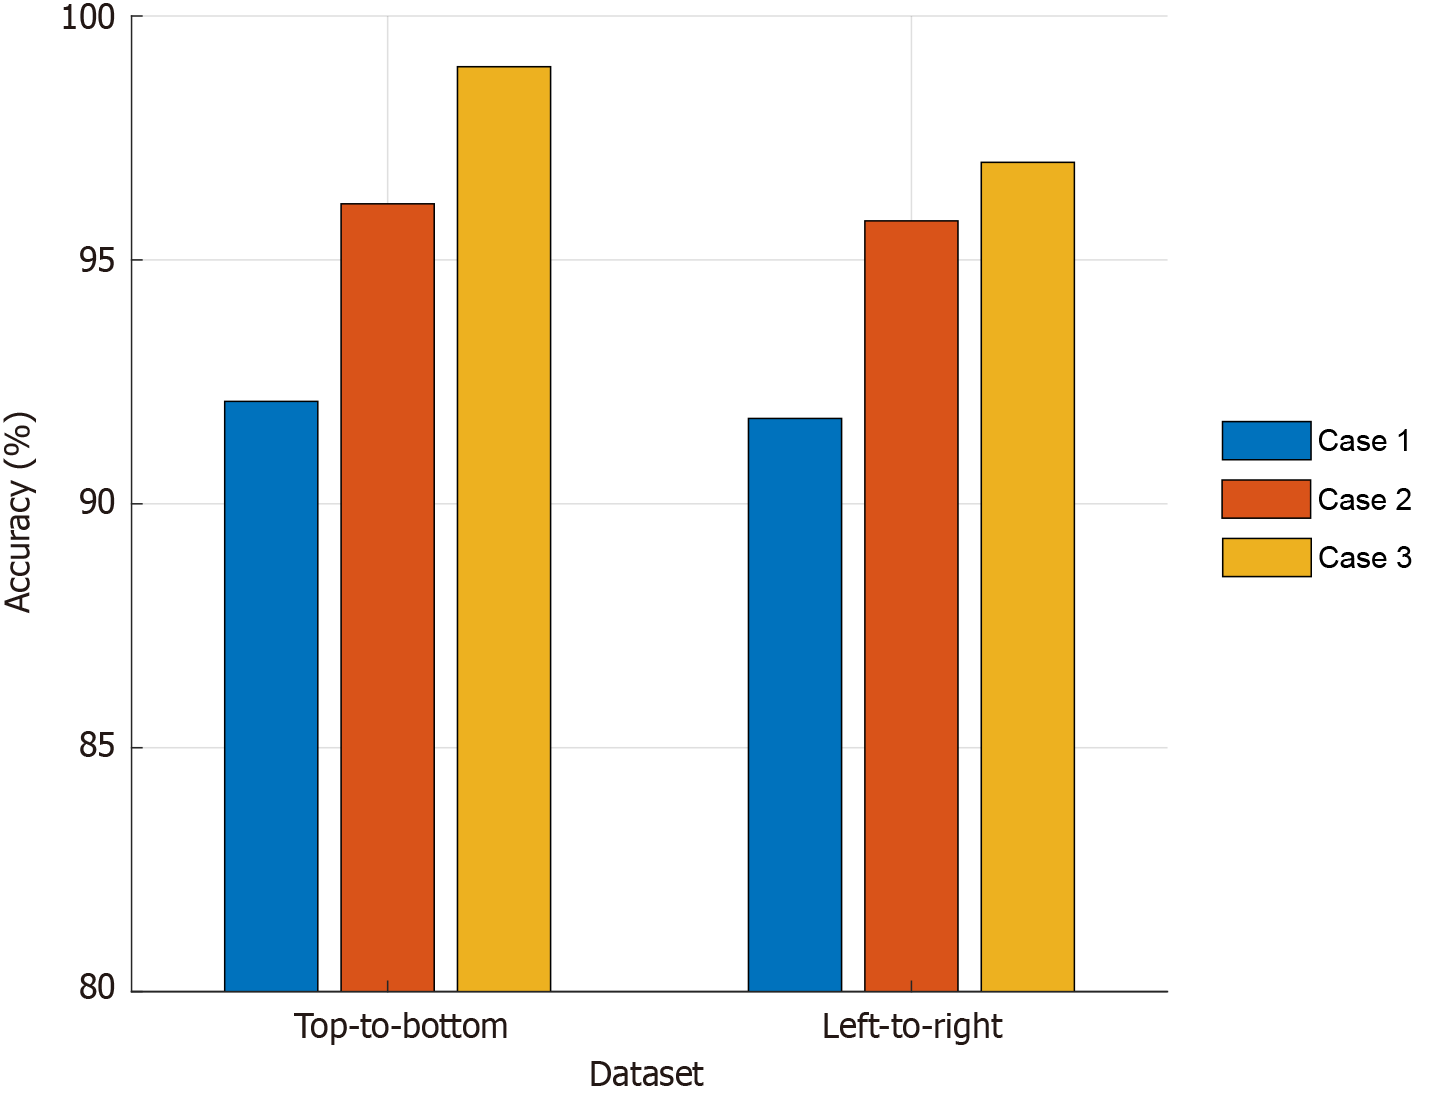
Figure 11
Classification accuracies of the utilized cases on the utilized both datasets.
- Citation: Kaya MK, Arslan S, Kaya S, Tasci G, Tasci B, Ozsoy F, Dogan S, Tuncer T. Self-AttentionNeXt: Exploring schizophrenic optical coherence tomography image detection investigations. World J Psychiatry 2025; 15(9): 108359
- URL: https://www.wjgnet.com/2220-3206/full/v15/i9/108359.htm
- DOI: https://dx.doi.org/10.5498/wjp.v15.i9.108359


