©The Author(s) 2025.
World J Psychiatry. Jul 19, 2025; 15(7): 104921
Published online Jul 19, 2025. doi: 10.5498/wjp.v15.i7.104921
Published online Jul 19, 2025. doi: 10.5498/wjp.v15.i7.104921
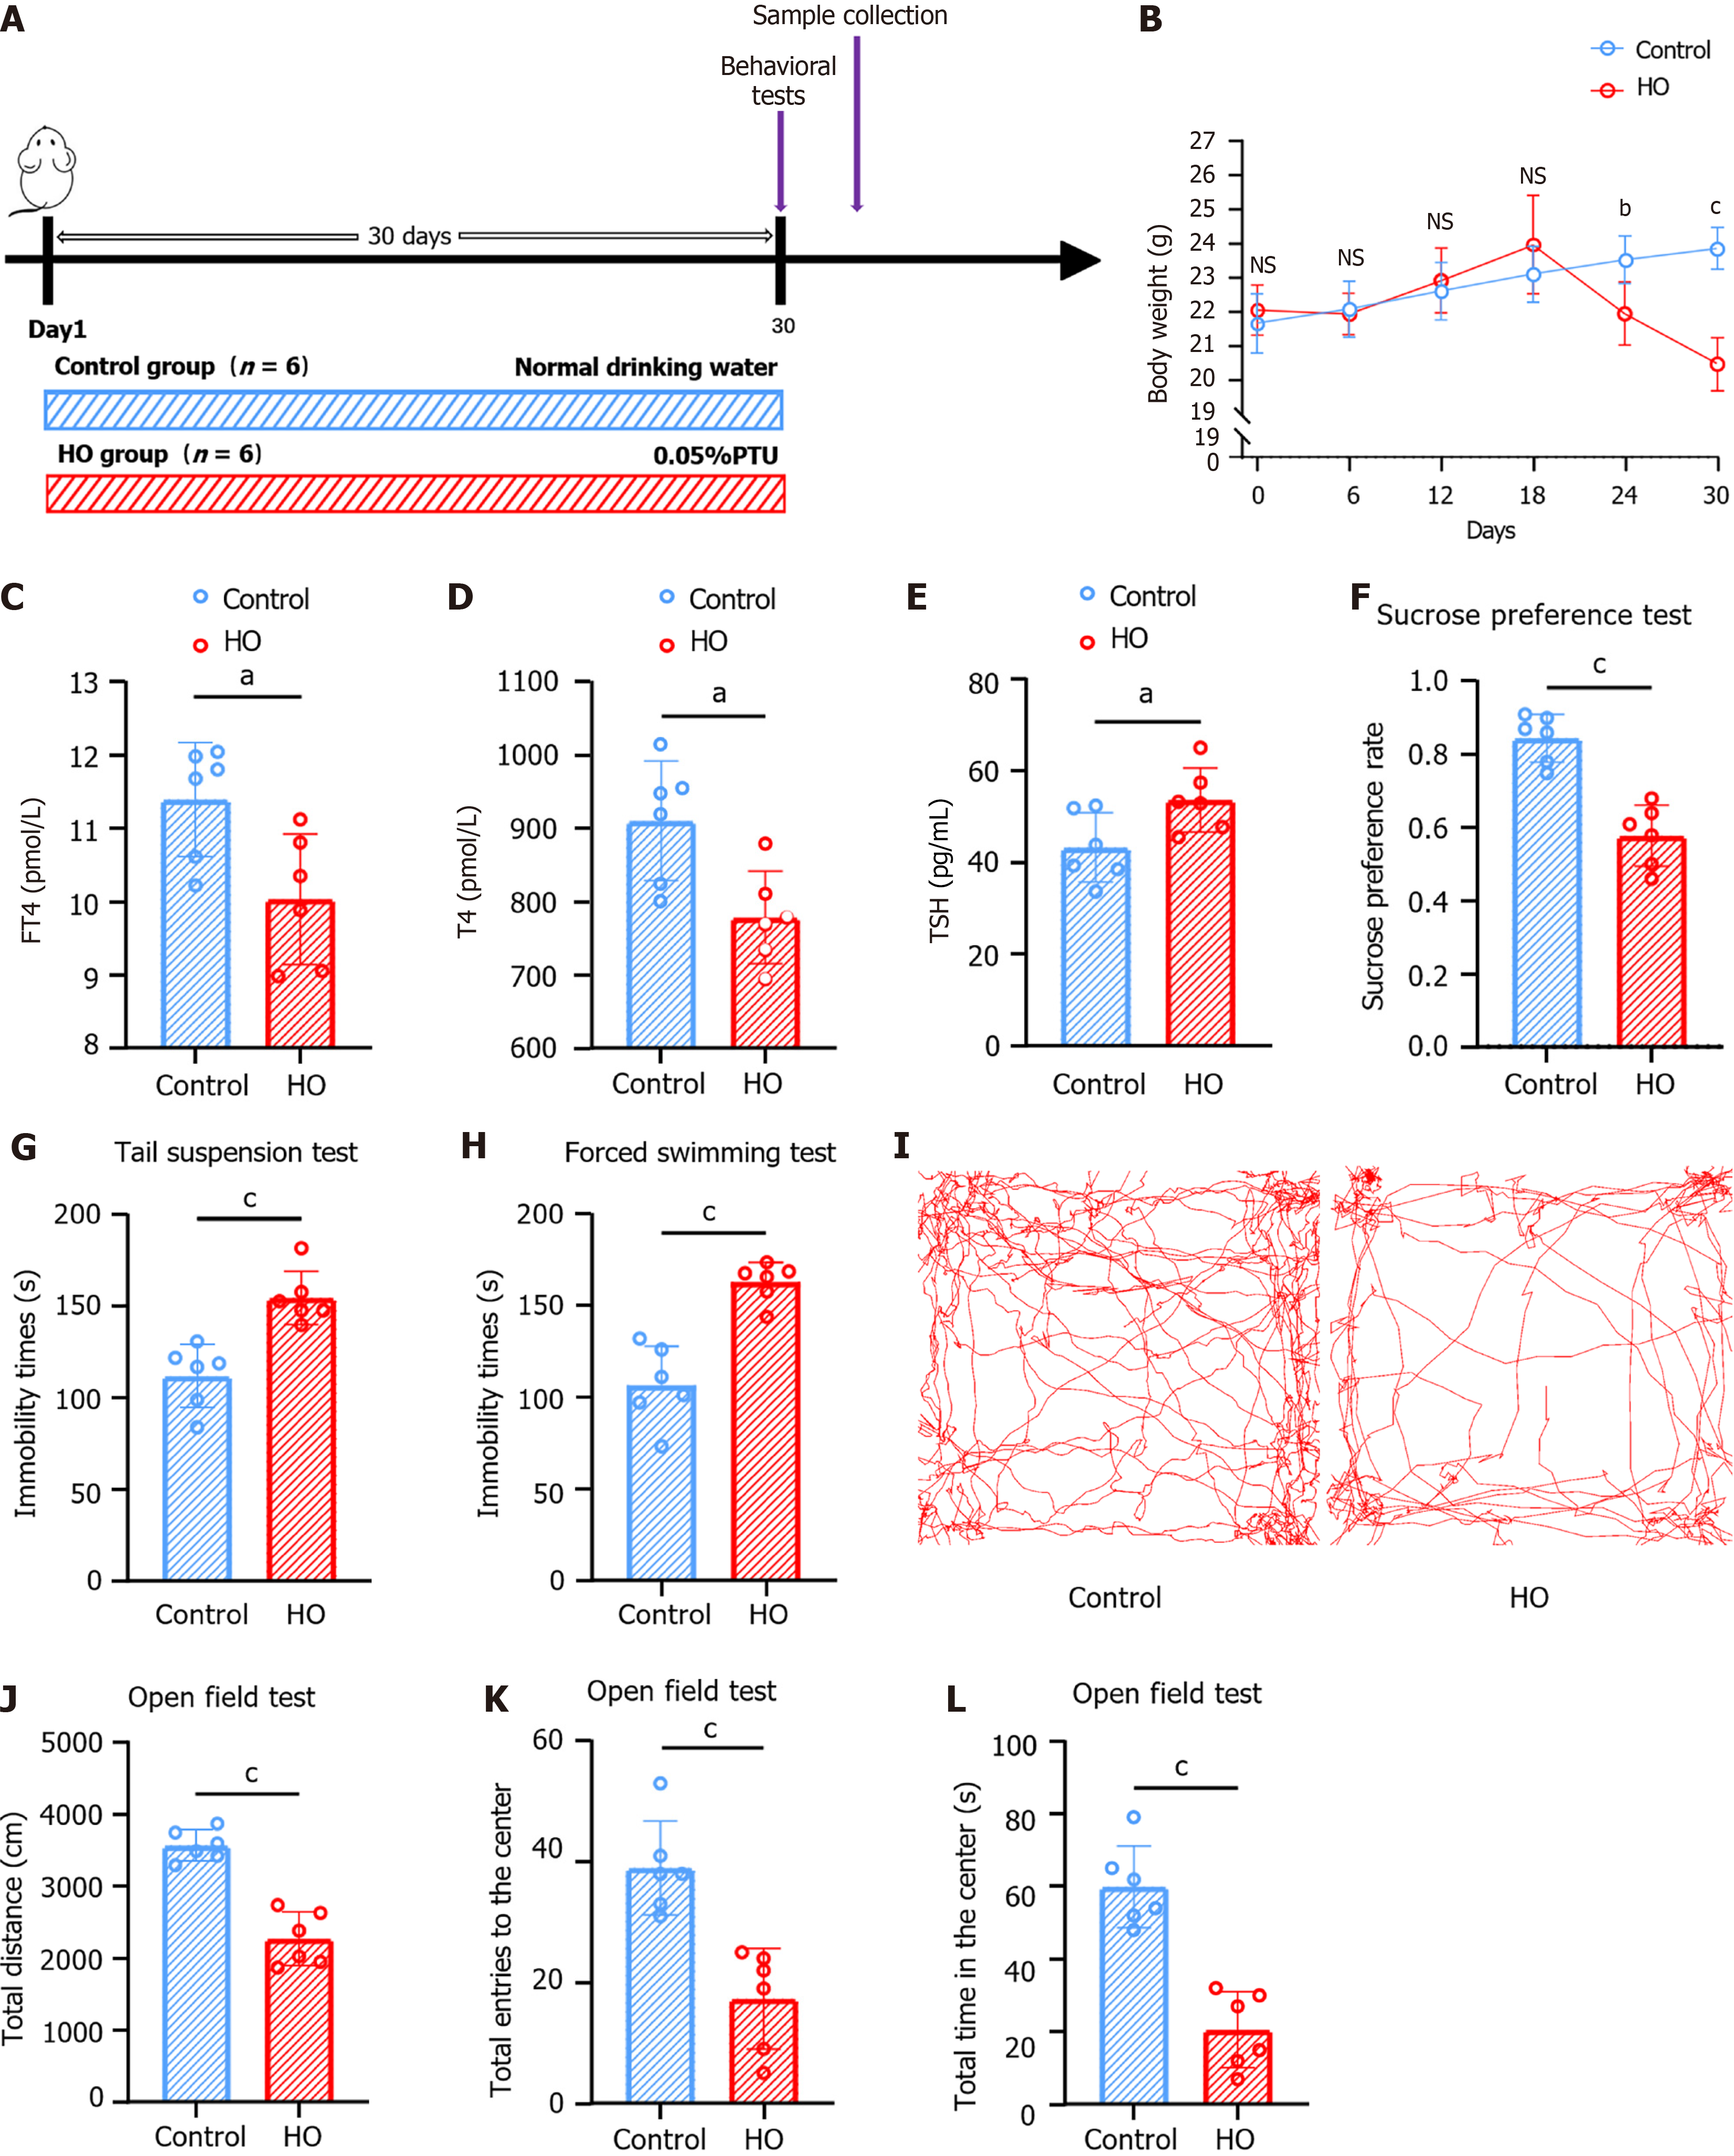
Figure 1 Mice with hypothyroidism exhibit depression-like behaviors.
A: Experimental setup: Mice were divided into control and hypothyroid groups (HO), with the HO group receiving propylthiouracil in their drinking water for 30 days; B: Body weight significantly decreased in the HO group over time; C-E: Hormonal analysis reveals reduced levels of free thyroxine and total thyroxine, and increased thyroid-stimulating hormone in the HO group, confirming hypothyroidism; F: The sucrose preference test shows a reduced preference in the HO group, suggesting anhedonia; G and H: The tail suspension and forced swimming tests indicate increased immobility times in the HO group, reflecting depressive-like behavior; I: Movement paths in the open field test demonstrate reduced activity in the HO group; J-L: The open field test results show decreased total distance traveled, fewer entries into the center, and less time spent in the center for the HO group, indicating anxiety-like behavior. Results are depicted as mean ± SEM. aP < 0.05, bP < 0.01, cP < 0.001 indicate statistical significance. HO: Hypothyroid group; PTU: Propylthiouracil; T4: Thyroxine; FT4: Free thyroxine; TSH: Thyroid-stimulating hormone.
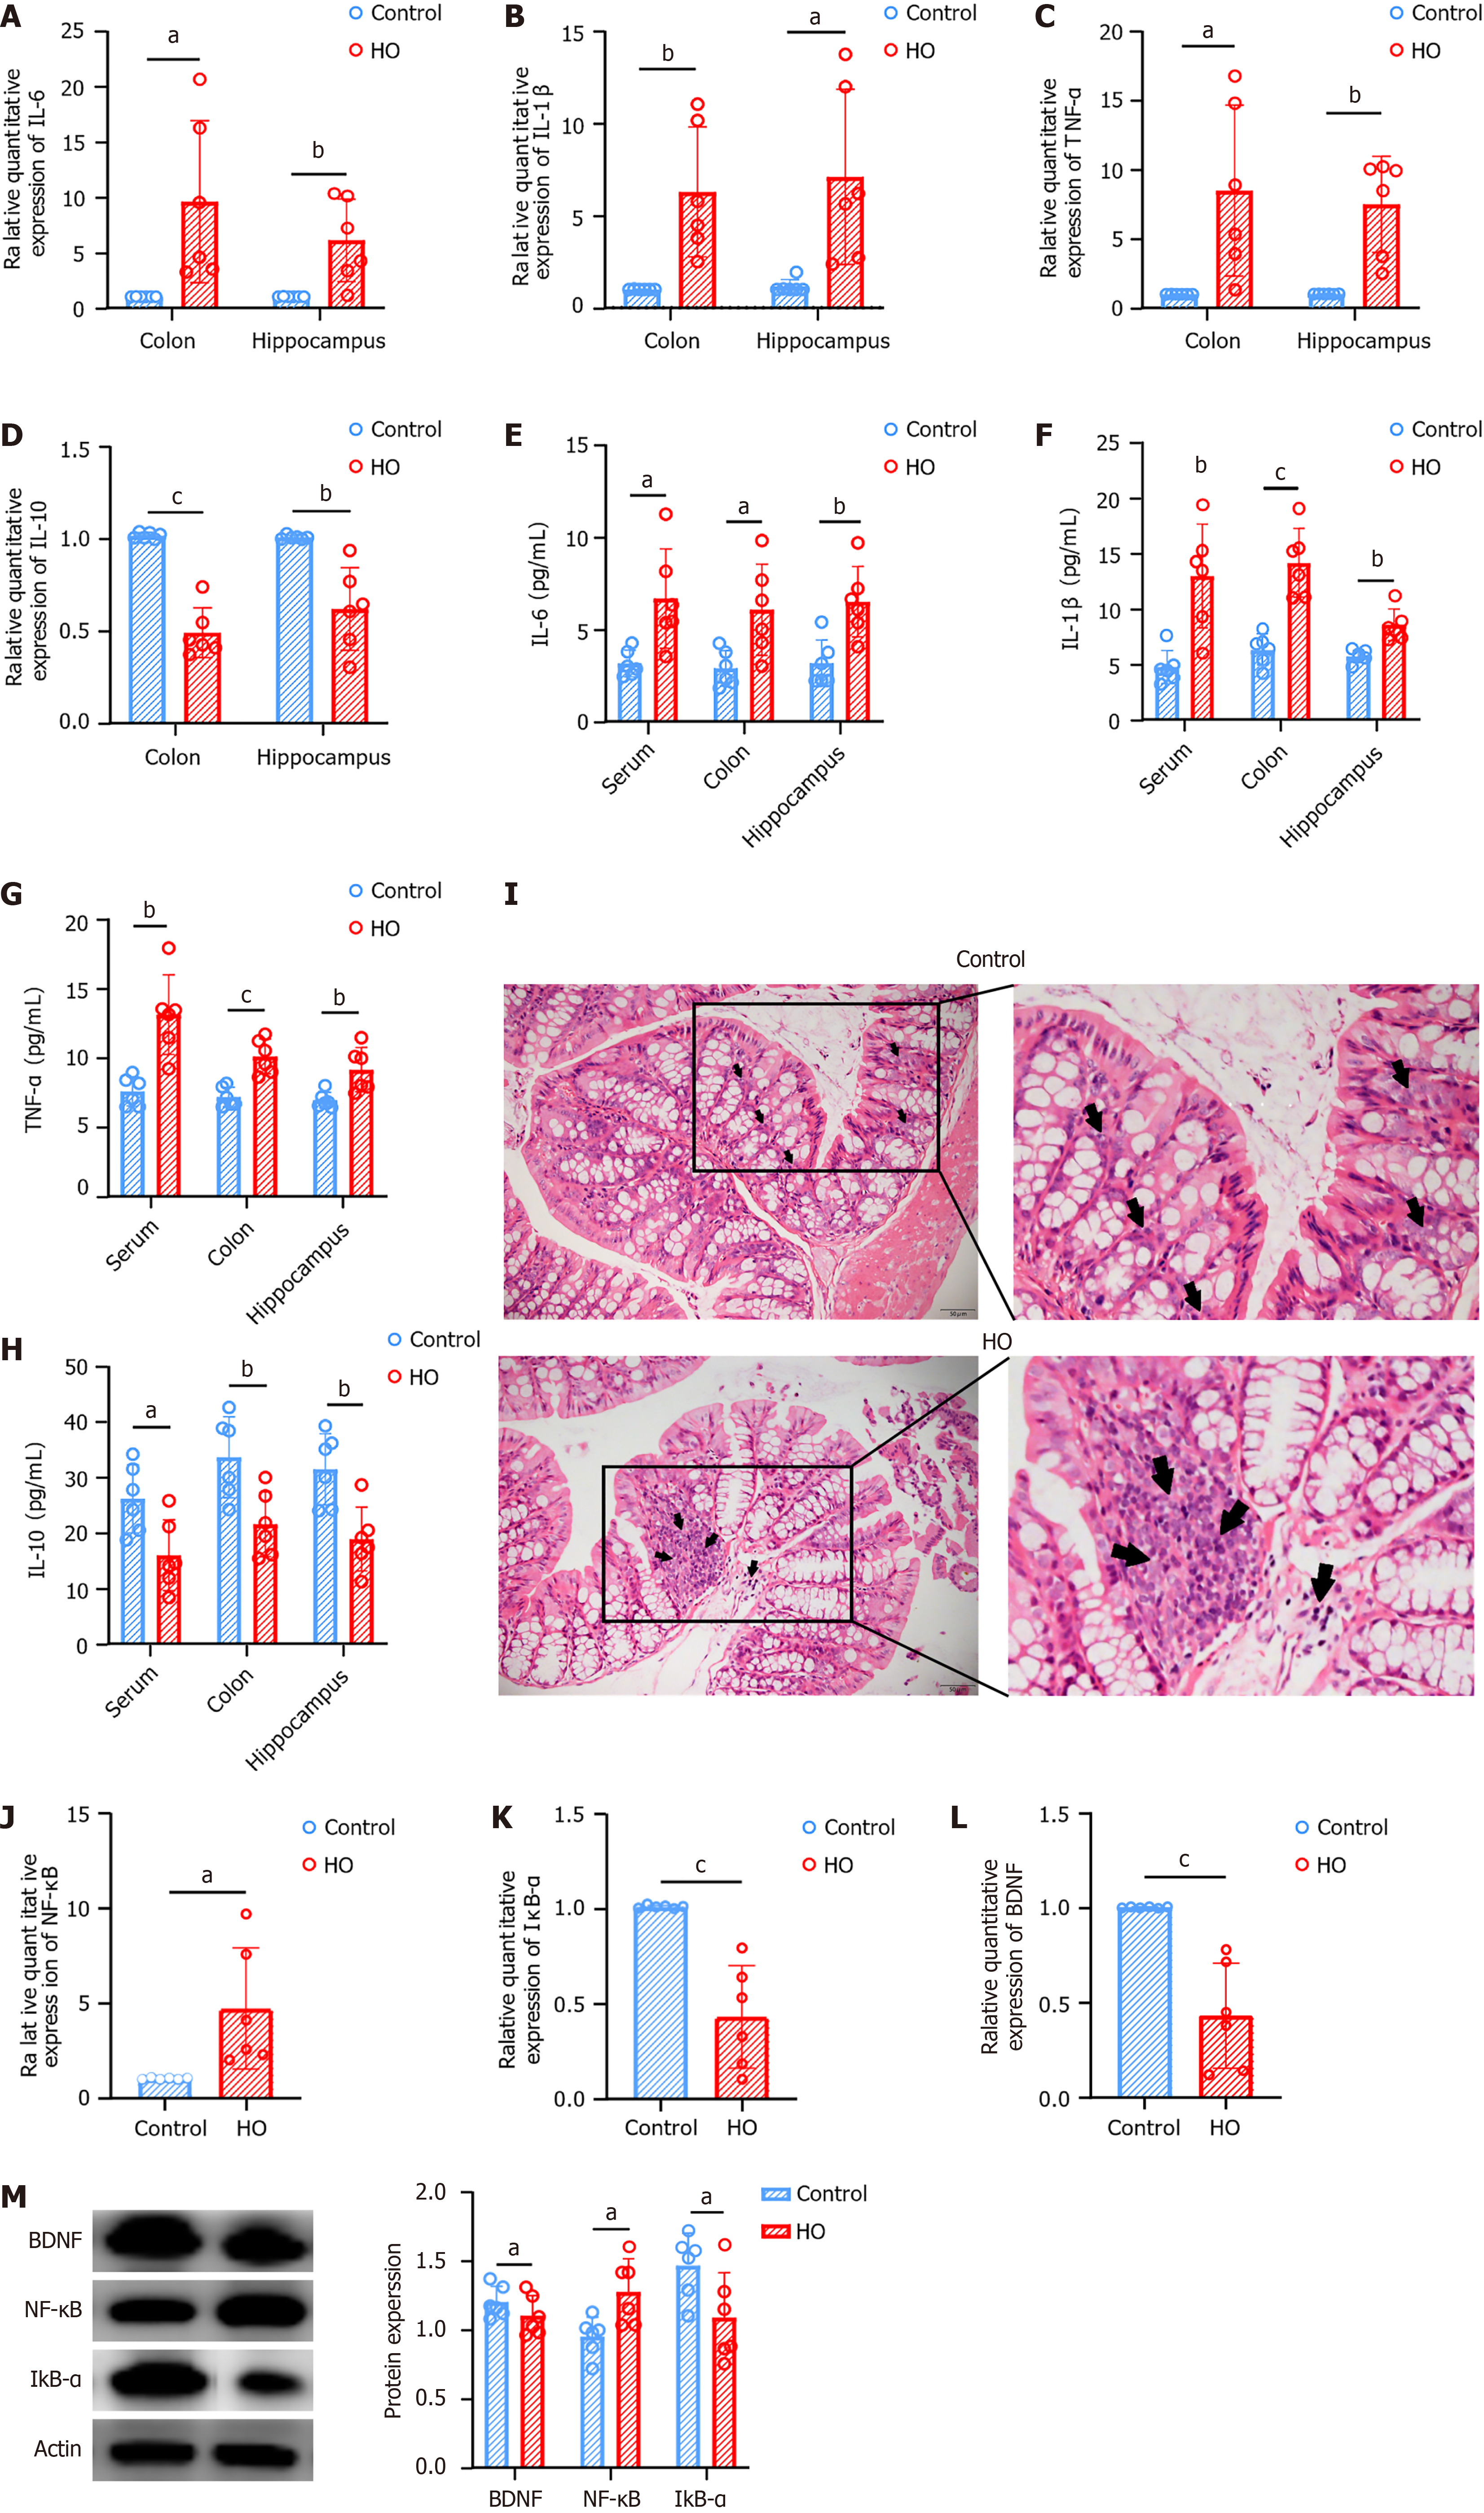
Figure 2 Inflammation is present in both peripheral and central regions of hypothyroid mice.
A-D: Quantitative polymerase chain reaction analysis reveals elevated levels of inflammatory cytokines [interleukin-6 (IL-6), IL-1β, tumor necrosis factor-α, IL-10] in both the colon and hippocampus of hypothyroid group (HO) mice; E-H: Enzyme linked immunosorbent assay results indicate higher concentrations of these cytokines in the serum, colon, and hippocampus of HO mice; I: Hematoxylin and eosin staining of colon tissue shows increased inflammatory cell infiltration in the HO group; J-L: Quantitative polymerase chain reaction demonstrates increased mRNA levels of nuclear factor κB (NF-κB) and decreased levels of inhibitor of NF-κB α and brain-derived neurotrophic factor in the hippocampus of HO mice; M: Western blot analysis confirms higher protein levels of NF-κB and lower levels of inhibitor of NF-κB α and brain-derived neurotrophic factor in the hippocampus. Results are presented as mean ± SEM, with aP < 0.05, bP < 0.01, cP < 0.001 indicating statistical significance. HO: Hypothyroid group; IL: Interleukin; TNF: Tumor necrosis factor; NF-κB: Nuclear factor κB; IκB: Inhibitor of nuclear factor κB; BDNF: Brain-derived neurotrophic factor.
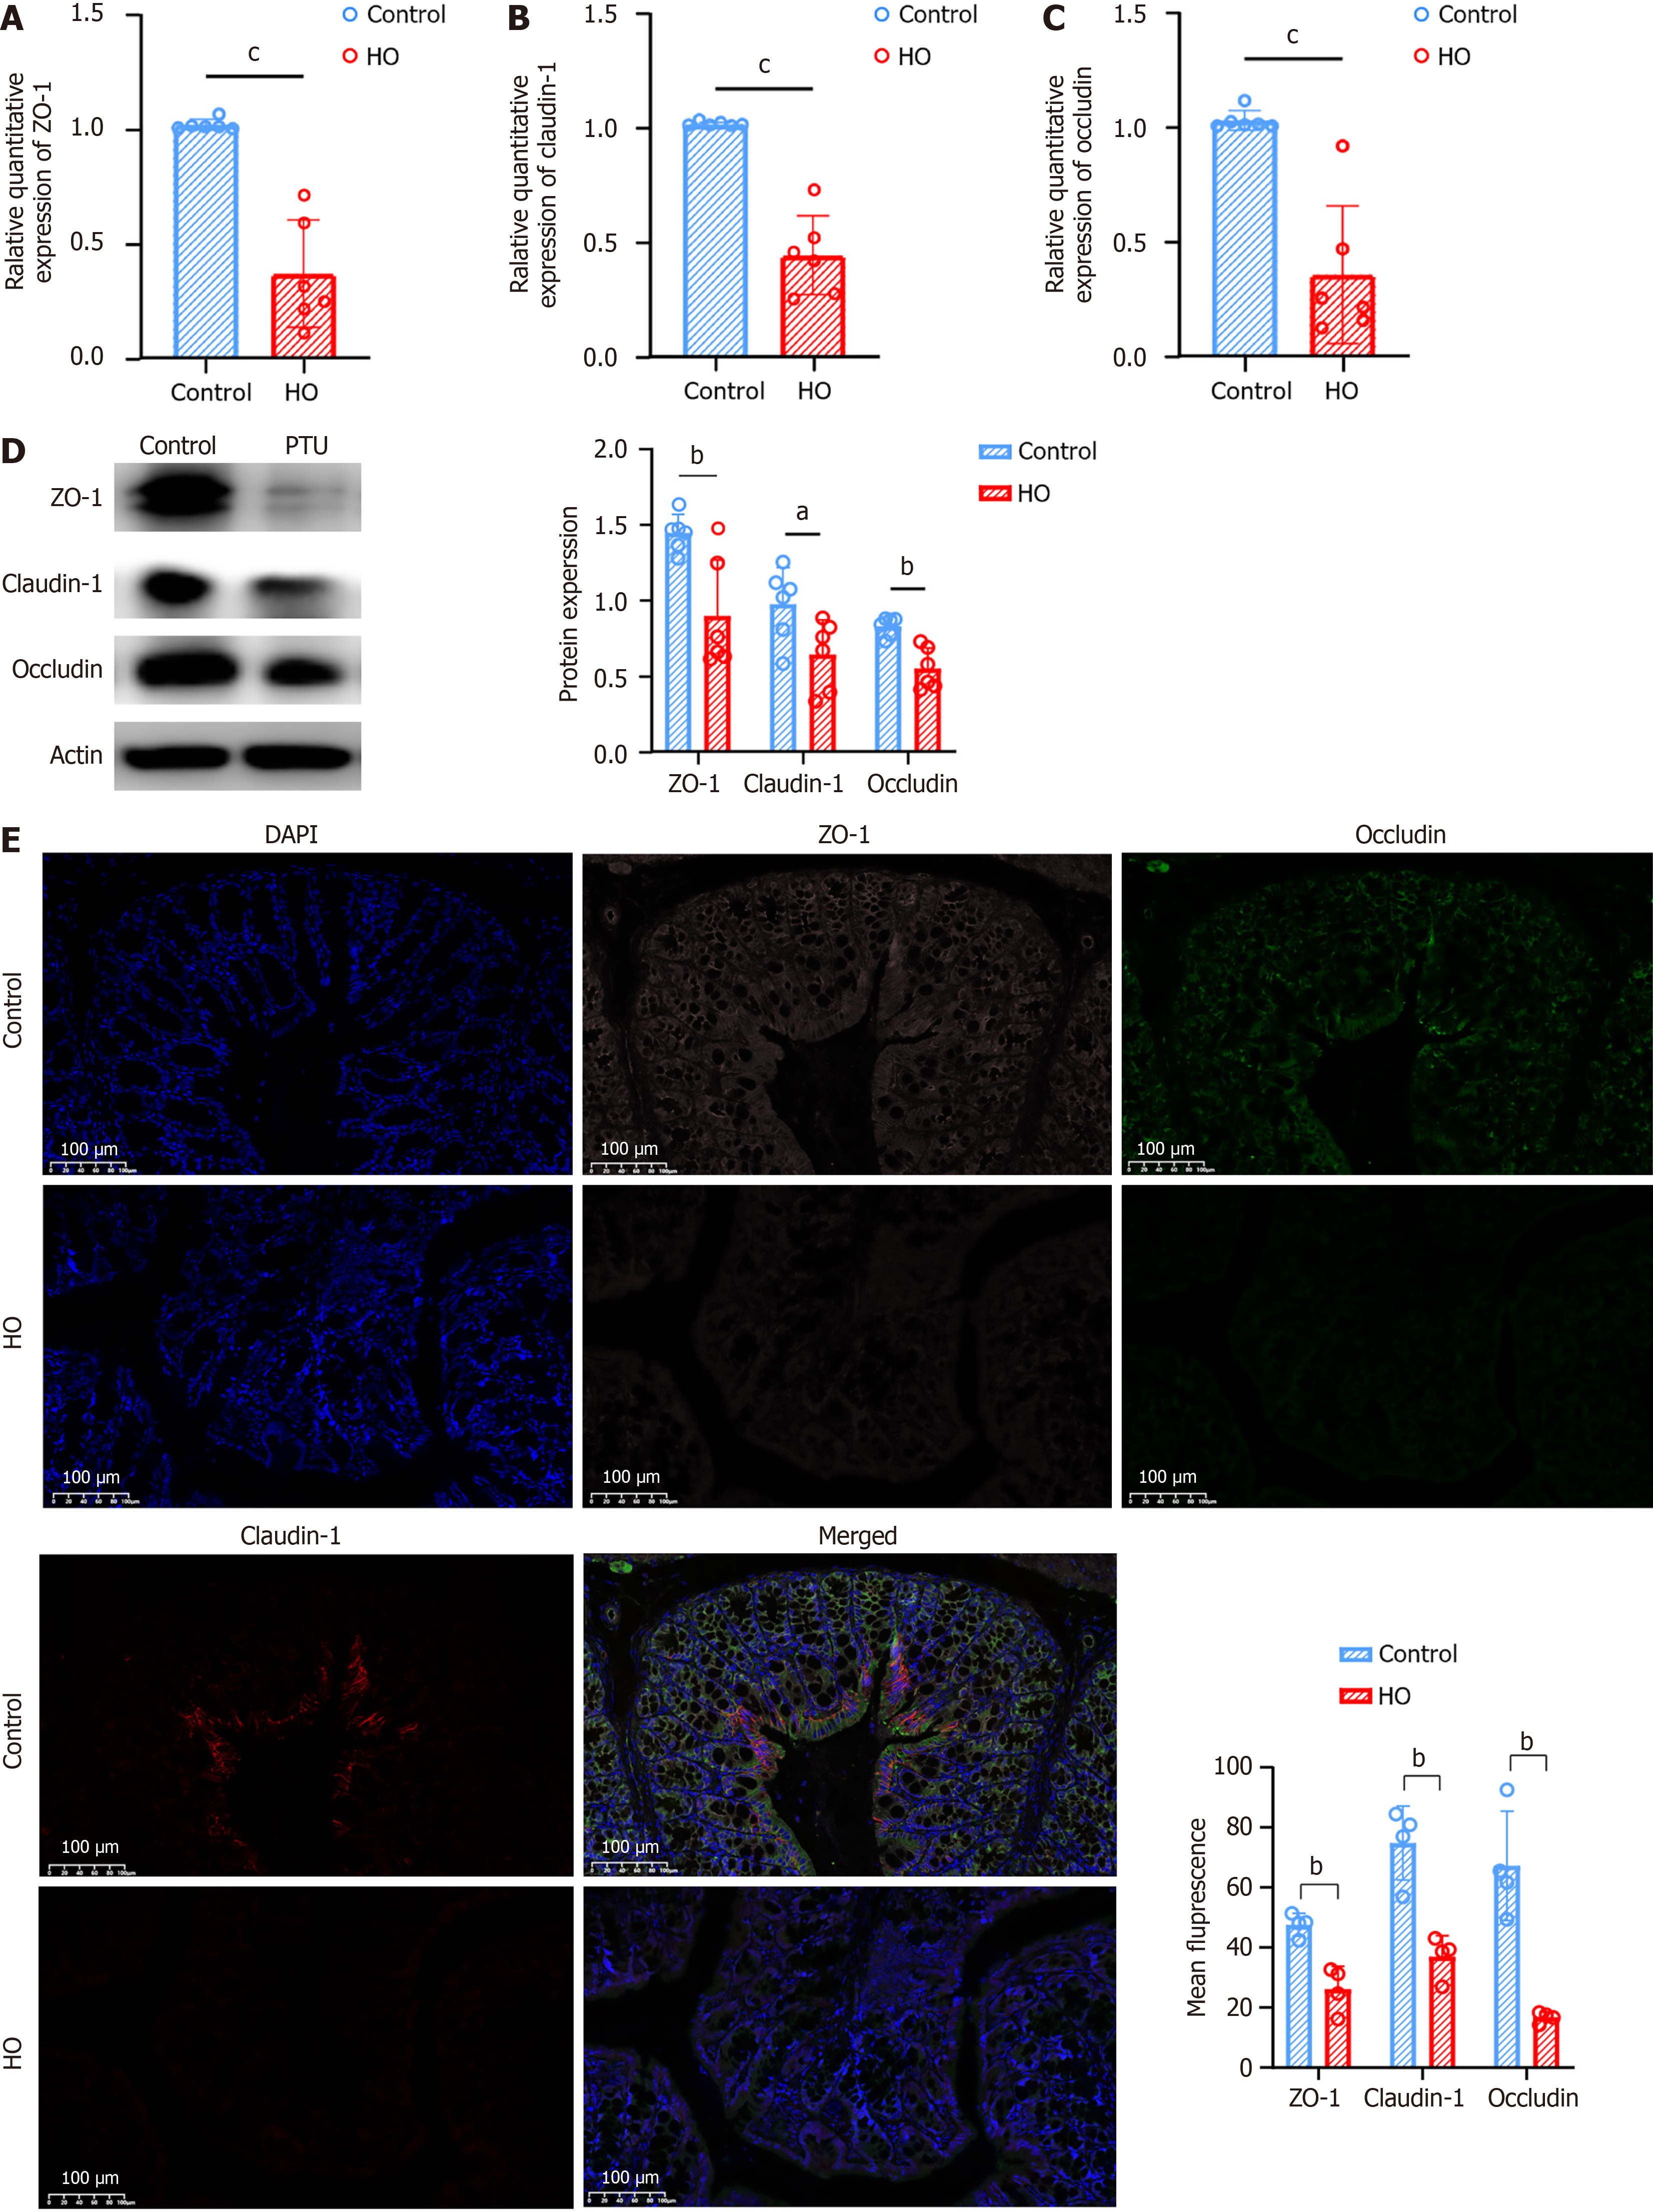
Figure 3 The intestinal barrier is compromised in hypothyroid mice.
A-C: The mRNA expression levels of genes encoding tight junction proteins zonula occludens-1 (ZO-1), claudin-1, and occludin in the colon are significantly reduced in the hypothyroid group (HO) compared to the control group; D: Western blot analysis reveals decreased protein levels of ZO-1, claudin-1, and occludin in the HO group; E: Immunofluorescence imaging demonstrates weaker staining for ZO-1, claudin-1, and occludin in the colon tissues of HO mice, further confirming reduced expression. Results are presented as mean ± SEM, with aP < 0.05, bP < 0.01, cP < 0.001 indicating statistical significance. HO: Hypothyroid group; PTU: Propylthiouracil; ZO-1: Zonula occludens-1.
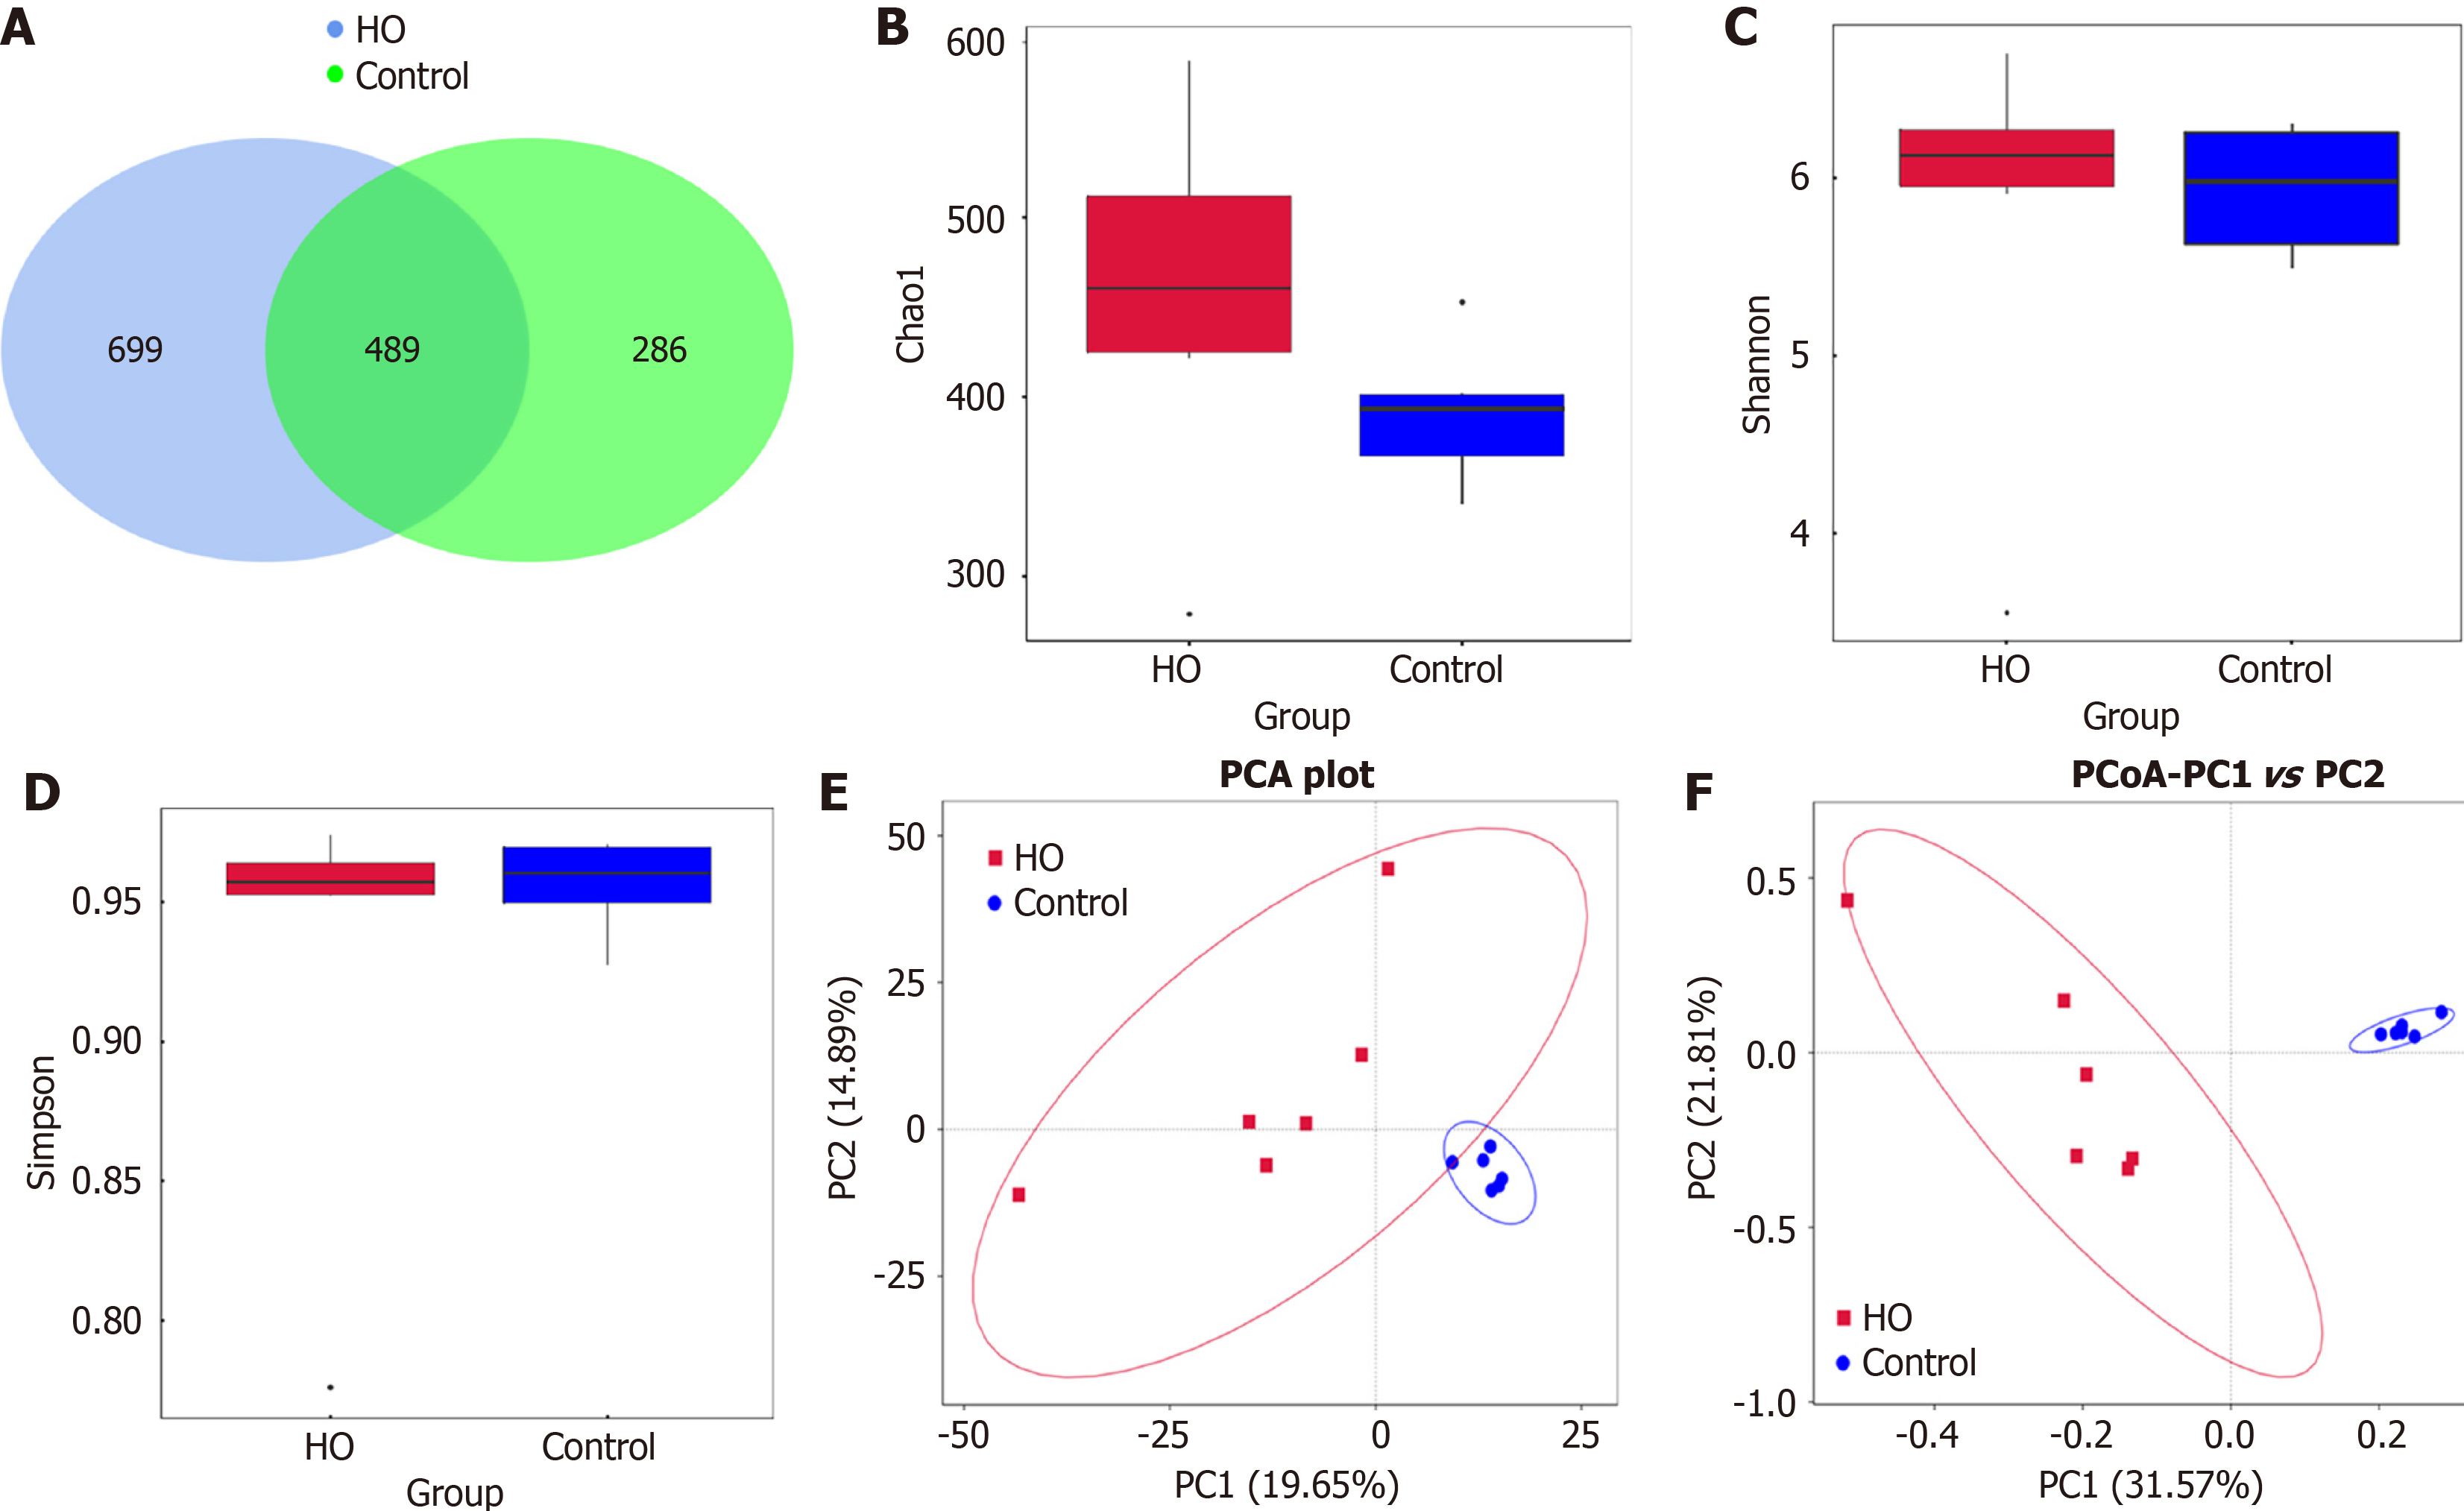
Figure 4 Gut microbiota biodiversity and composition in hypothyroidism mice.
A: Operational taxonomic units Venn diagram; B: Chao1; C: Shannon; D: Simpson: E: Principal component analysis; F: Principal coordinates analysis. HO: Hypothyroid group; PCA: Principal component analysis.
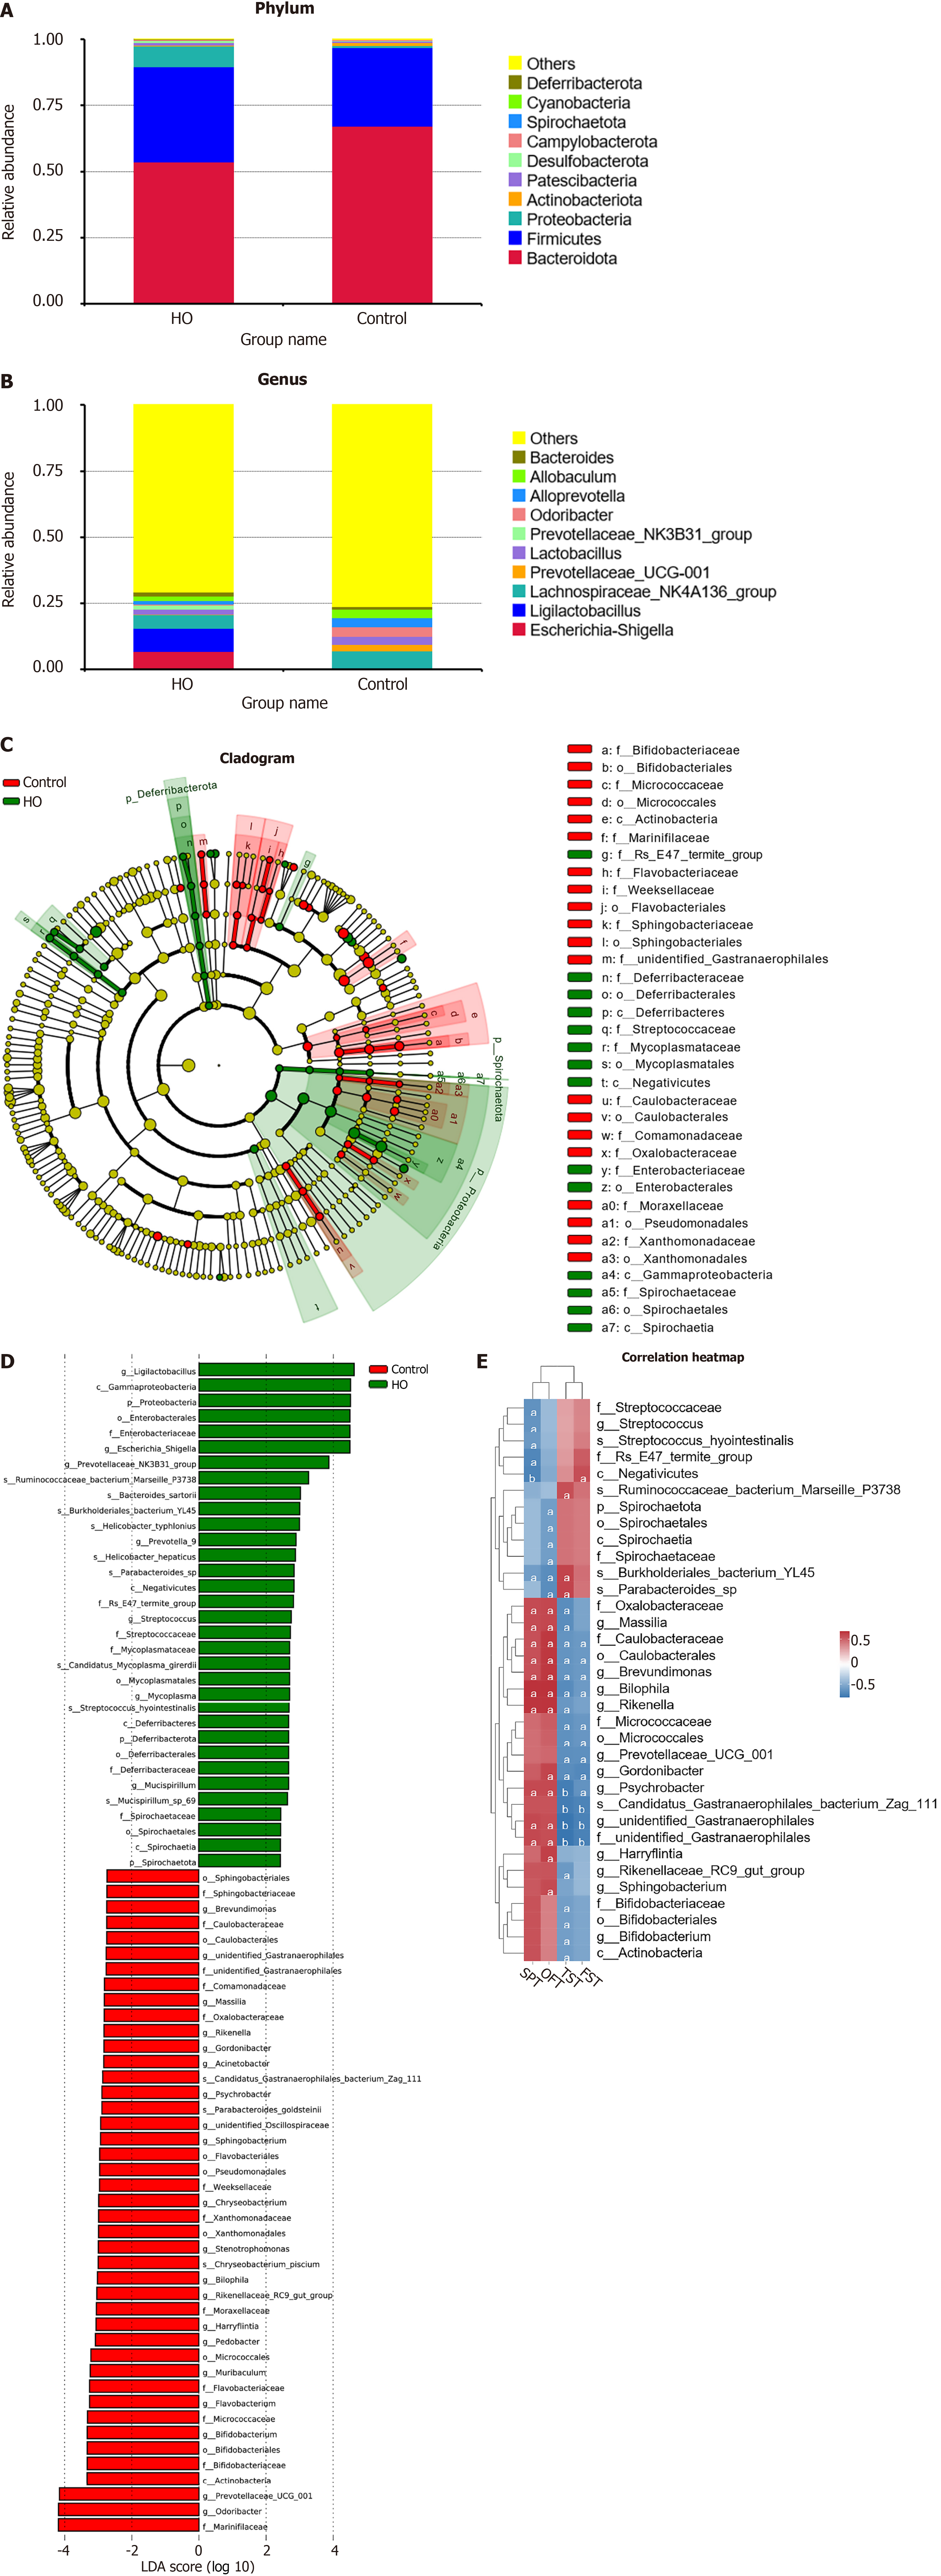
Figure 5 Relative abundance of gut microbiota in hypothyroidism mice.
A: At the phylum level, microbiota composition differs between hypothyroid group (HO) and control groups; B: At the genus level, notable changes in bacterial abundance were observed; C: LEfSe analysis identified specific differential bacteria associated with the HO group in the cladogram; D: Linear discriminant analysis scores confirm significant differences in taxa within the HO group; E: The correlation heatmap illustrates associations between differential bacteria and behavioral/physiological parameters, with certain bacteria (e.g., Bilophila and Psychrobacter) associated with depression-like behaviors. aP < 0.05, bP < 0.01. HO: Hypothyroid group.
- Citation: Guo HJ, Ma XQ, Li YT, Zhou ZH, Tao W, Jiang YH, Li XL, Zhang XL. Correlation between depressive-like behavior and gut microbiota in mice with hypothyroidism. World J Psychiatry 2025; 15(7): 104921
- URL: https://www.wjgnet.com/2220-3206/full/v15/i7/104921.htm
- DOI: https://dx.doi.org/10.5498/wjp.v15.i7.104921


