©The Author(s) 2025.
World J Psychiatry. Jun 19, 2025; 15(6): 105751
Published online Jun 19, 2025. doi: 10.5498/wjp.v15.i6.105751
Published online Jun 19, 2025. doi: 10.5498/wjp.v15.i6.105751
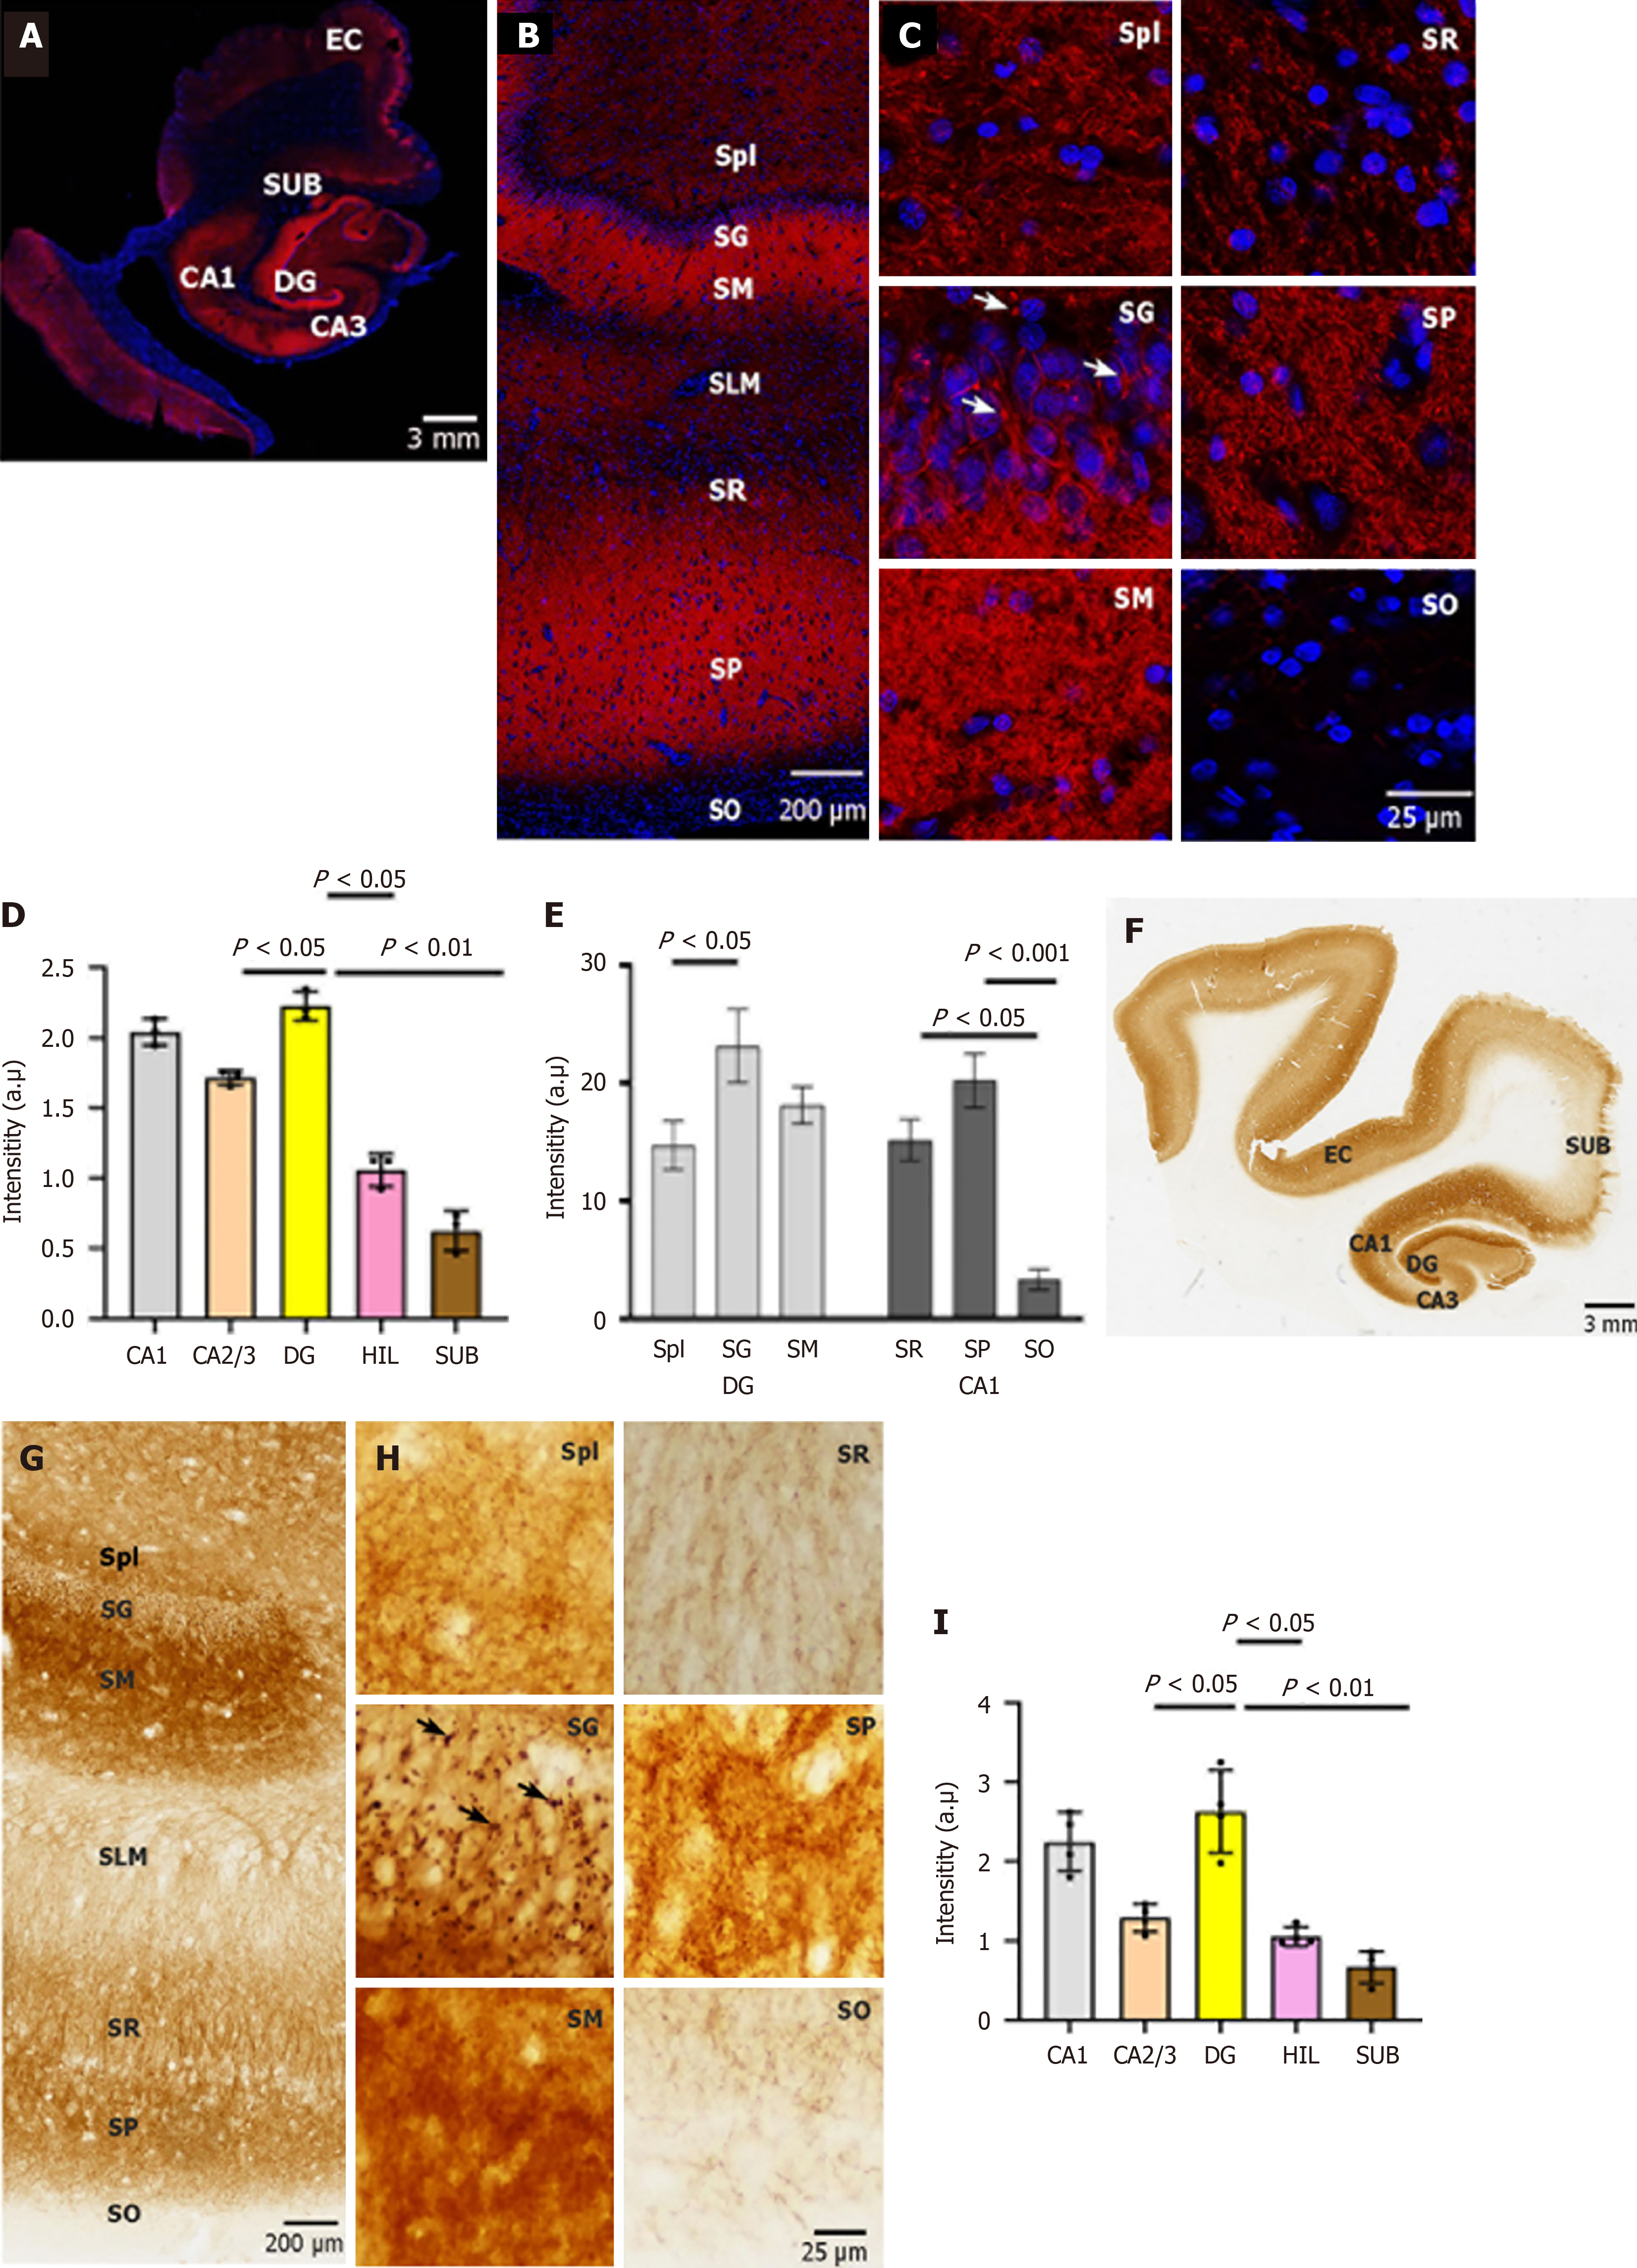
Figure 1 Expression and cellular localization of neuroplastin 65 immunoreactivity in human hippocampal formation.
A: Neuroplastin 65 (NP65) immunofluorescent staining in a coronal section of the human hippocampal formation. A representative view of the human hippocampal formation at a low magnification (scale bars = 3 mm); B and C: NP65 immunofluorescent staining in a coronal section of the human hippocampal formation. Representative micrographs of NP65 immunoreactivity in the cornu ammonis 1 (CA1) region and dentate gyrus at a high magnification view. Note the immunoreactive knots (indicated by an arrow) in the stratum granulosum; D and E: Quantification of NP65 immunofluorescent staining in the sublayers of CA1 and DG and hippocampal areas; F: A representative scan of the human hippocampal formation (scale bars = 3 mm); G and H: Representative micrographs of NP65 immunoreactivity in the CA1 region and dentate gyrus at a high magnification view. Note the immunoreactive knots (indicated by an arrow) in the stratum granulosum; I: Quantification of NP65 immunohistochemical staining in hippocampal areas. DG: Dentate gyrus; CA: Cornu ammonis; HIL: Hilus; SUB: Subiculum; EC: Entorhinal cortex; SG: Stratum granulosum; SM: Stratum moleculare; SPl: Stratum plexiforme; SLM: Stratum lacunosum-molecular; SR: Stratum radiatum; SP: Stratum pyramidale; SO: Stratum oriens.
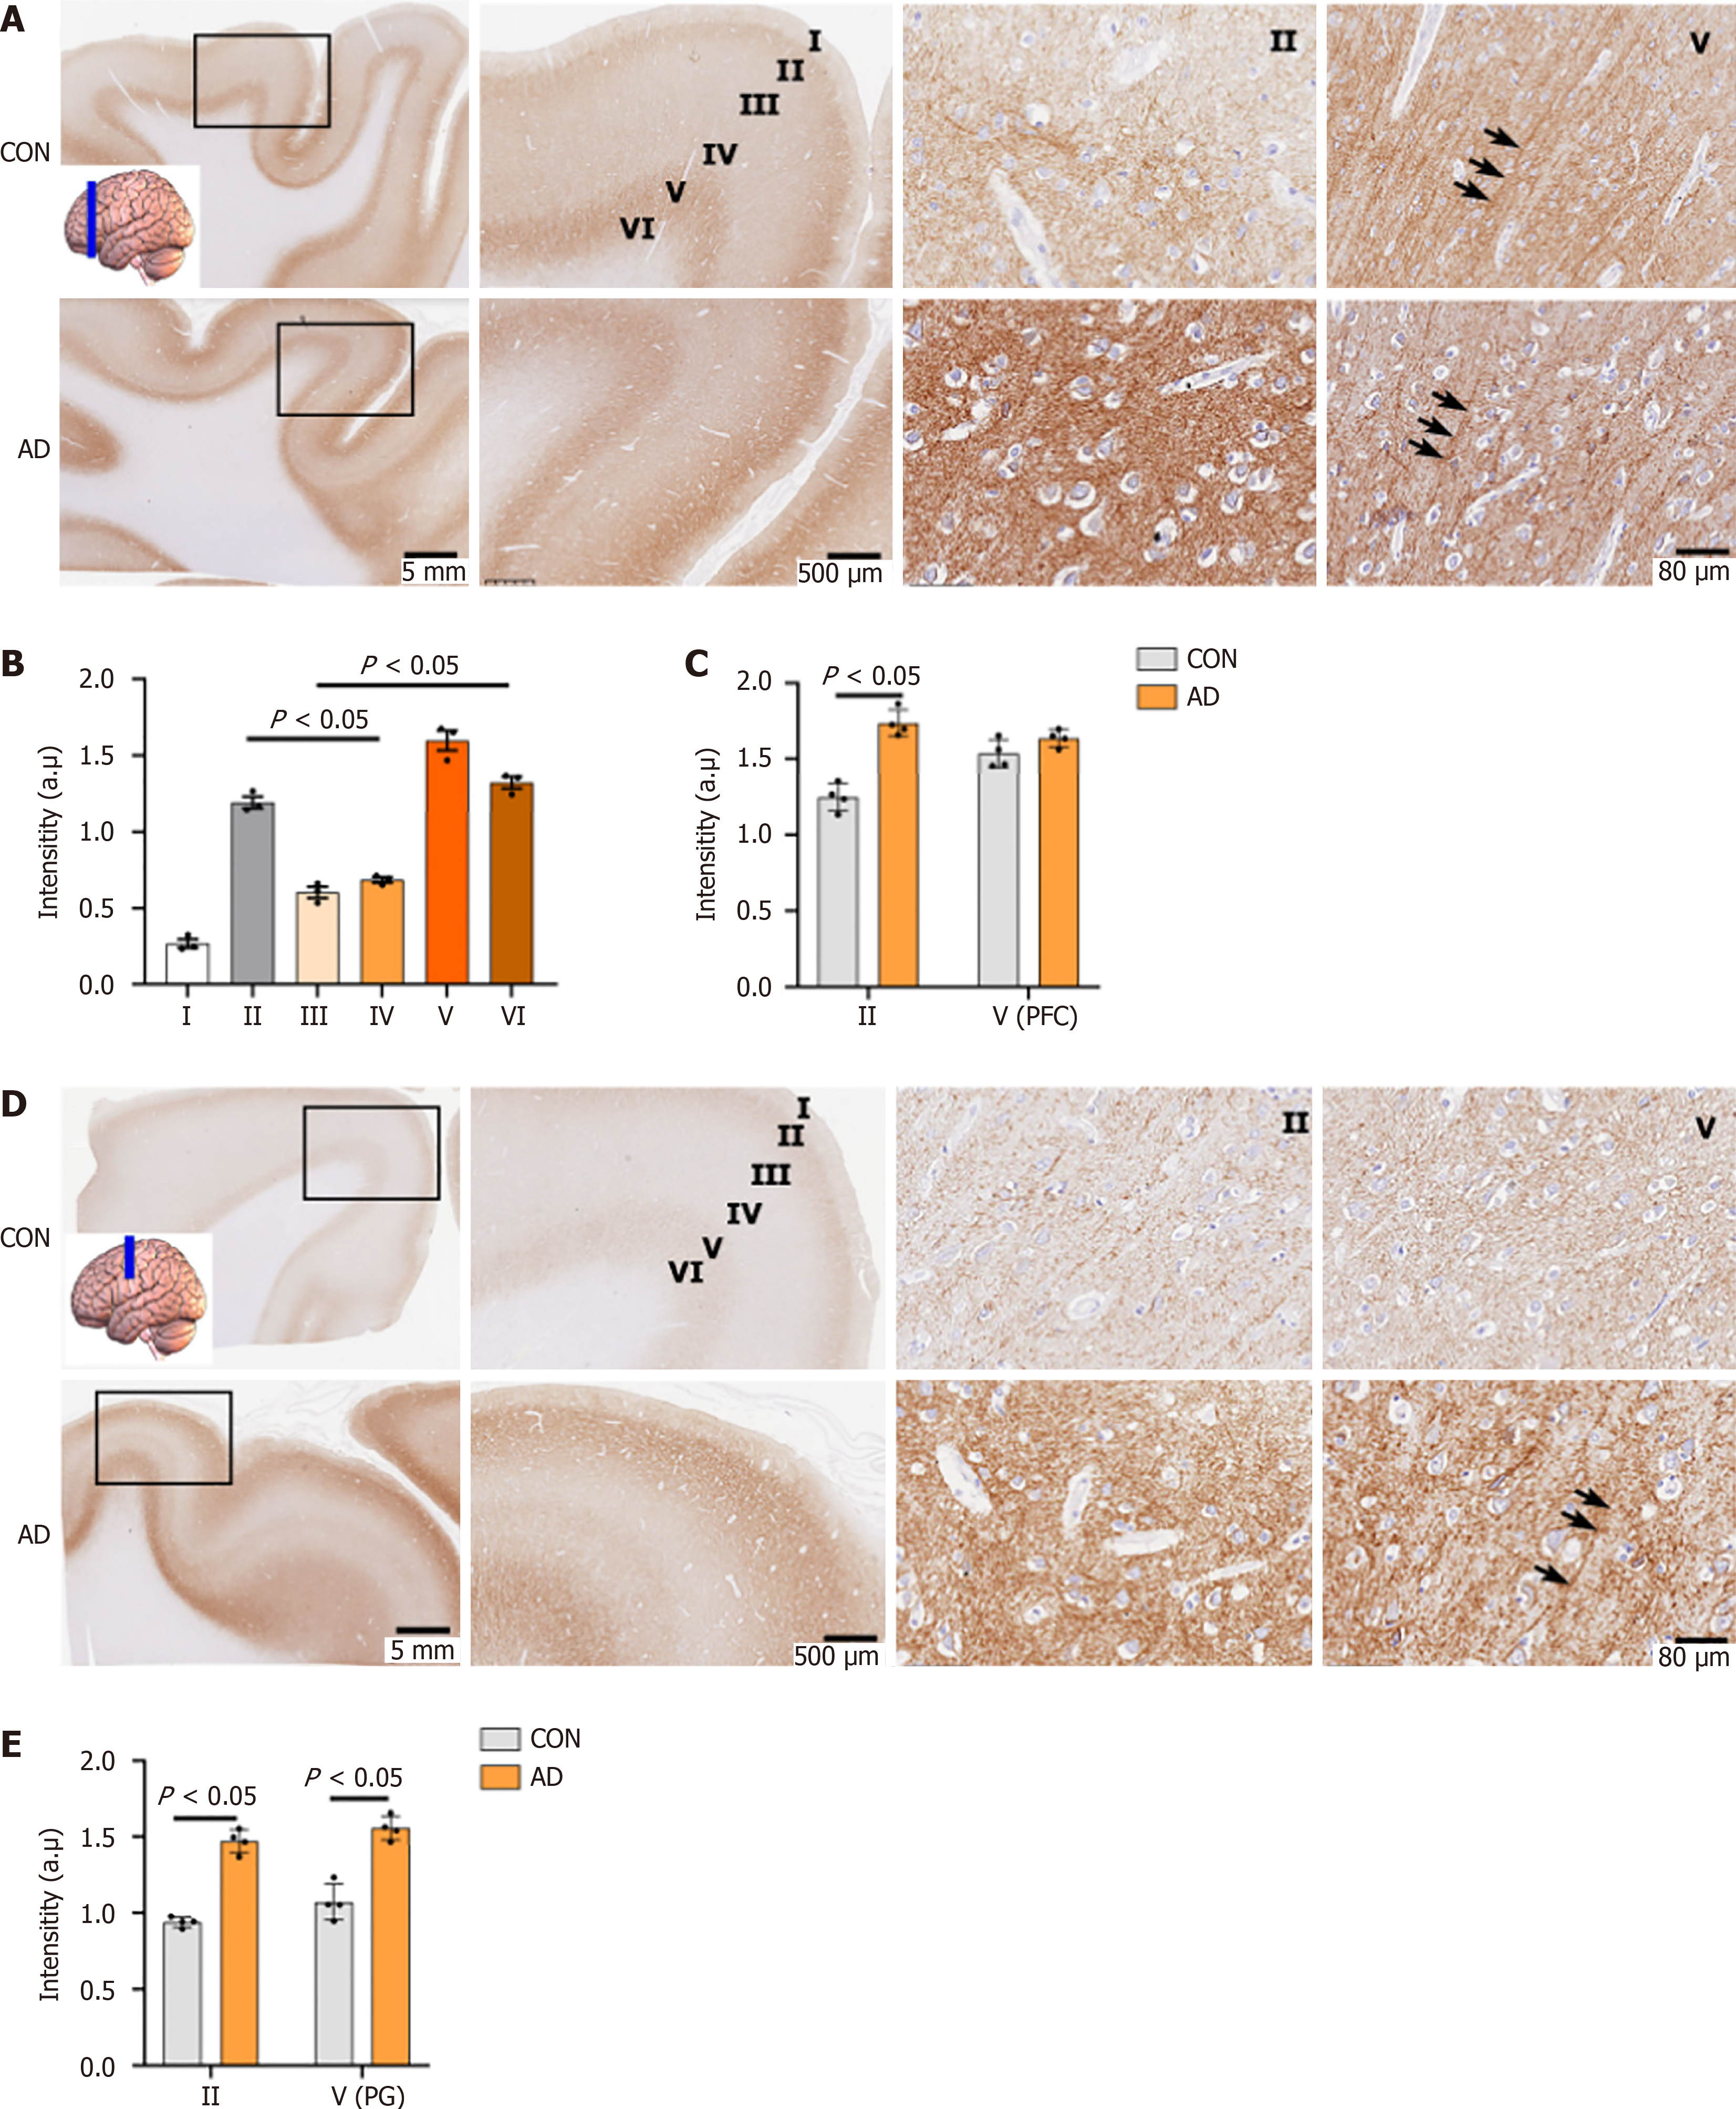
Figure 2 Neuroplastin 65 immunoreactive pattern in the dorsolateral frontal cortex of individuals with Alzheimer’s disease and age-matched controls.
A: Representative Neuroplastin 65 (NP65) immunohistochemical staining micrographs of a coronal section in the dorsolateral prefrontal cortex (dPFC) from controls (CON) and Alzheimer’s disease (AD), with an inset indicating the sampling position. Note the strongly positive apical dendrites (indicated by an arrow) in layer V; B: Quantification of NP65 immunoreactivity in sublayers of the dPFC in CON; C: Comparison of NP65 immunoreactivity in layer II and V of the dPFC between AD and CON; D: Representative NP65 immunohistochemical staining micrographs of a coronal section in the precentral gyrus of CON and AD, with an inset indicating the sampling position. Note the strongly positive apical dendrites (indicated by an arrow) in layer V of the AD brain; E: Comparison of NP65 immunoreactivity in layer II and V of the precentral gyrus between AD and CON. The nucleus is stained with hematoxylin. PFC: Prefrontal cortex; CON: Controls; AD: Alzheimer’s disease; PG: Precentral gyrus.
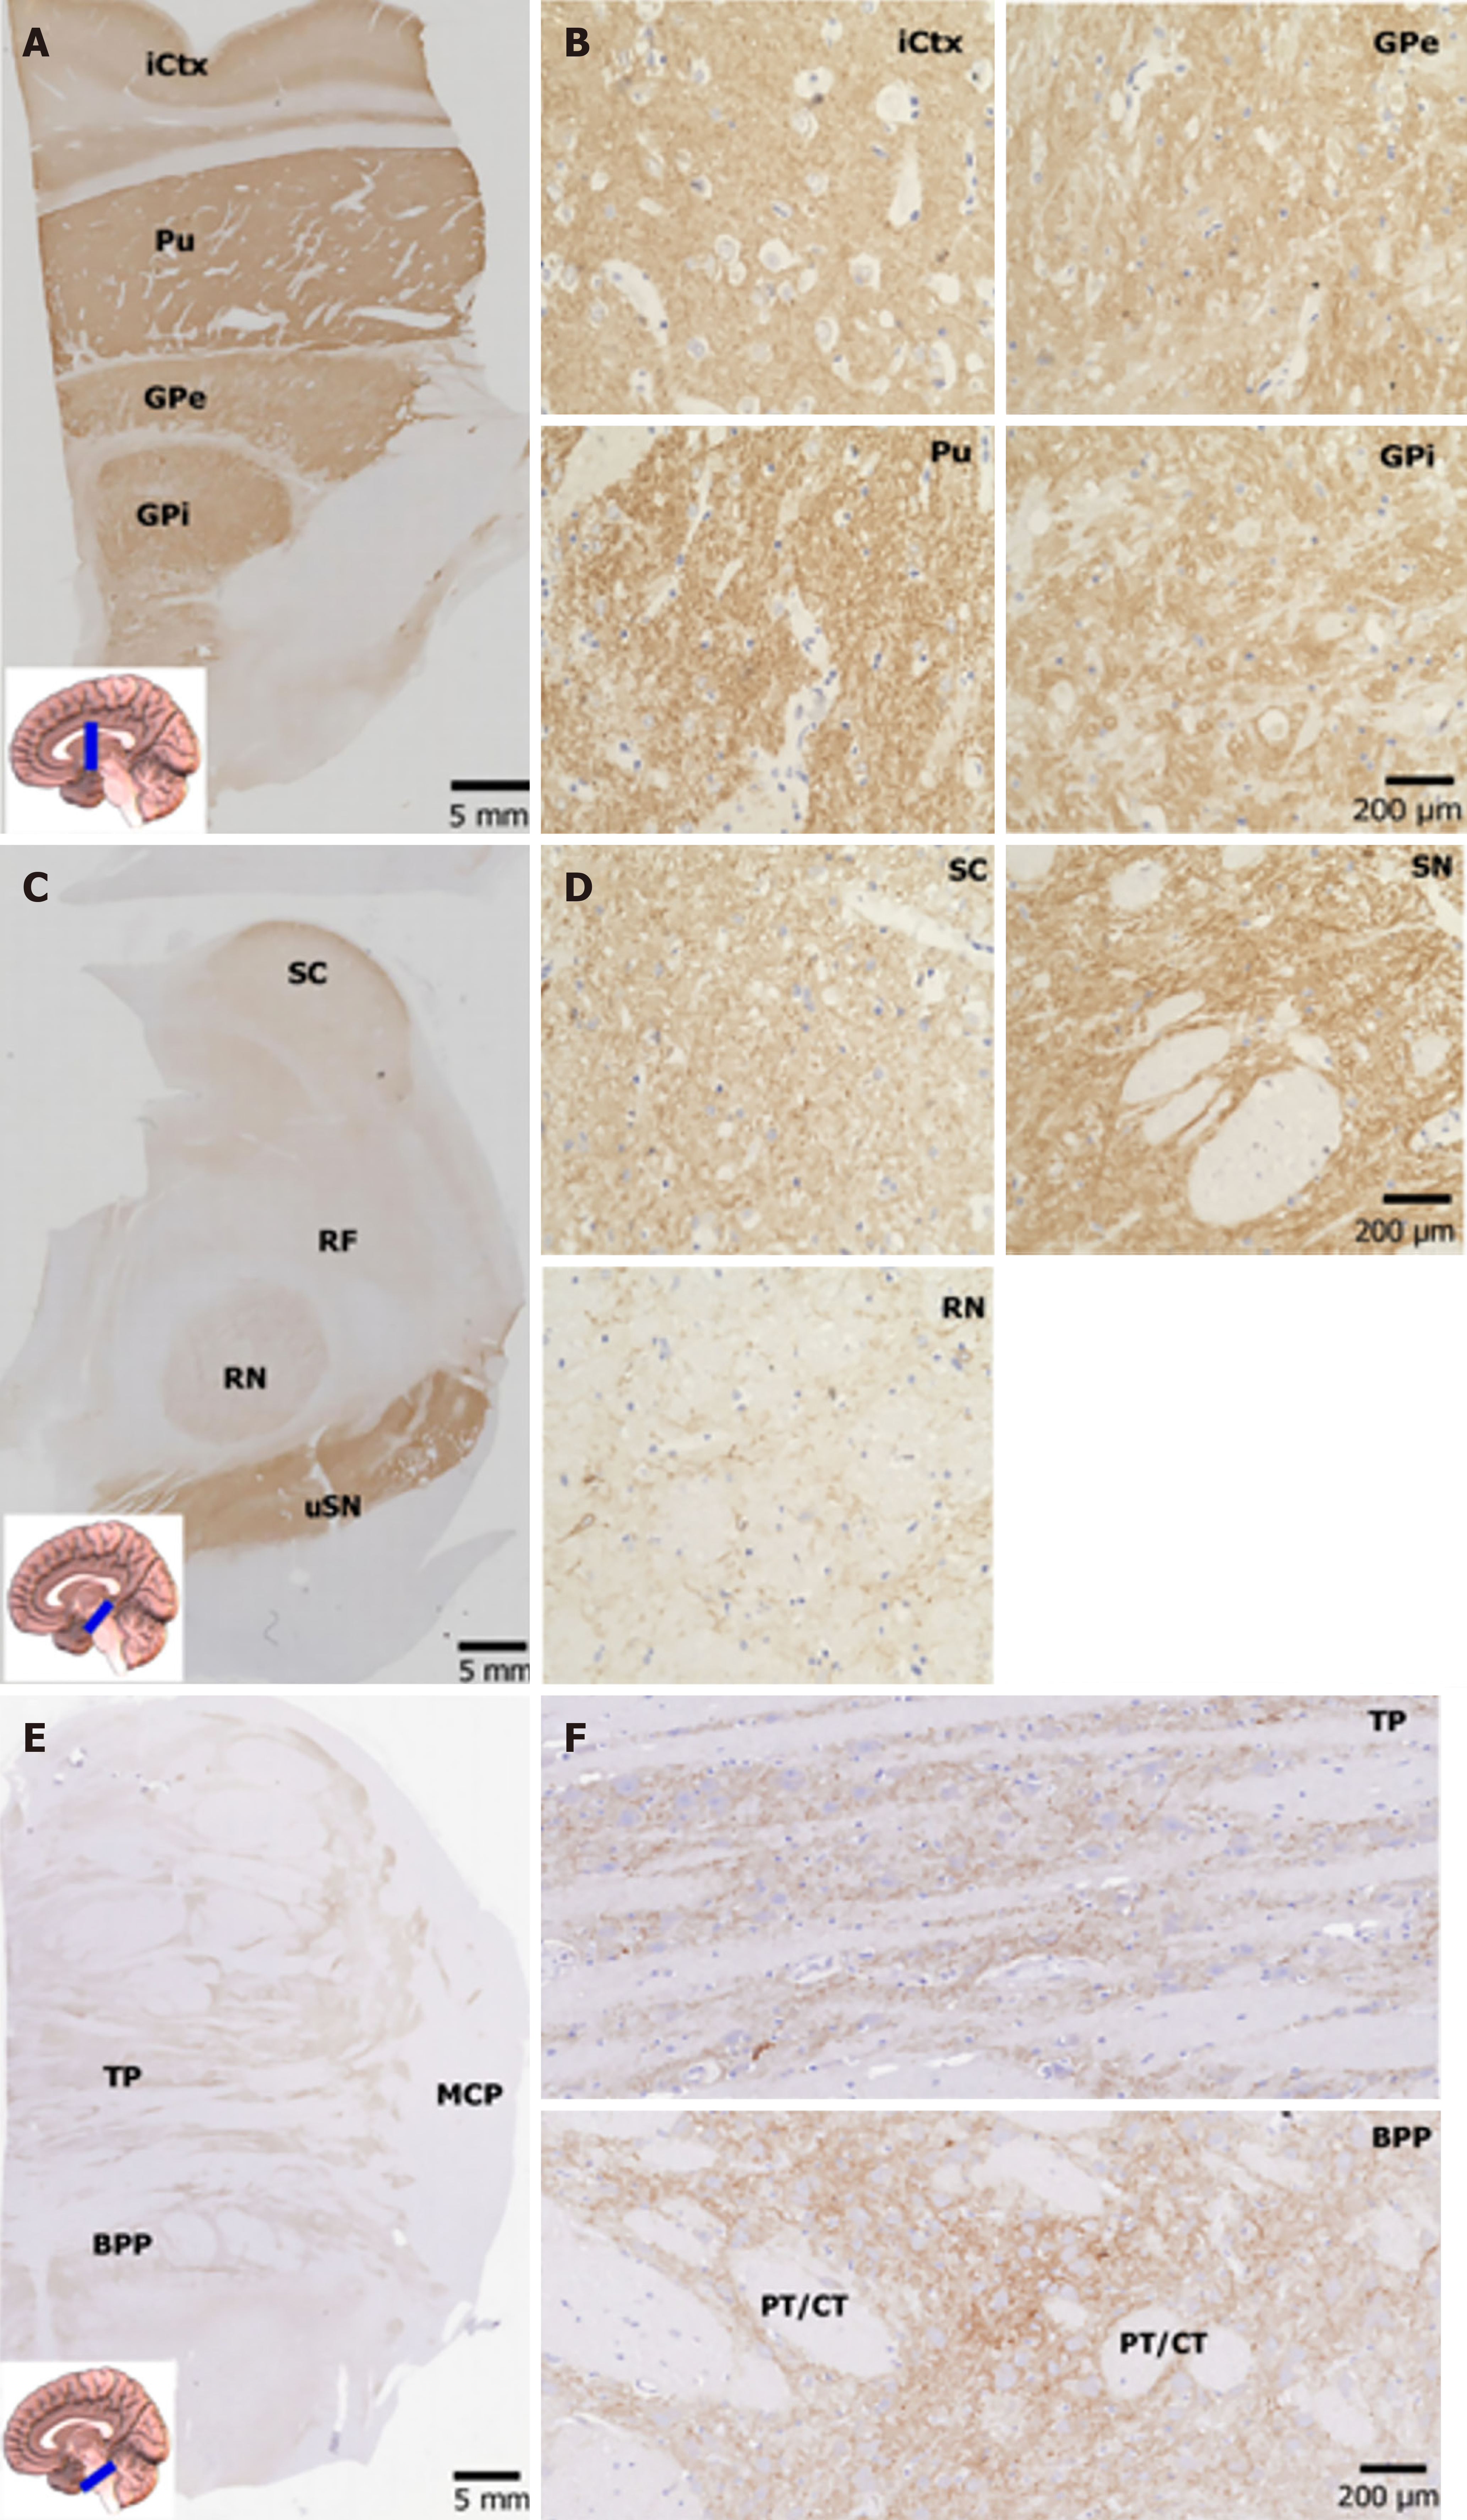
Figure 3 Expression of neuroplastin 65 immunoreactivity in human lentiform nucleus, midbrain and pons.
A: A representative immunohistochemical staining micrograph in the lentiform nucleus, with an inset indicating the position of the sampling (scale bars = 5 mm); B: A representative immunohistochemical staining micrograph in the lentiform nucleus, with an inset indicating the position of the sampling (higher power views, scale bars = 200 μm). Note that neuroplastin 65 immunoreactivity shows strong punctate staining in the putamen, while there are dense networks in the globus pallidus; C: An immunohistochemical staining micrograph in the midbrain at a low magnification view, with an inset indicating the position of the sampling (scale bars = 5 mm); D: An immunohistochemical staining micrograph in the midbrain at a low magnification view, with an inset indicating the position of the sampling (higher power view, scale bars = 200 μm). Note that there is positive punctate staining and fibers in the substantia nigra and less intense positive fibers in the red nucleus; E: A low magnification view of the pons, with an inset indicating the position of the sampling (scale bars = 5 mm); F: A low magnification view of the pons, with an inset indicating the position of the sampling (higher power views, scale bars = 200 μm). The nucleus is stained by hematoxylin. iCtx: Insular cortex; Pu: Putamen; GPe: External part of the globus pallidus; GPi: Internal part of the globus pallidus; IC: Internal capsule; CC: Crus cerebri; SN: Substantia nigra; RN: Red nucleus; SC: Superior colliculus; RF: Reticular formation; BPP: Basilar part of the pons; TP: Tegmentum of the pons; PT: Pyramidal tract; CT: Corticopontine tract; MCP: Middle cerebellar peduncle.
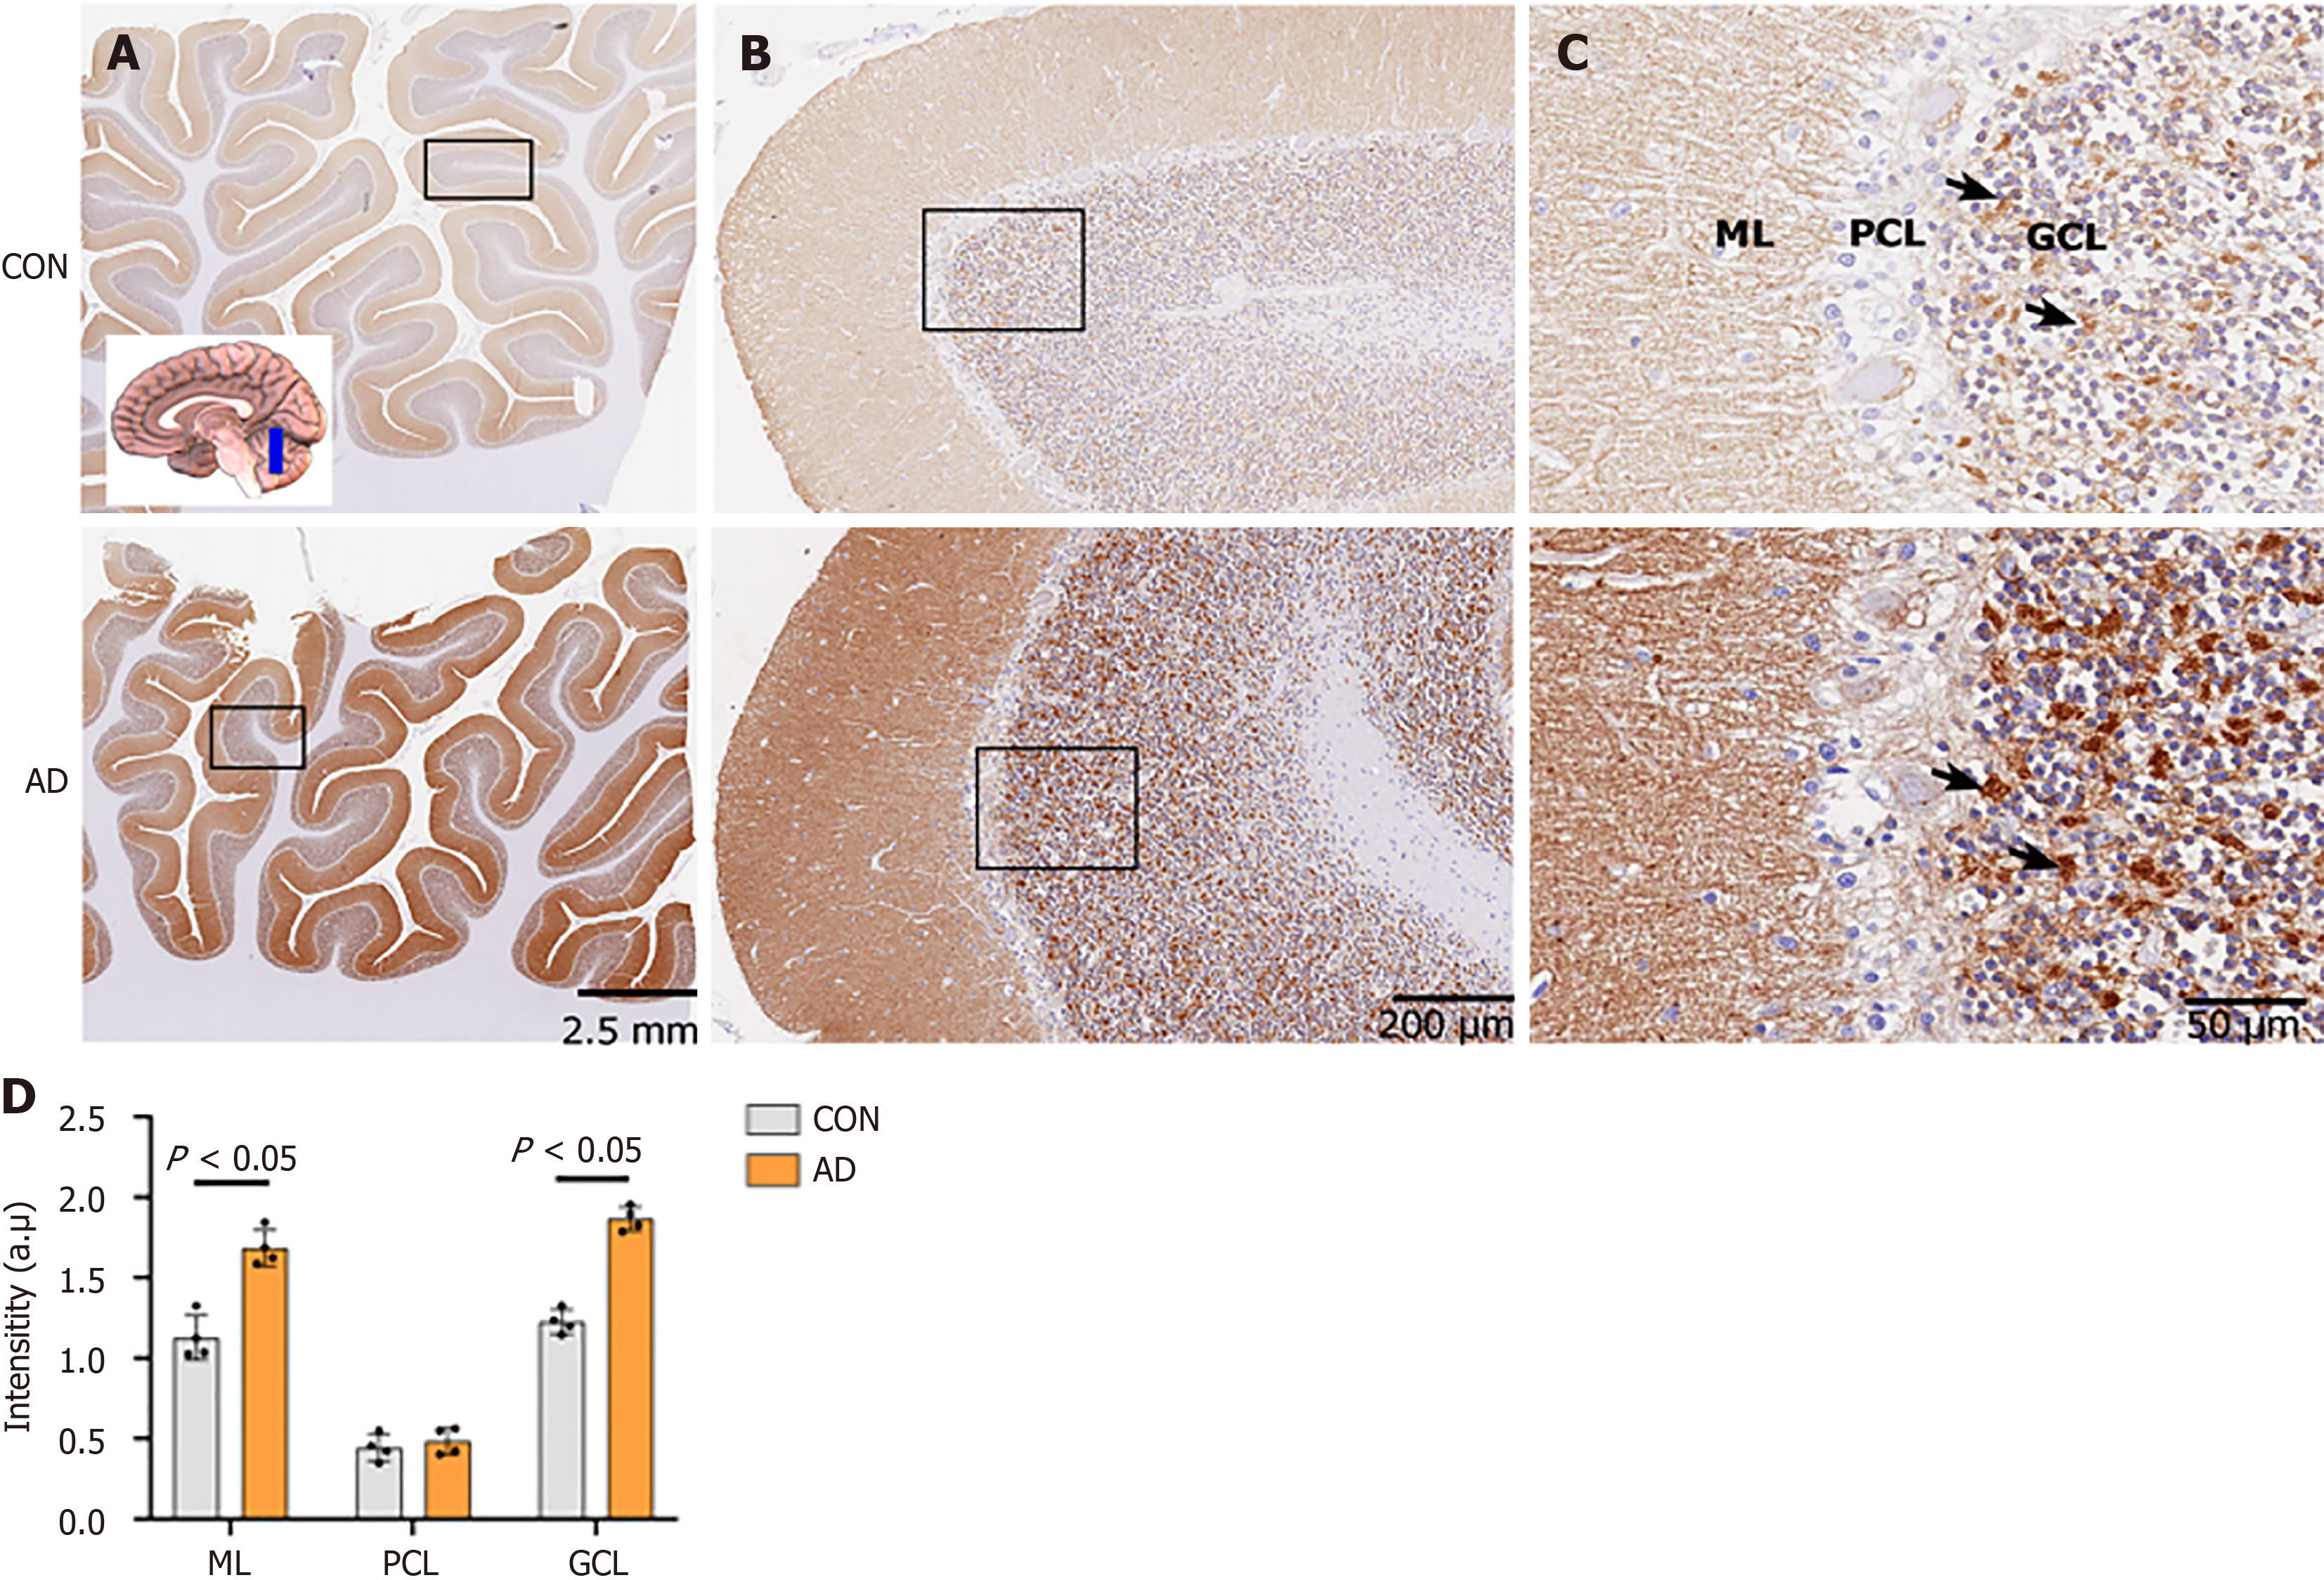
Figure 4 Neuroplastin 65 immunoreactive pattern in the cerebellum derived from individuals with Alzheimer’s disease and age-matched controls.
A: Low-power microphotograph showing the regional distribution of neuroplastin 65 (NP65) immunoreactivity in the cerebellar anterior lobe of controls (CON) and Alzheimer's disease (AD). The inset indicates the position of the sampling (scale bars = 2.5 mm); B: Low-power views in the rectangle frame in Figure 4A showing the regional distribution of NP65 in the cerebellar cortex of CON and AD (scale bars = 200 μm); C: Higher-power views in the ML, PCL and GCL of the rectangle frame in Figure 4B. Note that intense NP65 immunoreactivity is shown in a blocky or granular pattern (indicated by arrows) in the GCL, while it is punctate in the ML. There is a significant increase in immunoreactivity in AD compared with CON. The nucleus is stained with hematoxylin (scale bars = 50 μm); D: Quantification of NP65 immunoreactivity in the cerebellar cortex between AD and CON. CON: Controls; AD: Alzheimer's disease; GCL: Granular cell layer; PCL: Purkinje cell layer; ML: Molecular layer.
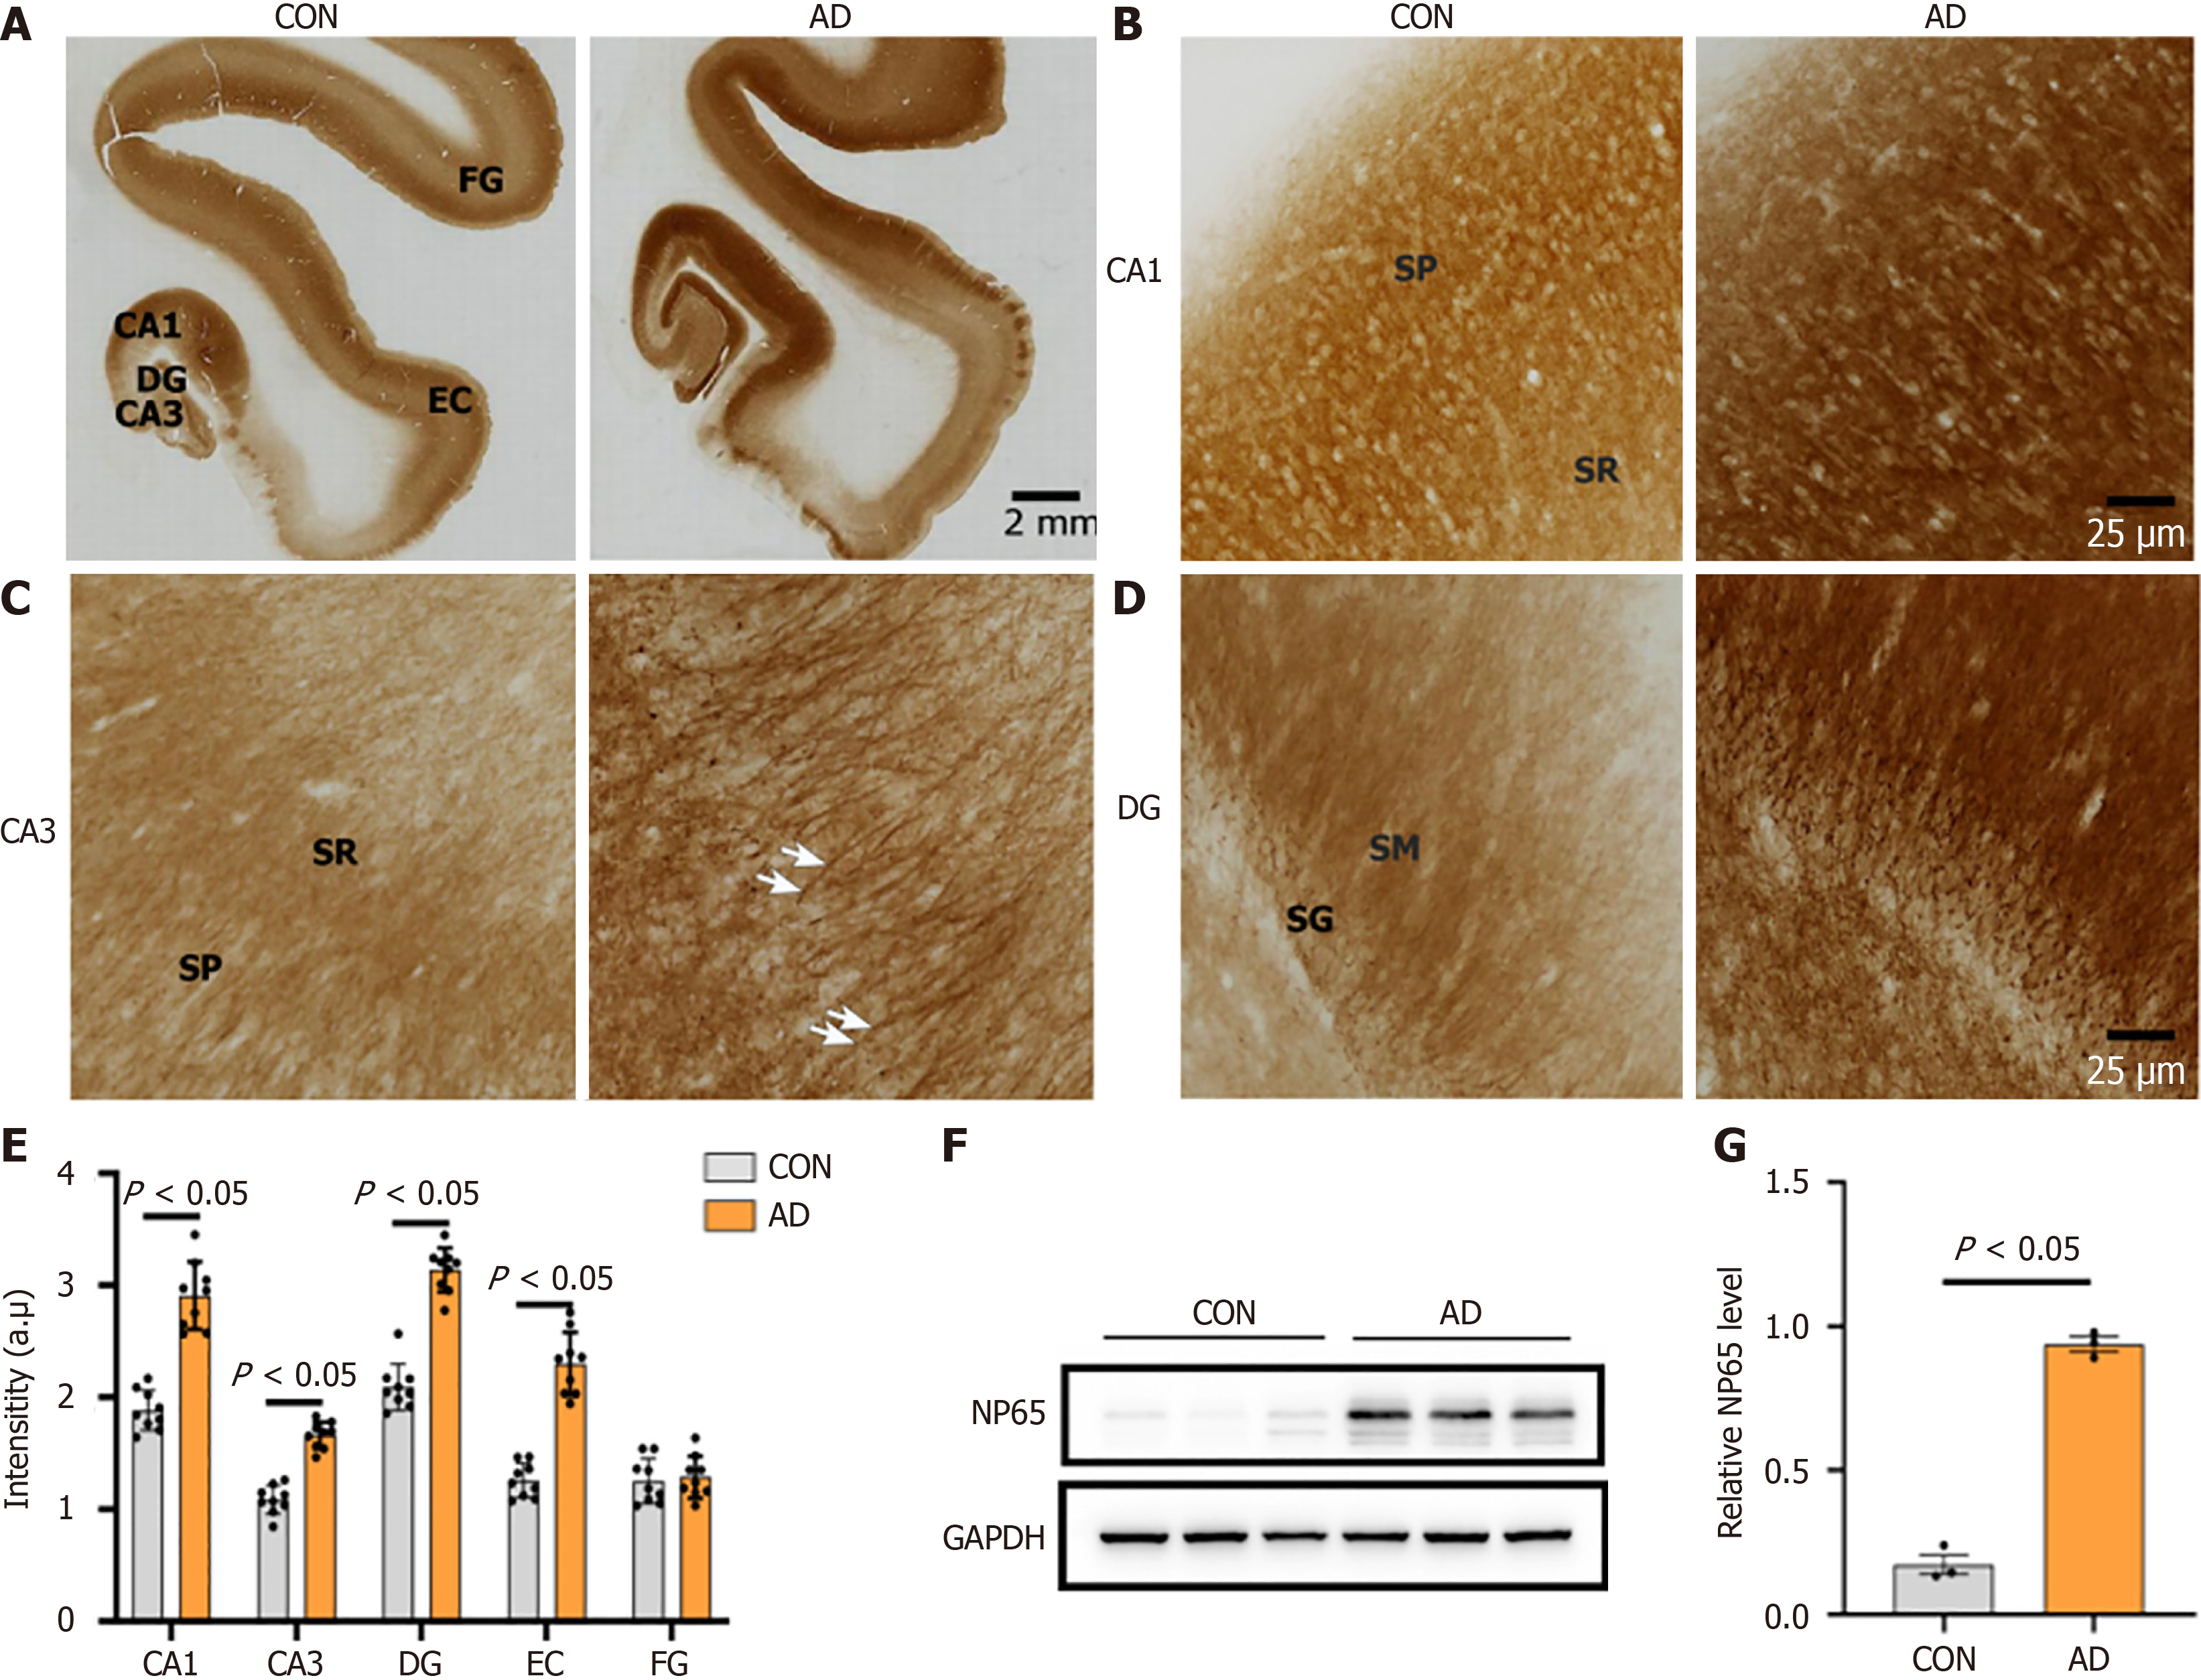
Figure 5 Neuroplastin 65 immunoreactivity pattern in the hippocampal formation and temporal cortex derived from individuals with Alzheimer’s disease and age-matched controls.
A: Low-power microphotographs display the regional distribution of neuroplastin 65 (NP65) in the hippocampal formation, entorhinal cortex and fusiform gyrus of controls (CON) and Alzheimer’s disease (AD) (scale bars = 2 mm); B-D: High-power microphotographs of cornu ammonis (CA) 1, CA3 and dentate gyrus, respectively. Note the strong positive staining of apical dendrites of the stratum pyramidale of CA3 (indicated by arrow in C) in AD (scale bars = 50 μm); E: Quantification of NP65 immunoreactivity in the hippocampal formation, entorhinal cortex and fusiform gyrus between AD and CON; F and G: NP65 immunoreactive bands from total membrane protein of the hippocampus in AD and CON, and quantitative analysis showing NP65 levels in the hippocampus of AD and CON (data from two independent experiments). NP65: Neuroplastin 65; DG: Dentate gyrus; CA: Cornu ammonis; EC: Entorhinal cortex; SG: Stratum granulosum; SM: Stratum moleculare; SR: Stratum radiatum; SP: Stratum pyramidale; FG: Fusiform gyrus; GAPDH: Glyceraldehyde-3-phosphate dehydrogenase; Neuroplastin 65 (NP65); CON: Controls; AD: Alzheimer’s disease.
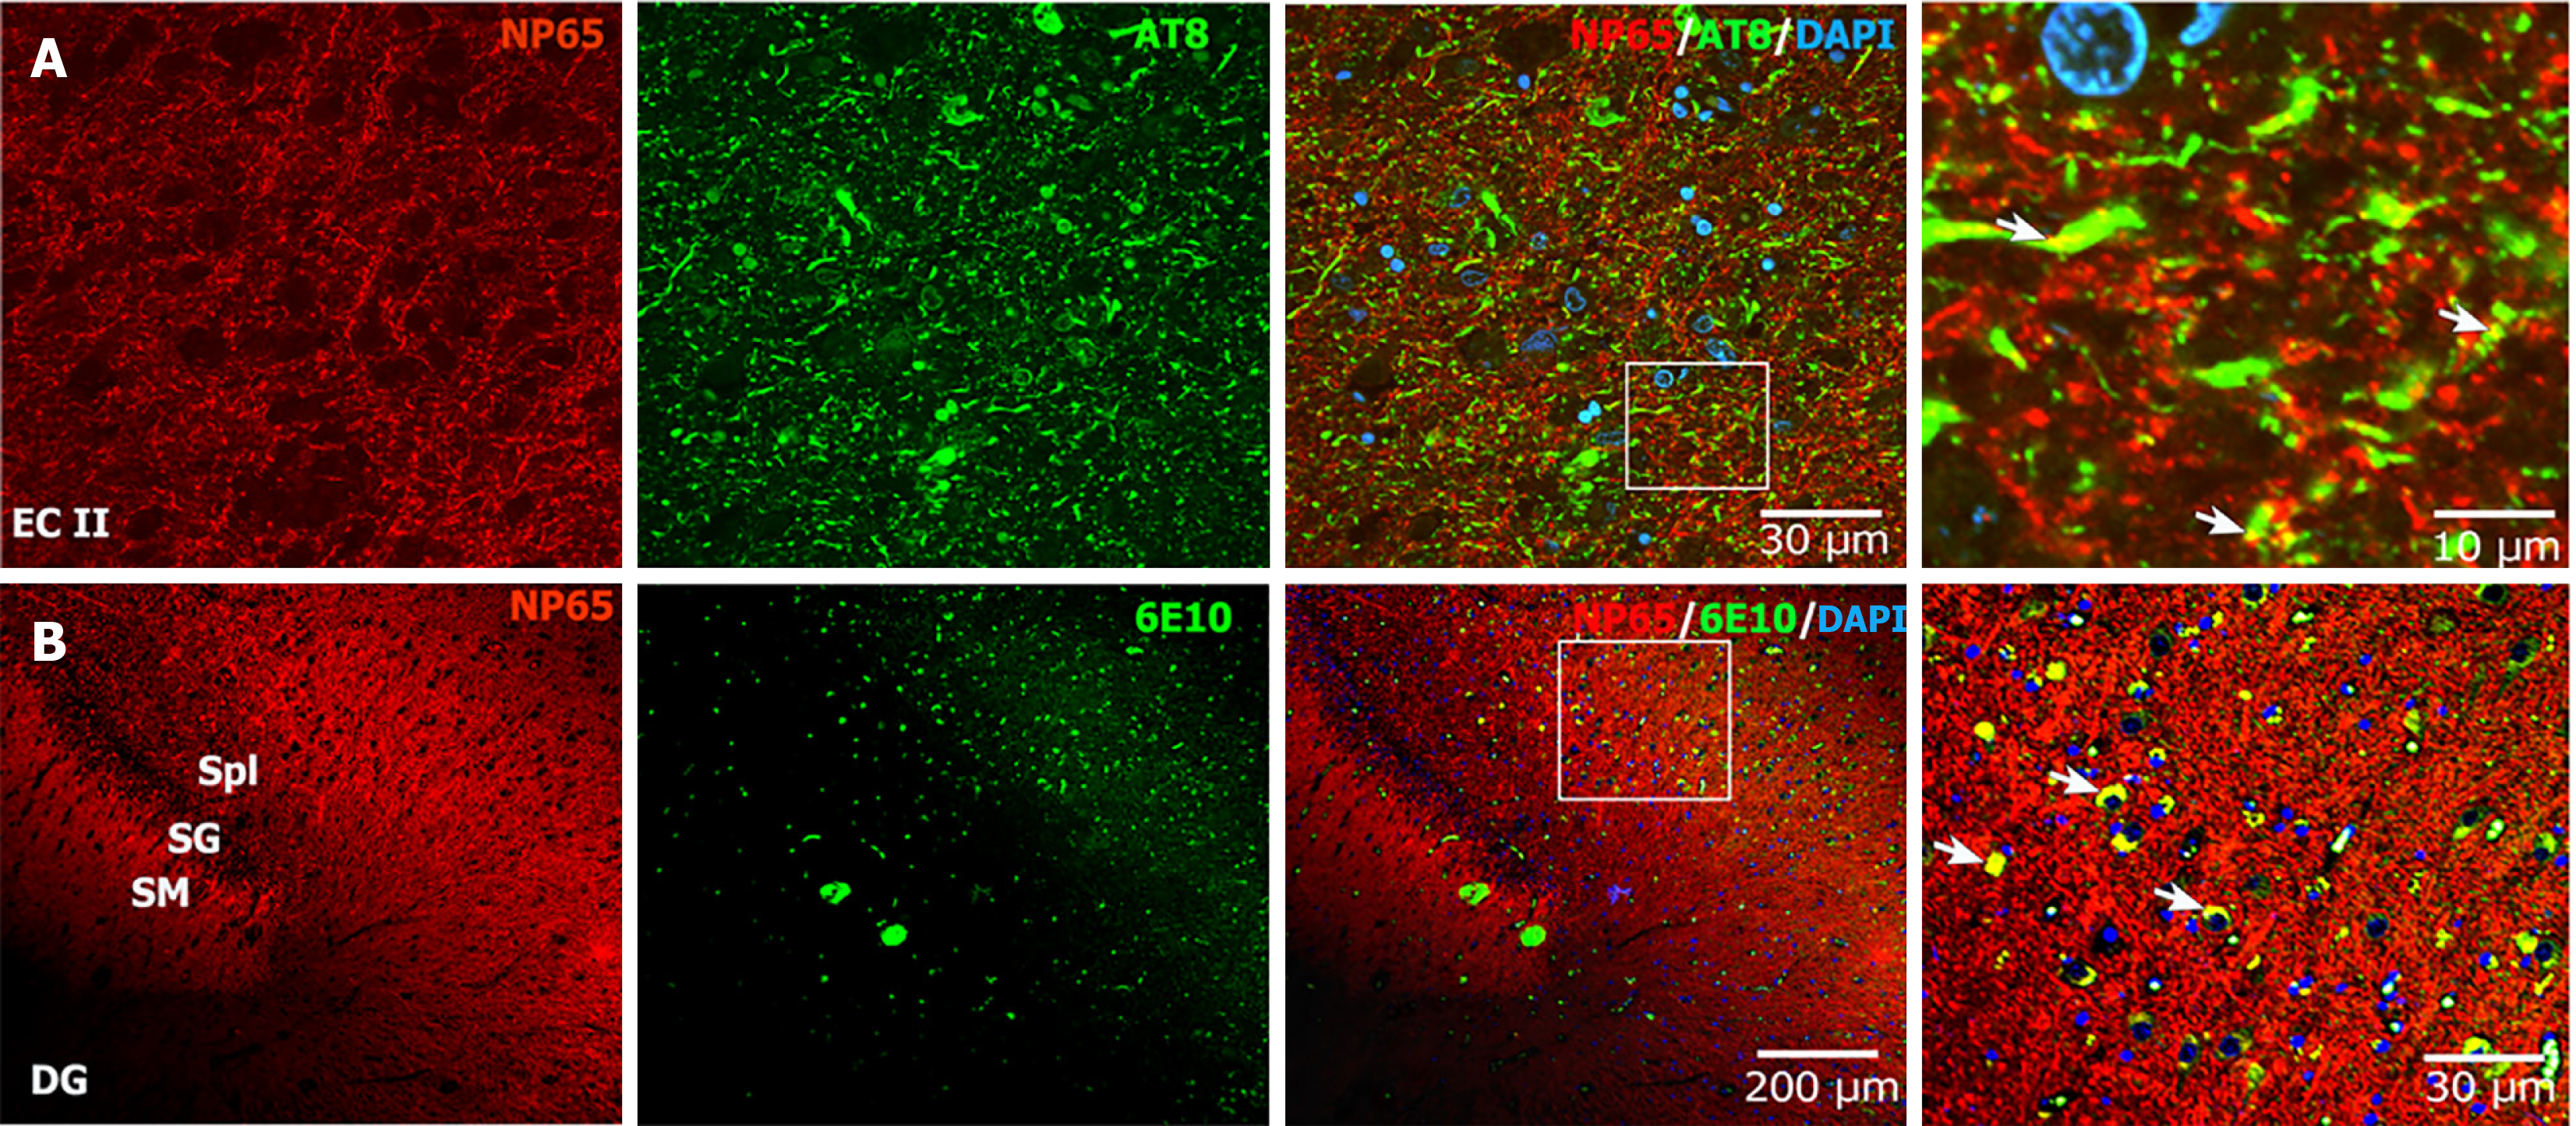
Figure 6 Neuroplastin 65 colocalized with the neurofibrillary tangles and amyloid beta plaques in Alzheimer’s disease brain.
A: The double immunostaining microphotograph of neuroplastin 65 (NP65) with AT-8 (a marker for neurofibrillary tangles) showed that NP65-positive puncta partially colocalized with phosphorylated-microtubule-associated protein tau (yellow, indicated by arrow) in the entorhinal cortex of Alzheimer’s disease brain, scale bar = 30 μm; the left panel shows a higher power view in the rectangle frame, scale bar = 10 μm; B: The double immunostaining microphotograph of NP65 with 6E10 (a marker for amyloid beta) exhibited that NP65-positive puncta partially colocalized with amyloid beta plaques (yellow, indicated by arrow) in the cornu ammonis 3 region of Alzheimer’s disease brain, scale bar = 200 μm; The left panel shows a higher power view in the rectangle frame, scale bar = 30 μm. The nucleus was stained with 4’,6-diamidino-2-phenylindole (blue). NP65: Neuroplastin 65; EC: Entorhinal cortex; DG: Dentate gyrus; SM: Stratum moleculare; SG: Stratum granulosum; Spl: Stratum plexiforme; DAPI: 4’,6-diamidino-2-phenylindole.
- Citation: Zheng YN, Wang Y, Chen L, Xu LZ, Zhang L, Wang JL, Liu J, Zhang QL, Yuan QL. Increased expression of the neuroplastin 65 protein is involved in neurofibrillary tangles and amyloid beta plaques in Alzheimer’s disease. World J Psychiatry 2025; 15(6): 105751
- URL: https://www.wjgnet.com/2220-3206/full/v15/i6/105751.htm
- DOI: https://dx.doi.org/10.5498/wjp.v15.i6.105751


