Copyright
©The Author(s) 2025.
World J Psychiatry. Mar 19, 2025; 15(3): 102567
Published online Mar 19, 2025. doi: 10.5498/wjp.v15.i3.102567
Published online Mar 19, 2025. doi: 10.5498/wjp.v15.i3.102567
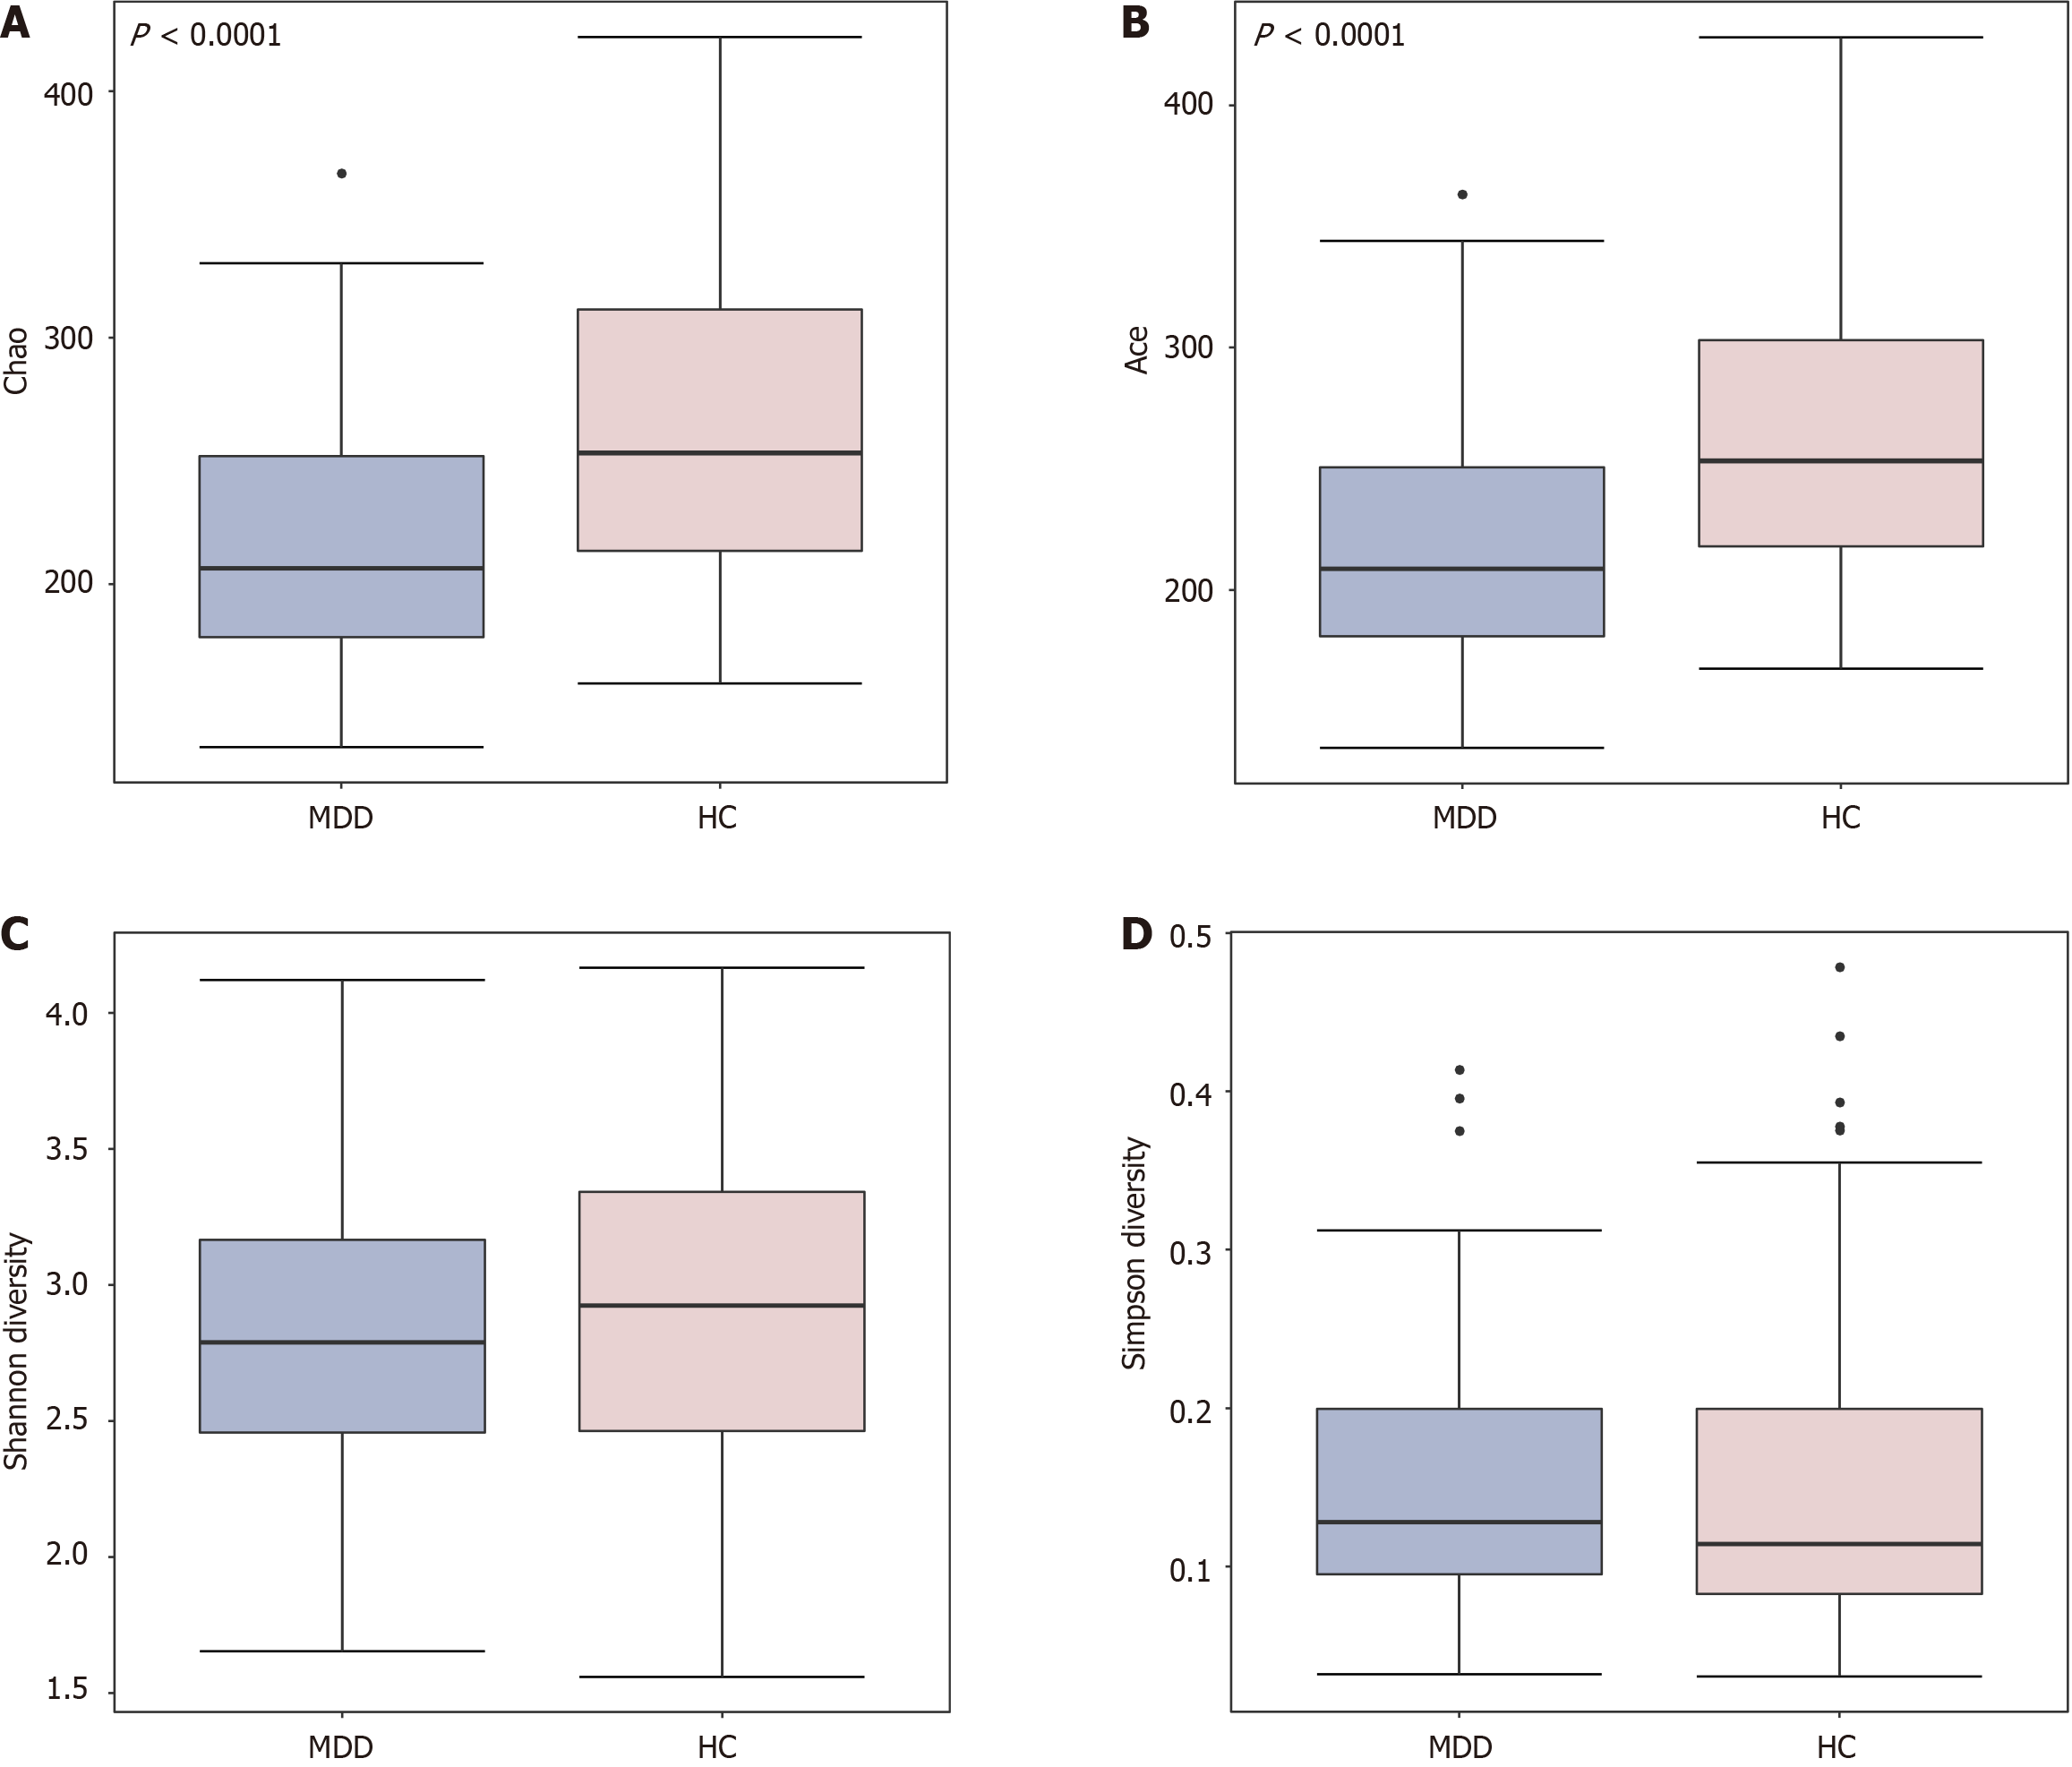
Figure 1 The alpha diversity indices between healthy controls and major depressive disorder groups.
A: Chao; B: Ace; C: Shannon diversity; D: Simpson diversity. Wilcoxon signed-rank test was applied to compare the alpha diversity indices between healthy controls and major depressive disorder groups. MDD: Major depressive disorder; HC: Healthy control.
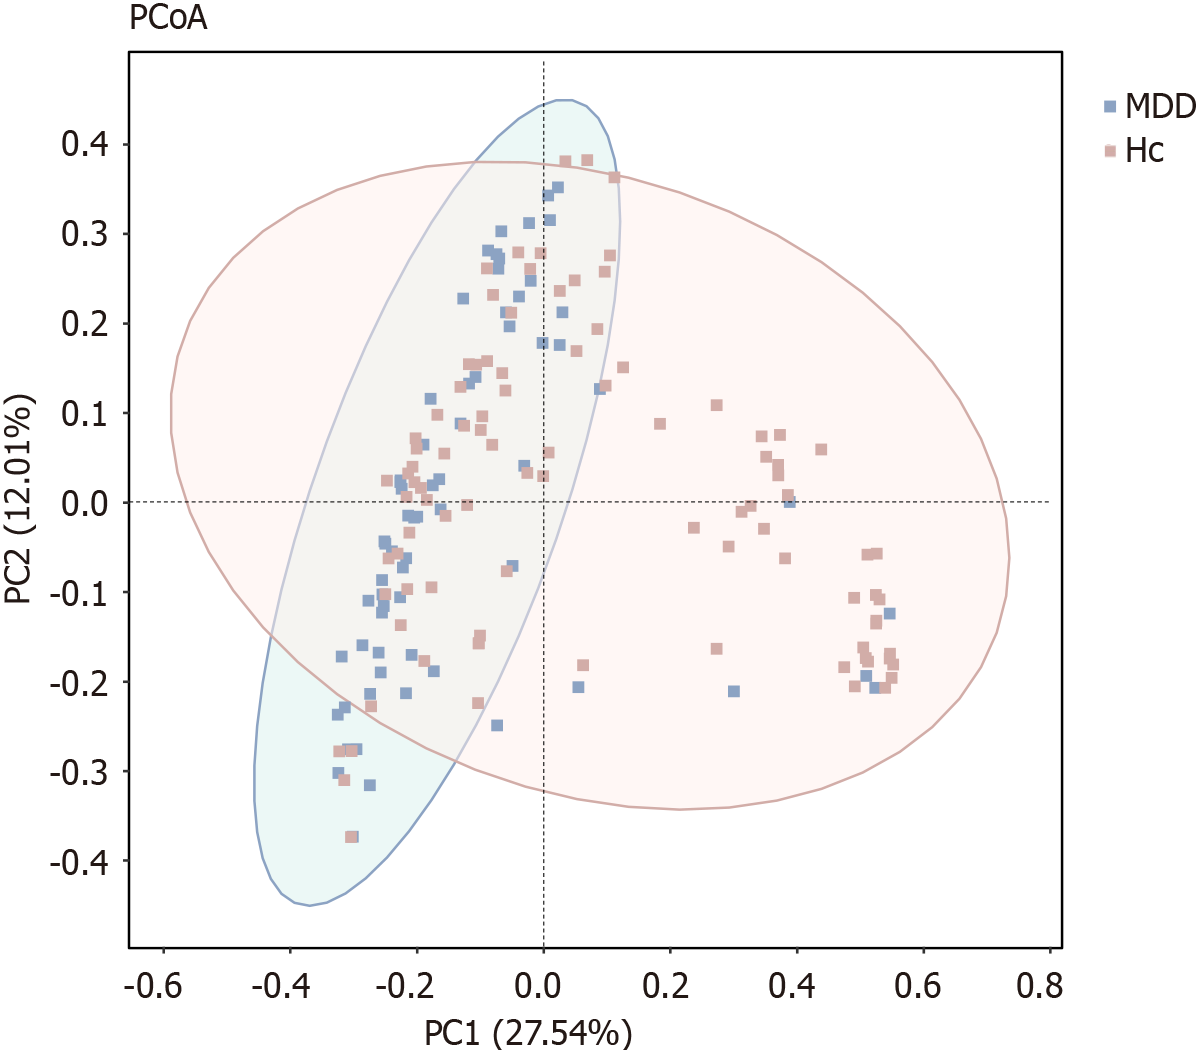
Figure 2 The beta diversity indices between healthy controls and major depressive disorder groups.
The beta diversity distance matrix is displayed using principal coordinate analysis graphs to compare the sample distribution between healthy controls and major depressive disorder groups. Green squares and red points represent major depressive disorder patients and healthy controls, respectively. PCoA: Principal co-ordinates analysis; PC1: Principal component 1; PC2: Principal component 2; MDD: Major depressive disorder; HC: Healthy control.
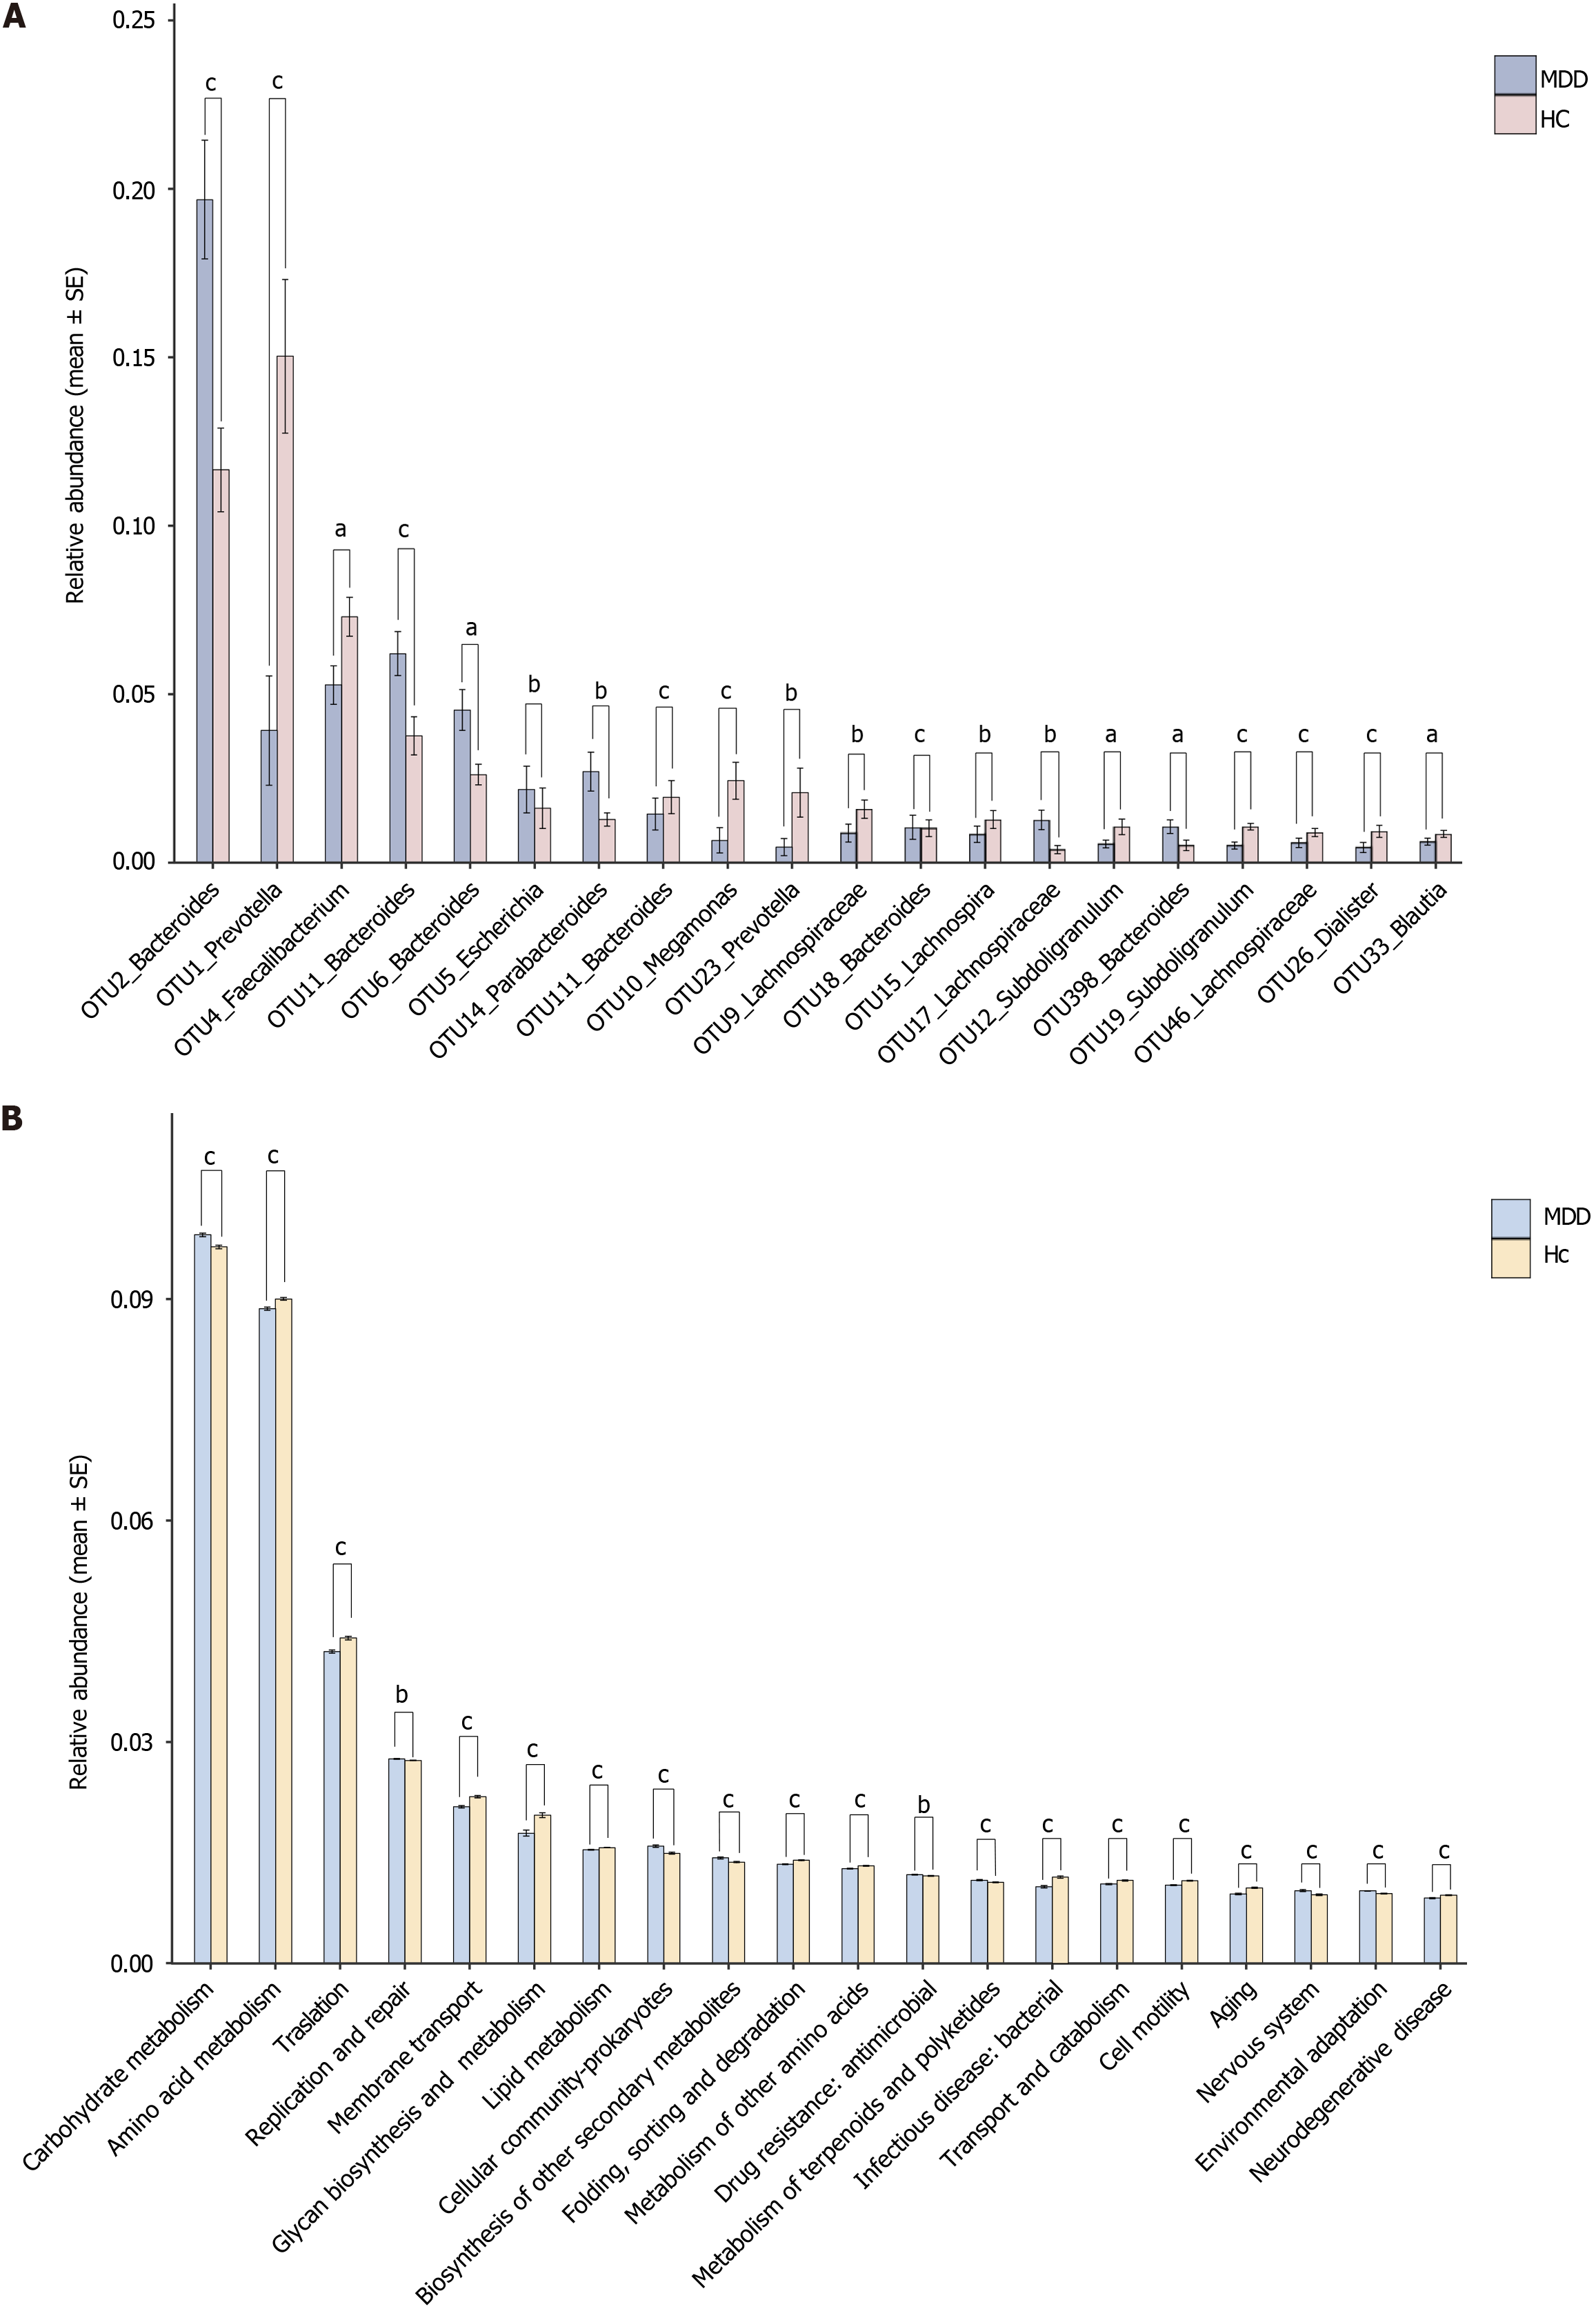
Figure 3 Relative abundance.
A: Comparison of relative abundances between healthy controls and major depressive disorder groups. The top 20 operational taxonomic units with the highest abundance and differences were selected; B: The top 20 functional pathways with the highest abundance and differences. The functional pathways were selected using Phylogenetic Investigation of Communities by Reconstruction of Unobserved States 2. aP < 0.05. bP < 0.01. cP < 0.001. dP < 0.0001. OTU: Operational taxonomic units; MDD: Major depressive disorder; HC: Healthy control.
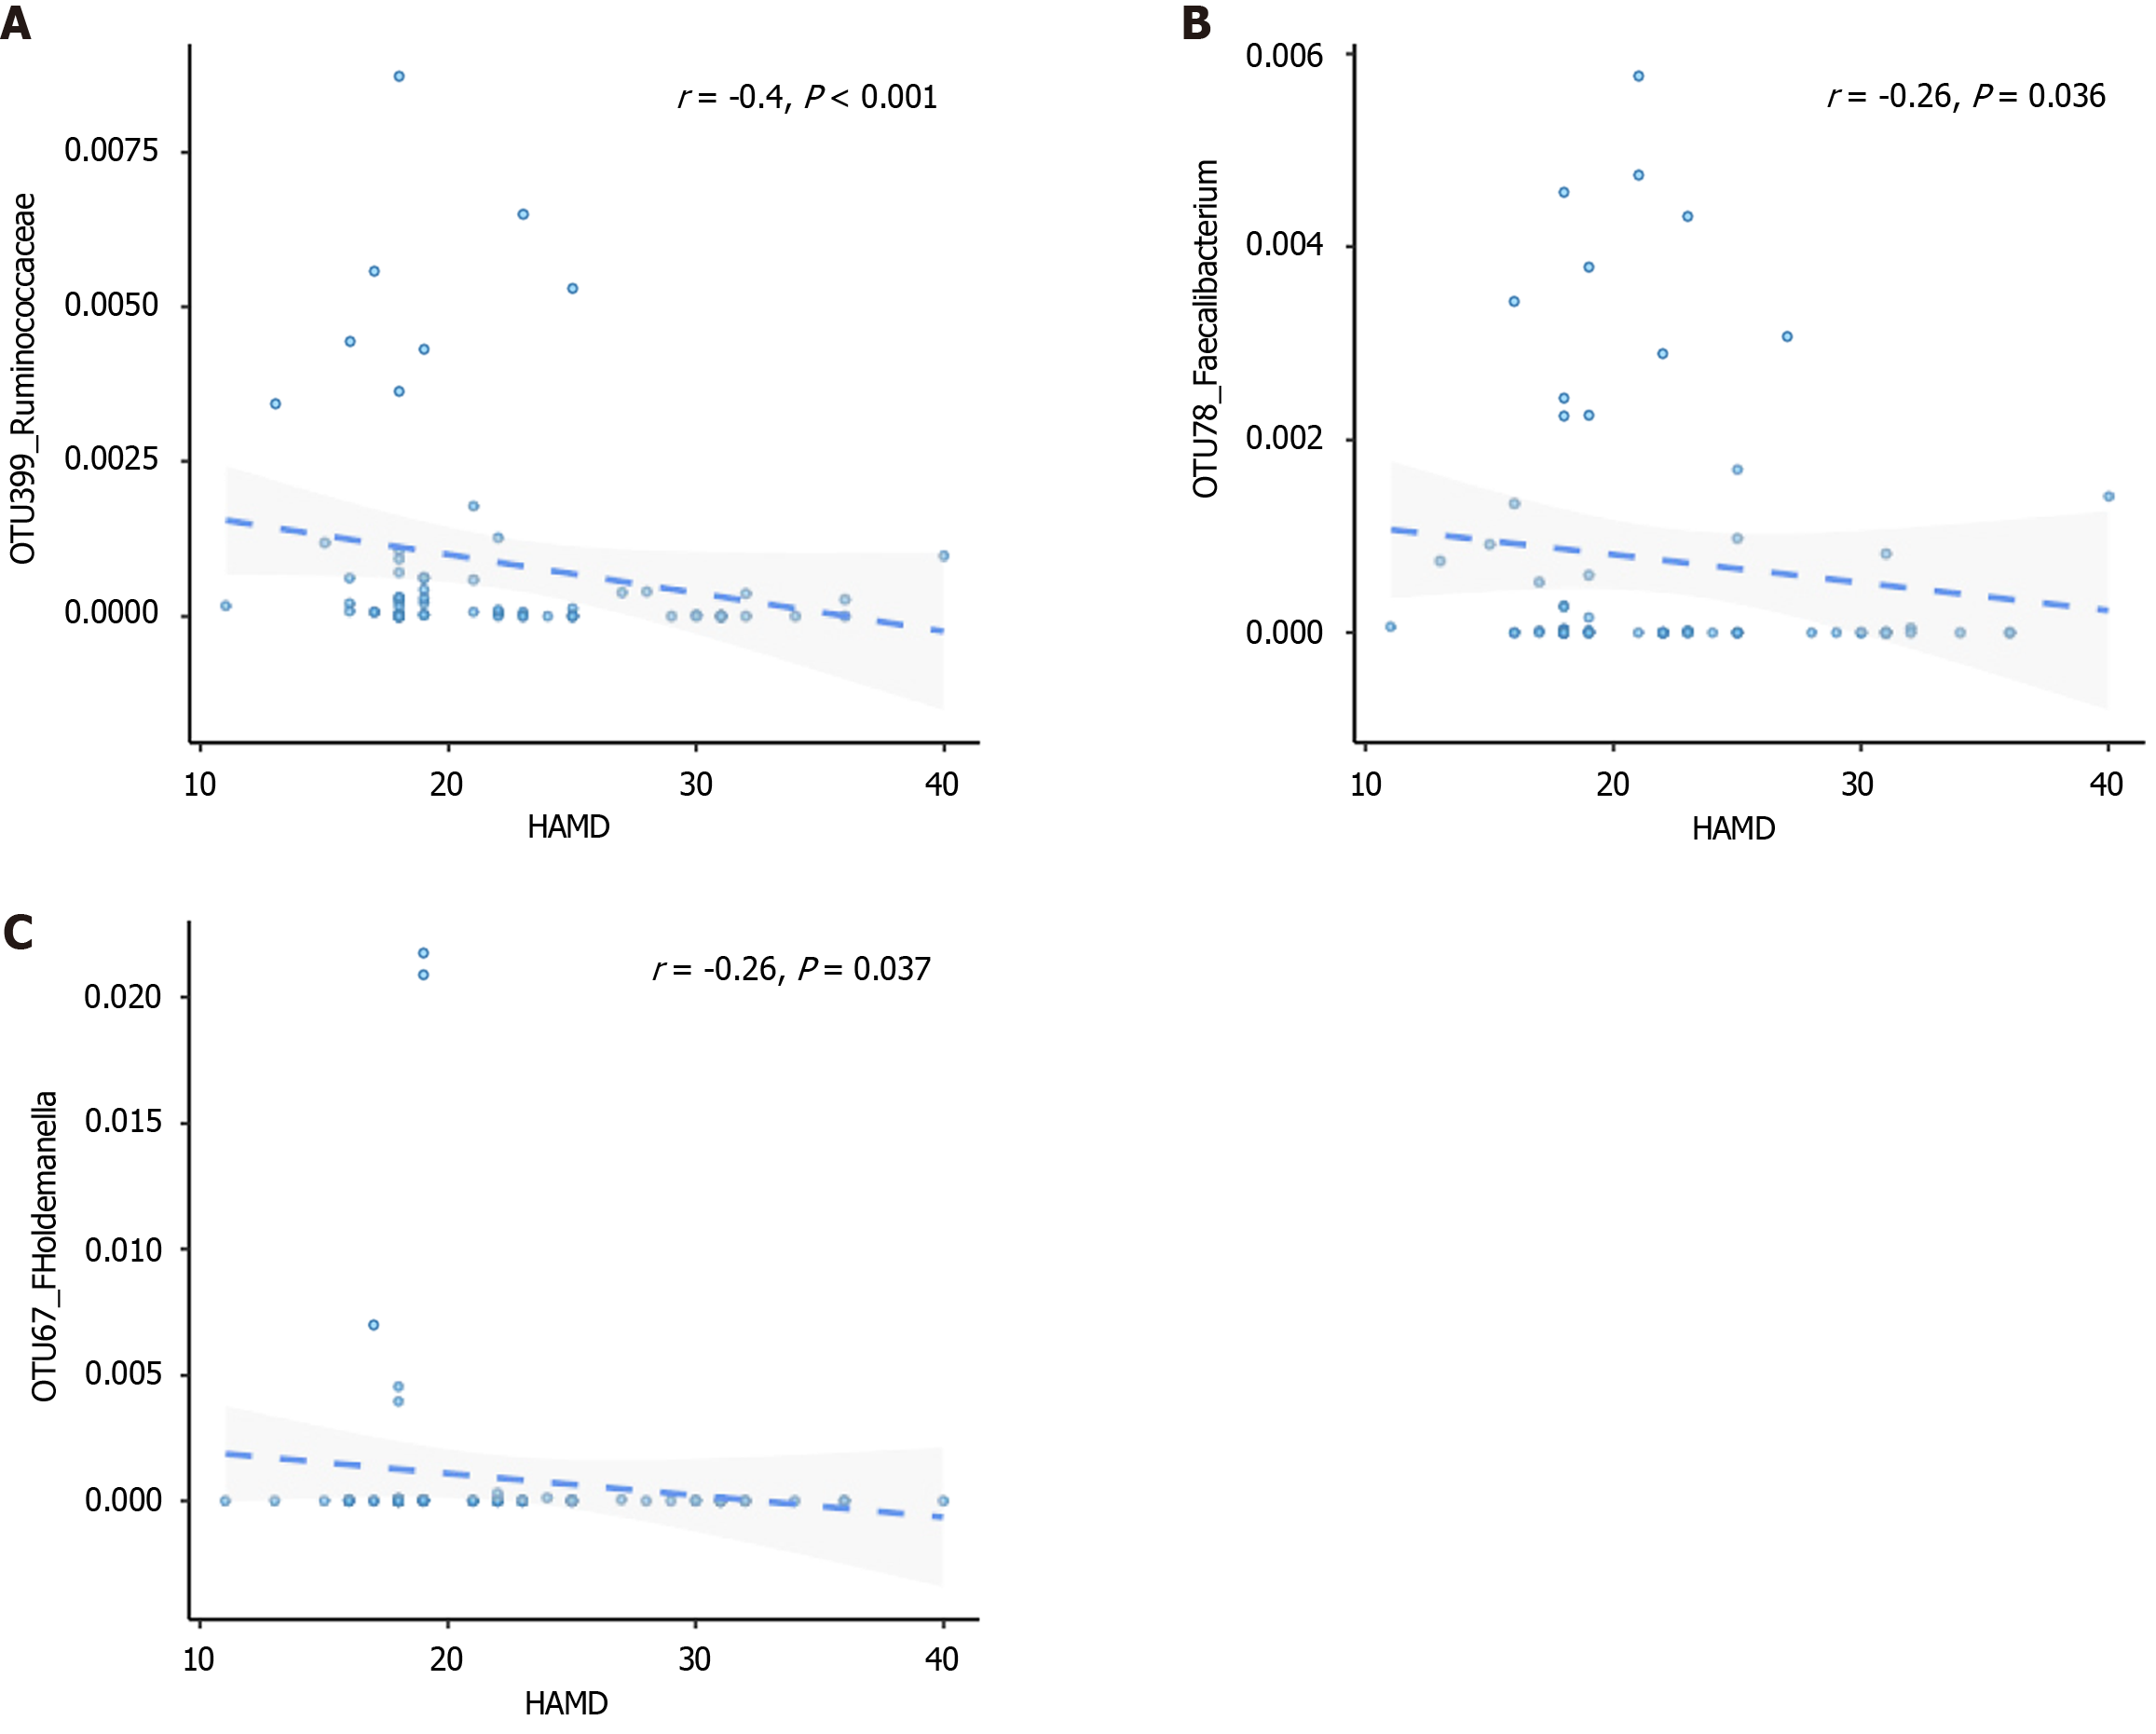
Figure 4 Correlation between Hamilton depression rating scale and gut microbiota.
A: Relationships between Hamilton depression rating scale (HAMD) scores and the relative abundance of Ruminococcaceae; B: Relationships between HAMD scores and the relative abundance of Faecalibacterium; C: Relationships between HAMD scores and the relative abundance of Holdemanella. The correlations were evaluated using Spearman correlation analysis. OTU: Operational taxonomic units; HAMD: Hamilton depression rating scale.
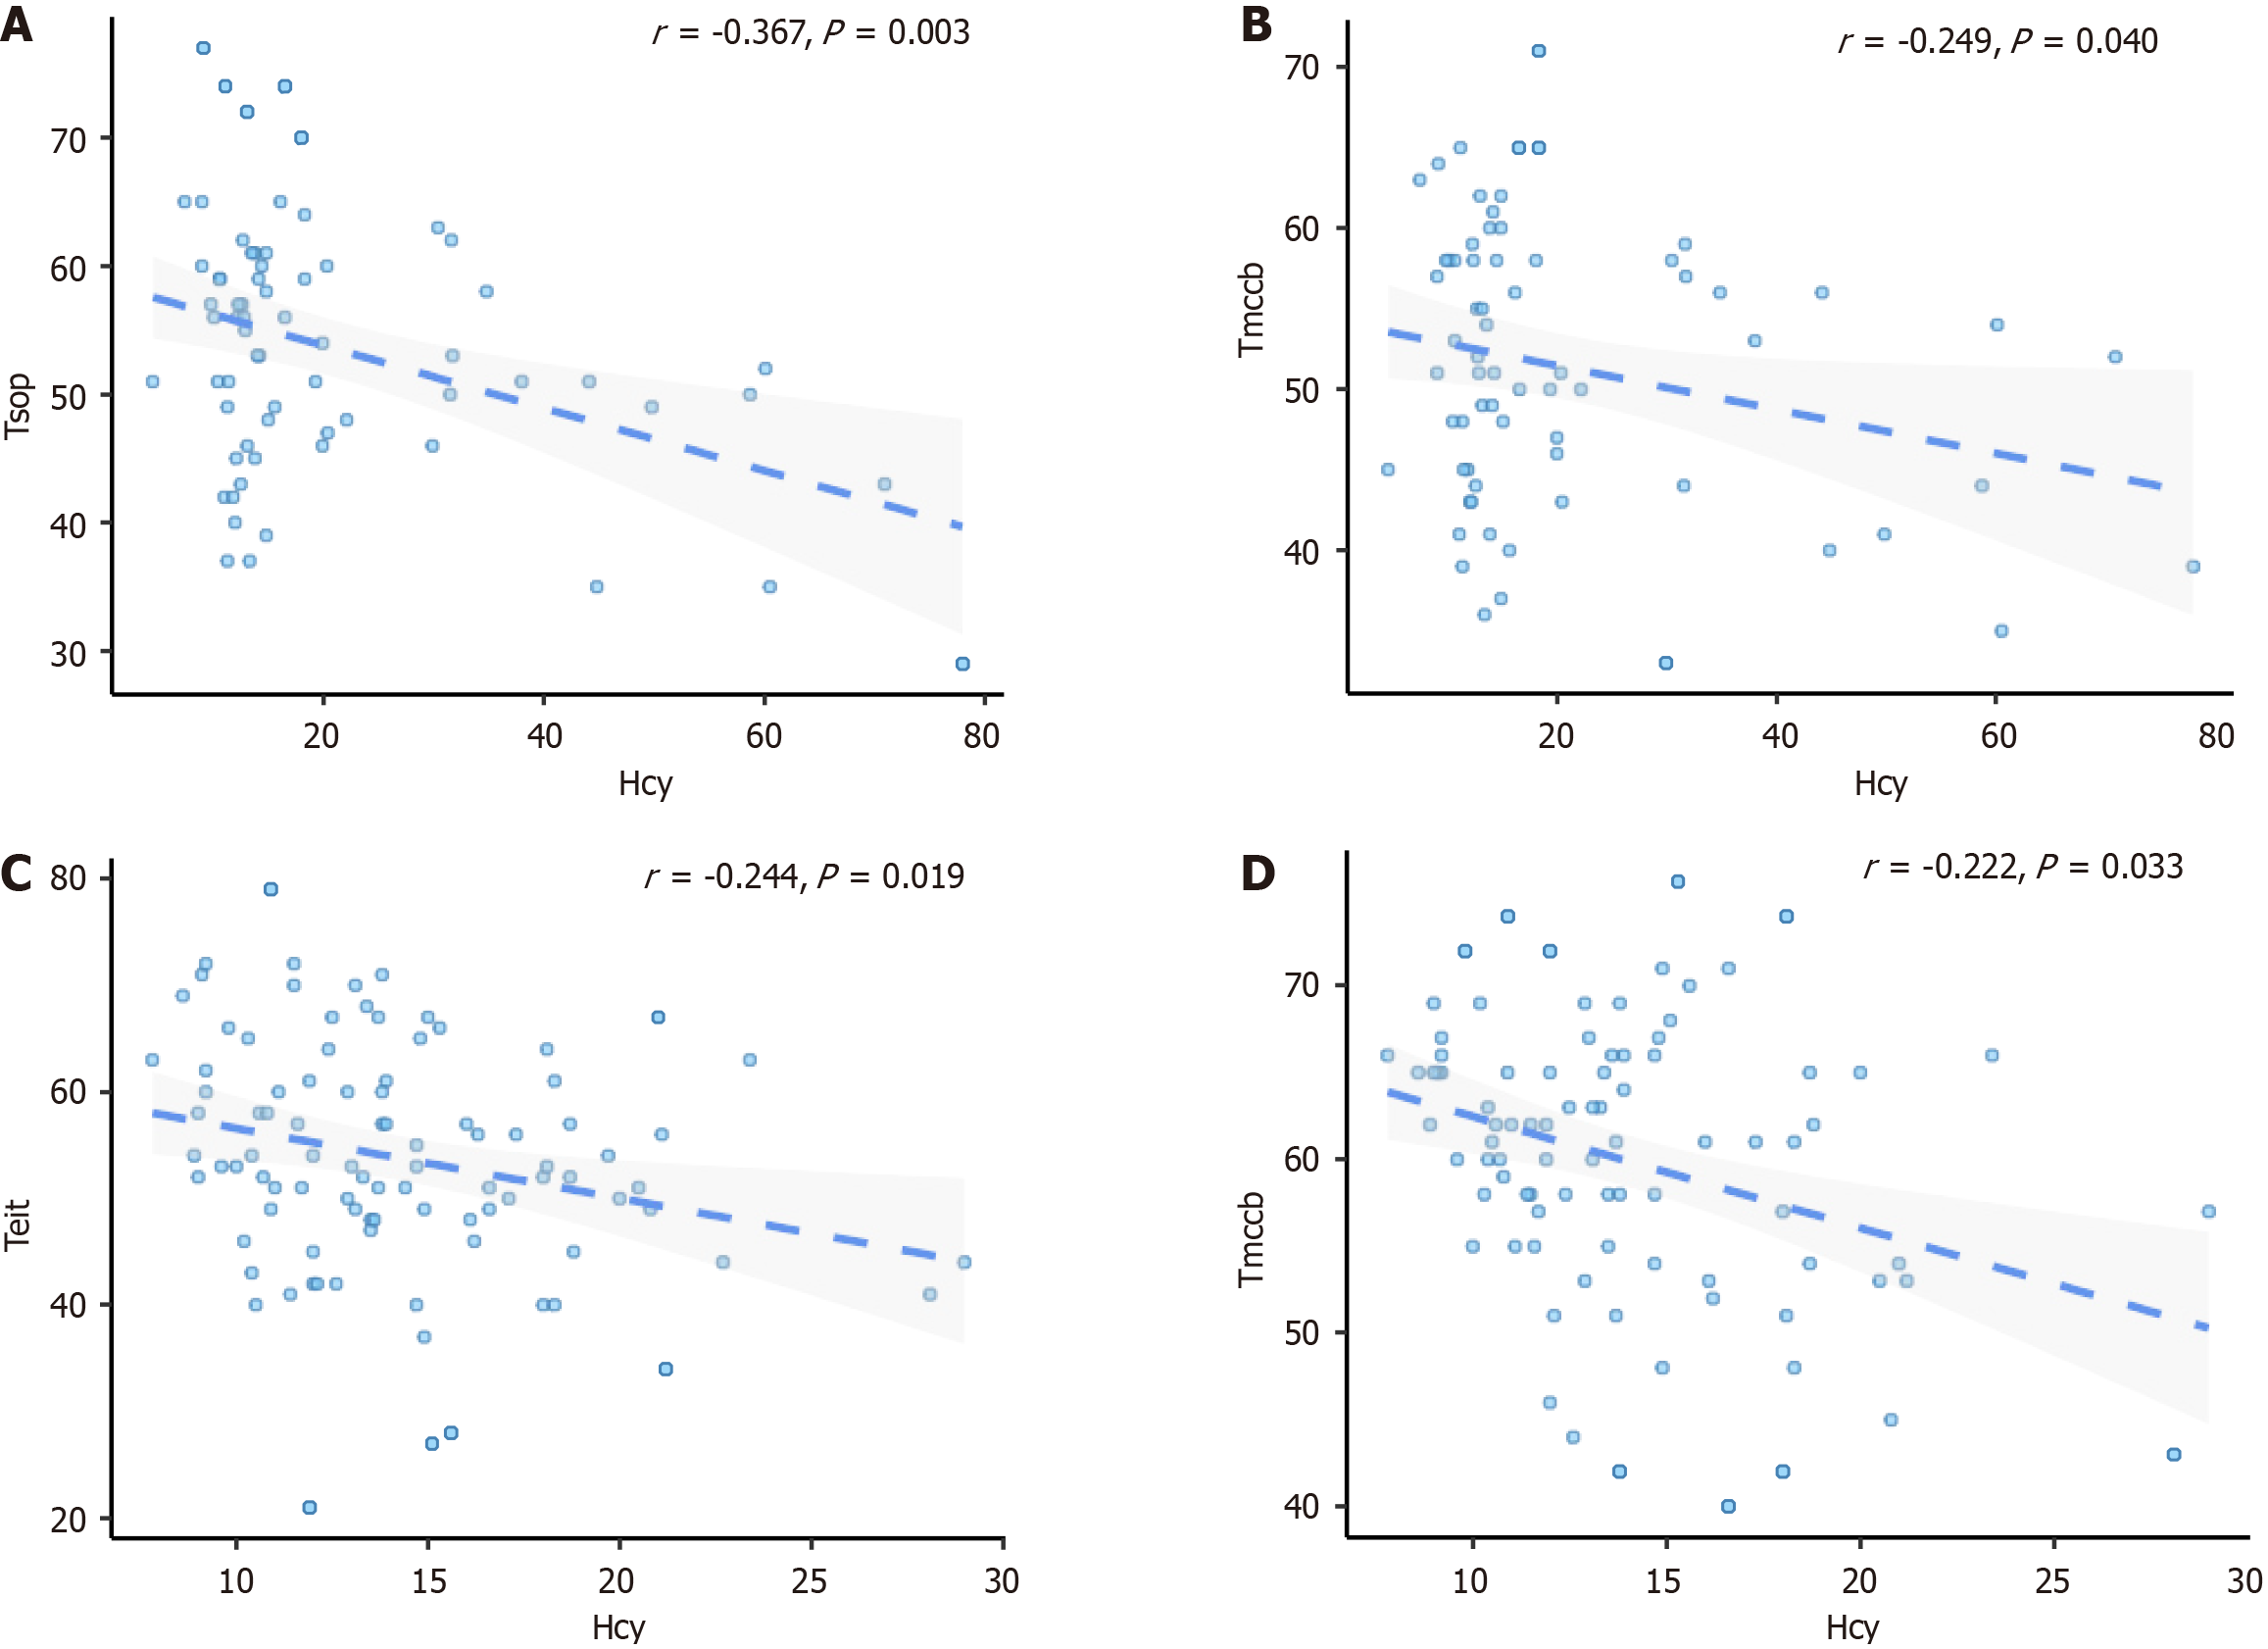
Figure 5 Correlation between cognitive function and homocysteine in healthy controls and major depressive disorder groups.
A: Partial correlation analysis between homocysteine (Hcy) and speed of processing in the major depressive disorder (MDD) group; B: Partial correlation analysis between Hcy and total score in the MDD group; C: Partial correlation analysis between Hcy and social cognition in healthy controls (HCs); D: Partial correlation analysis between Hcy and total score in HCs. Hcy: Homocysteine; SOP: Speed of processing; EIT: Social cognition; MCCB: MATRICS consensus cognitive battery.
Figure 6 Associations between serum homocysteine and intestinal flora.
The associations in healthy controls and major depressive disorder groups. aP < 0.05. bP < 0.01. cP < 0.001. dP < 0.0001. OTU: Operational taxonomic units; MDD: Major depressive disorder; HC: Healthy control.
- Citation: Xu CC, Zhao WX, Sheng Y, Yun YJ, Ma T, Fan N, Song JQ, Wang J, Zhang Q. Serum homocysteine showed potential association with cognition and abnormal gut microbiome in major depressive disorder. World J Psychiatry 2025; 15(3): 102567
- URL: https://www.wjgnet.com/2220-3206/full/v15/i3/102567.htm
- DOI: https://dx.doi.org/10.5498/wjp.v15.i3.102567


