Copyright
©The Author(s) 2025.
World J Psychiatry. Feb 19, 2025; 15(2): 99996
Published online Feb 19, 2025. doi: 10.5498/wjp.v15.i2.99996
Published online Feb 19, 2025. doi: 10.5498/wjp.v15.i2.99996
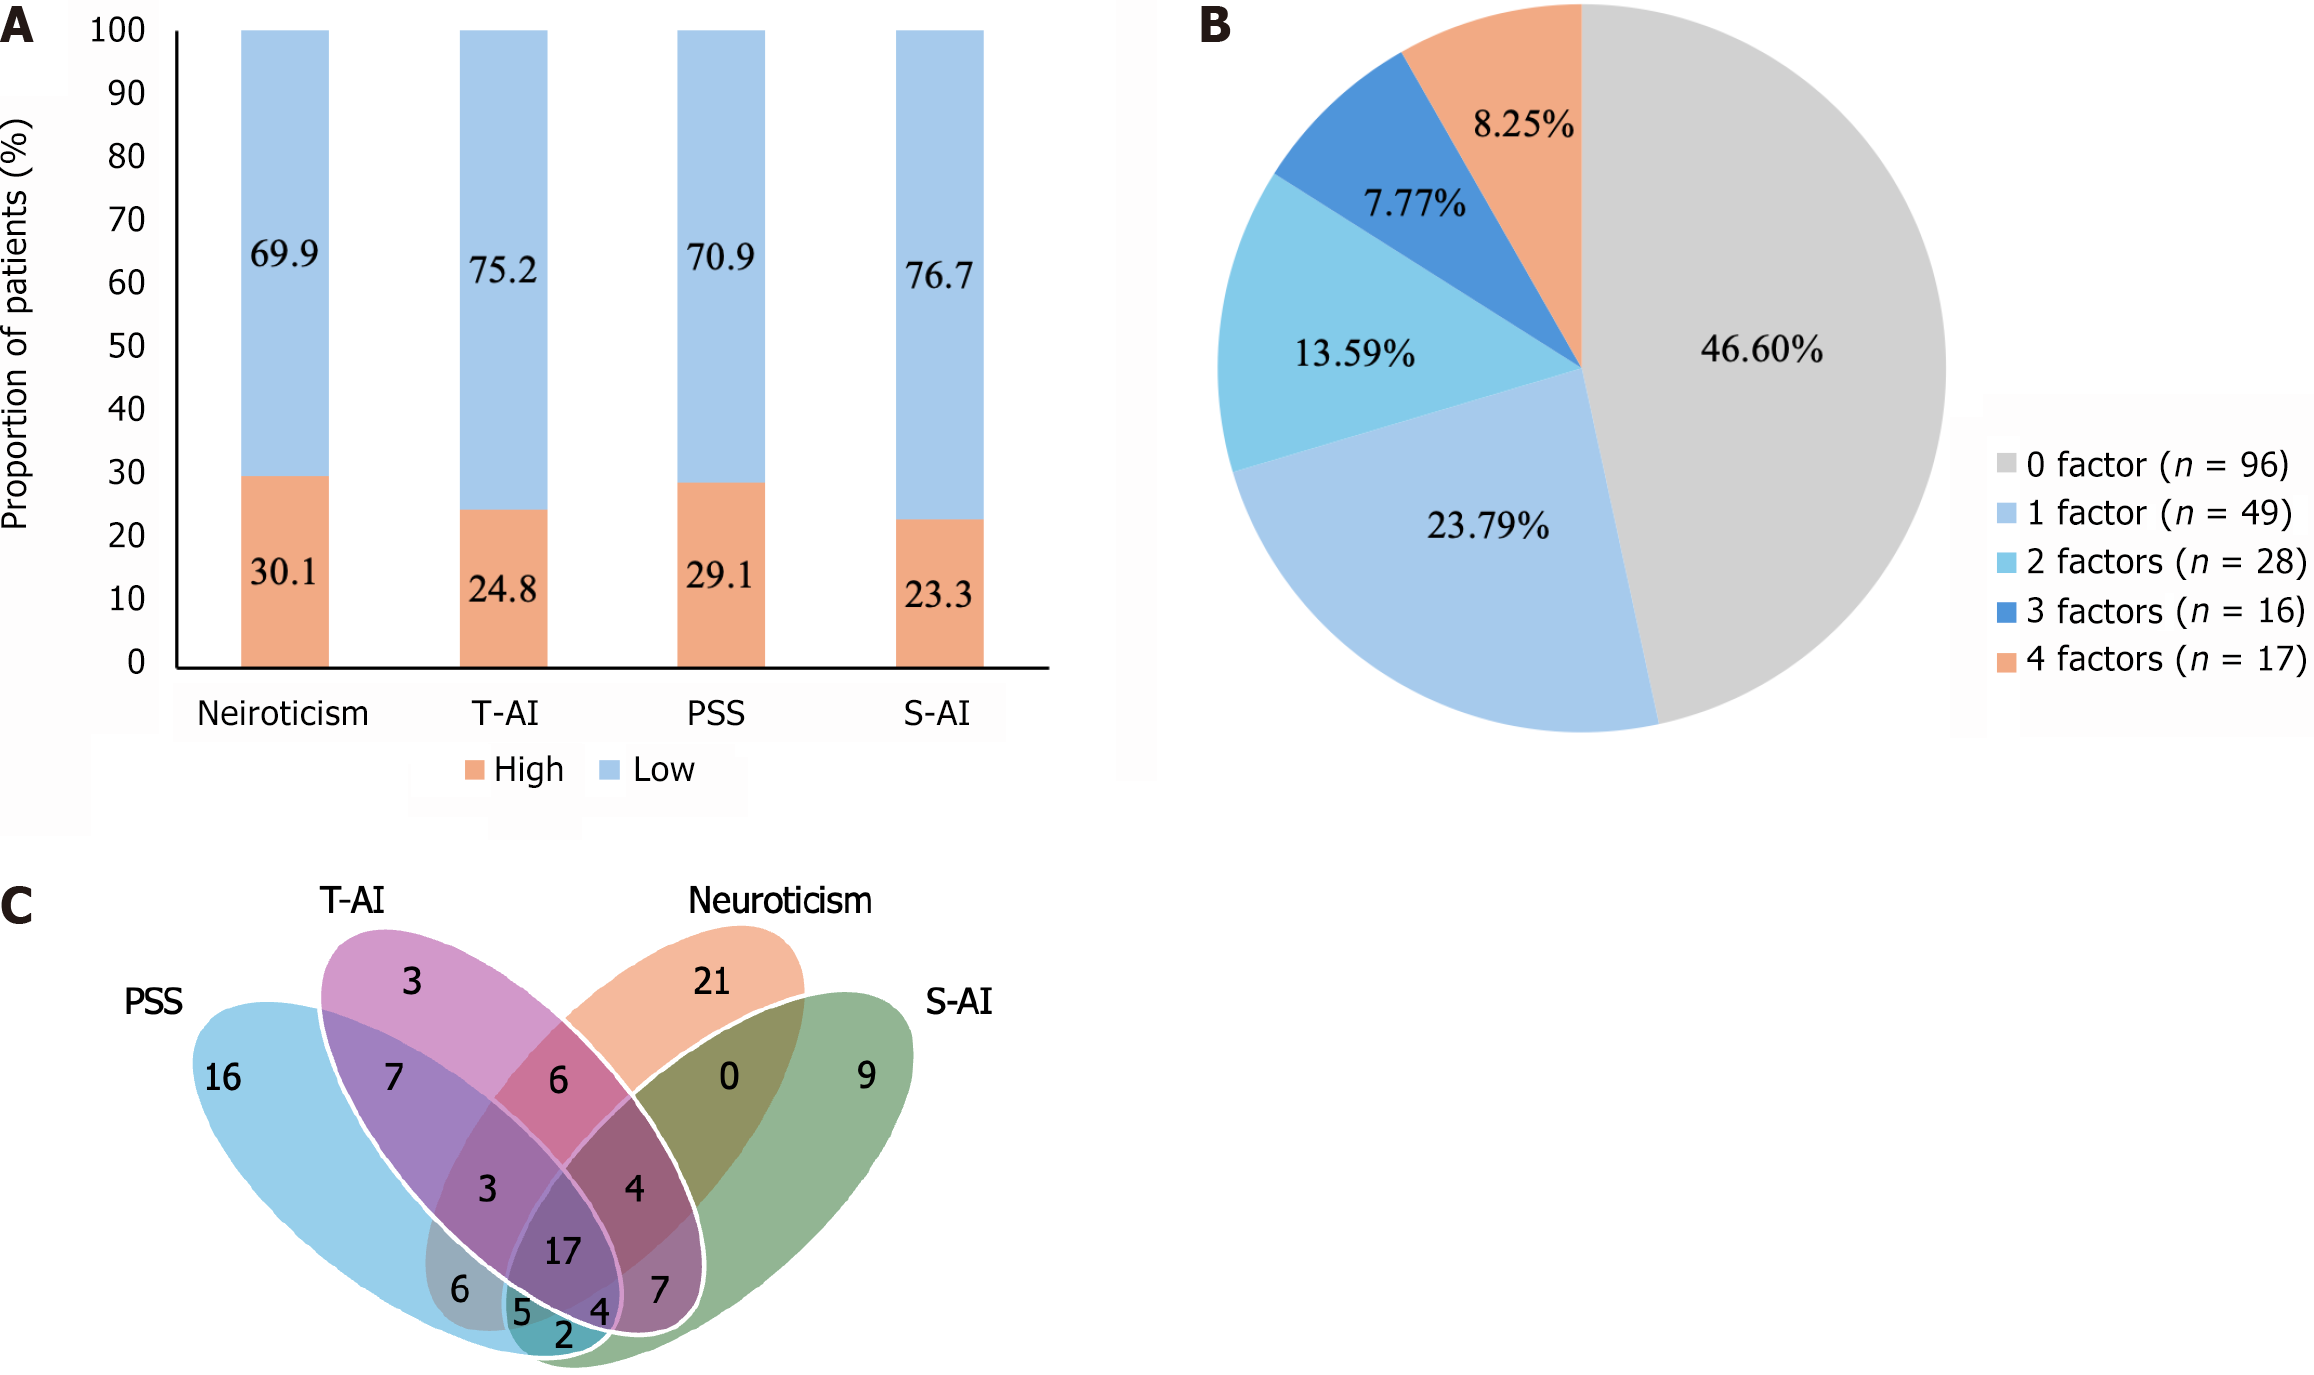
Figure 1 The proportion of stress-sensitivity factors in patients with major depressive disorders.
A: The proportion of patients with high- or low-level stress-sensitivity factors; B: The proportion of patients with different numbers of high-level stress-sensitivity factors; C: Venn diagram revealing the overlap between high-level stress-sensitivity factors in patients. PSS: Perceived Stress Scale; T-AI: Trait Anxiety Inventory of State-Trait Anxiety Inventory; S-AI: State Anxiety Inventory of State-Trait Anxiety Inventory.
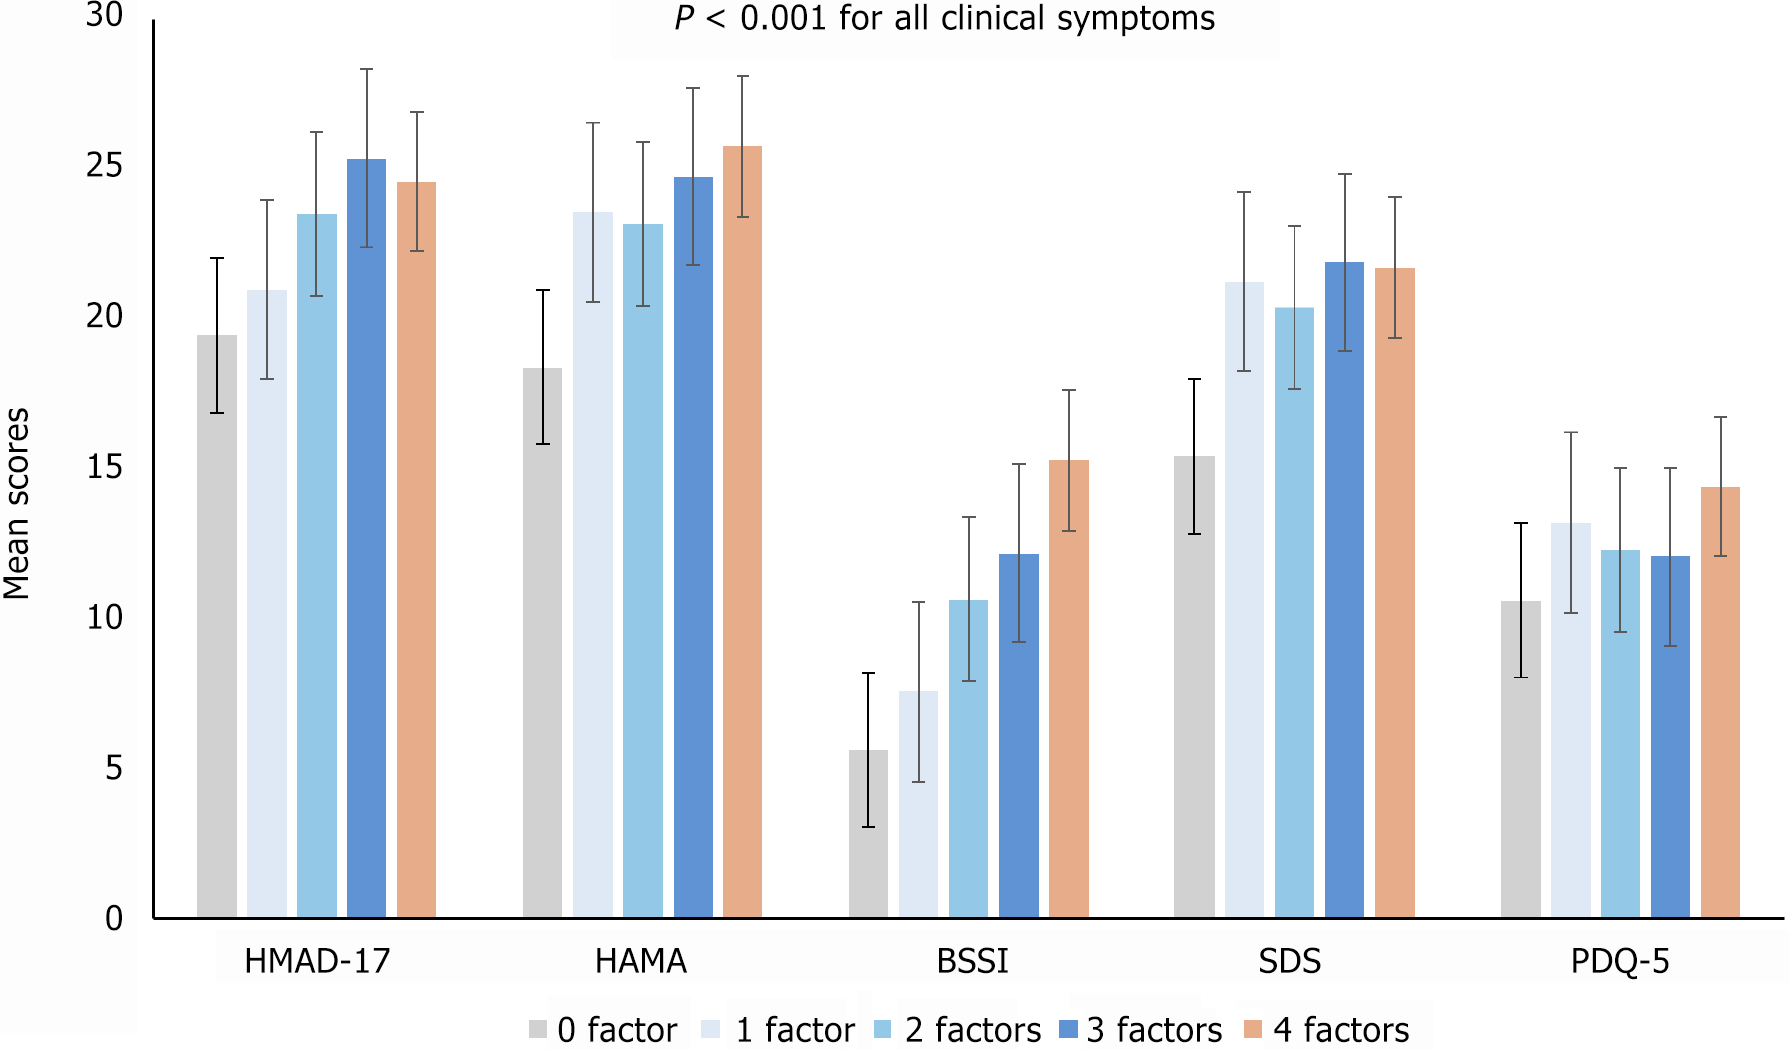
Figure 2 Gradual increase in severity of clinical manifestations at baseline with an increasing number of high-level stress-sensitivity factors in patients with major depressive disorders.
The P values are obtained from the analysis of variance with linear trend analysis. All P < 0.001. Error bars represent the 95% confidence intervals. HAMD-17: 17-item Hamilton Depression Scale; HAMA: Hamilton Anxiety Scale; BSSI: Beck Scale for Suicide Ideation; SDS: Sheehan Disability Scale; PDQ-5: Perceived Deficits Questionnaire five-item version.
- Citation: Qin XM, Xu MQ, Qin YQ, Shao FZ, Ma MH, Ou WW, Lv GY, Zhang QQ, Chen WT, Zhao XT, Deng AQ, Xiong JT, Zeng LS, Peng YL, Huang M, Xu SY, Liao M, Zhang L, Li LJ, Ju YM, Liu J, Liu BS, Zhang Y. Cumulative effects of stress-sensitivity factors on depressive symptoms and suicide risk: A prospective study. World J Psychiatry 2025; 15(2): 99996
- URL: https://www.wjgnet.com/2220-3206/full/v15/i2/99996.htm
- DOI: https://dx.doi.org/10.5498/wjp.v15.i2.99996


