Copyright
©The Author(s) 2025.
World J Psychiatry. Feb 19, 2025; 15(2): 102344
Published online Feb 19, 2025. doi: 10.5498/wjp.v15.i2.102344
Published online Feb 19, 2025. doi: 10.5498/wjp.v15.i2.102344
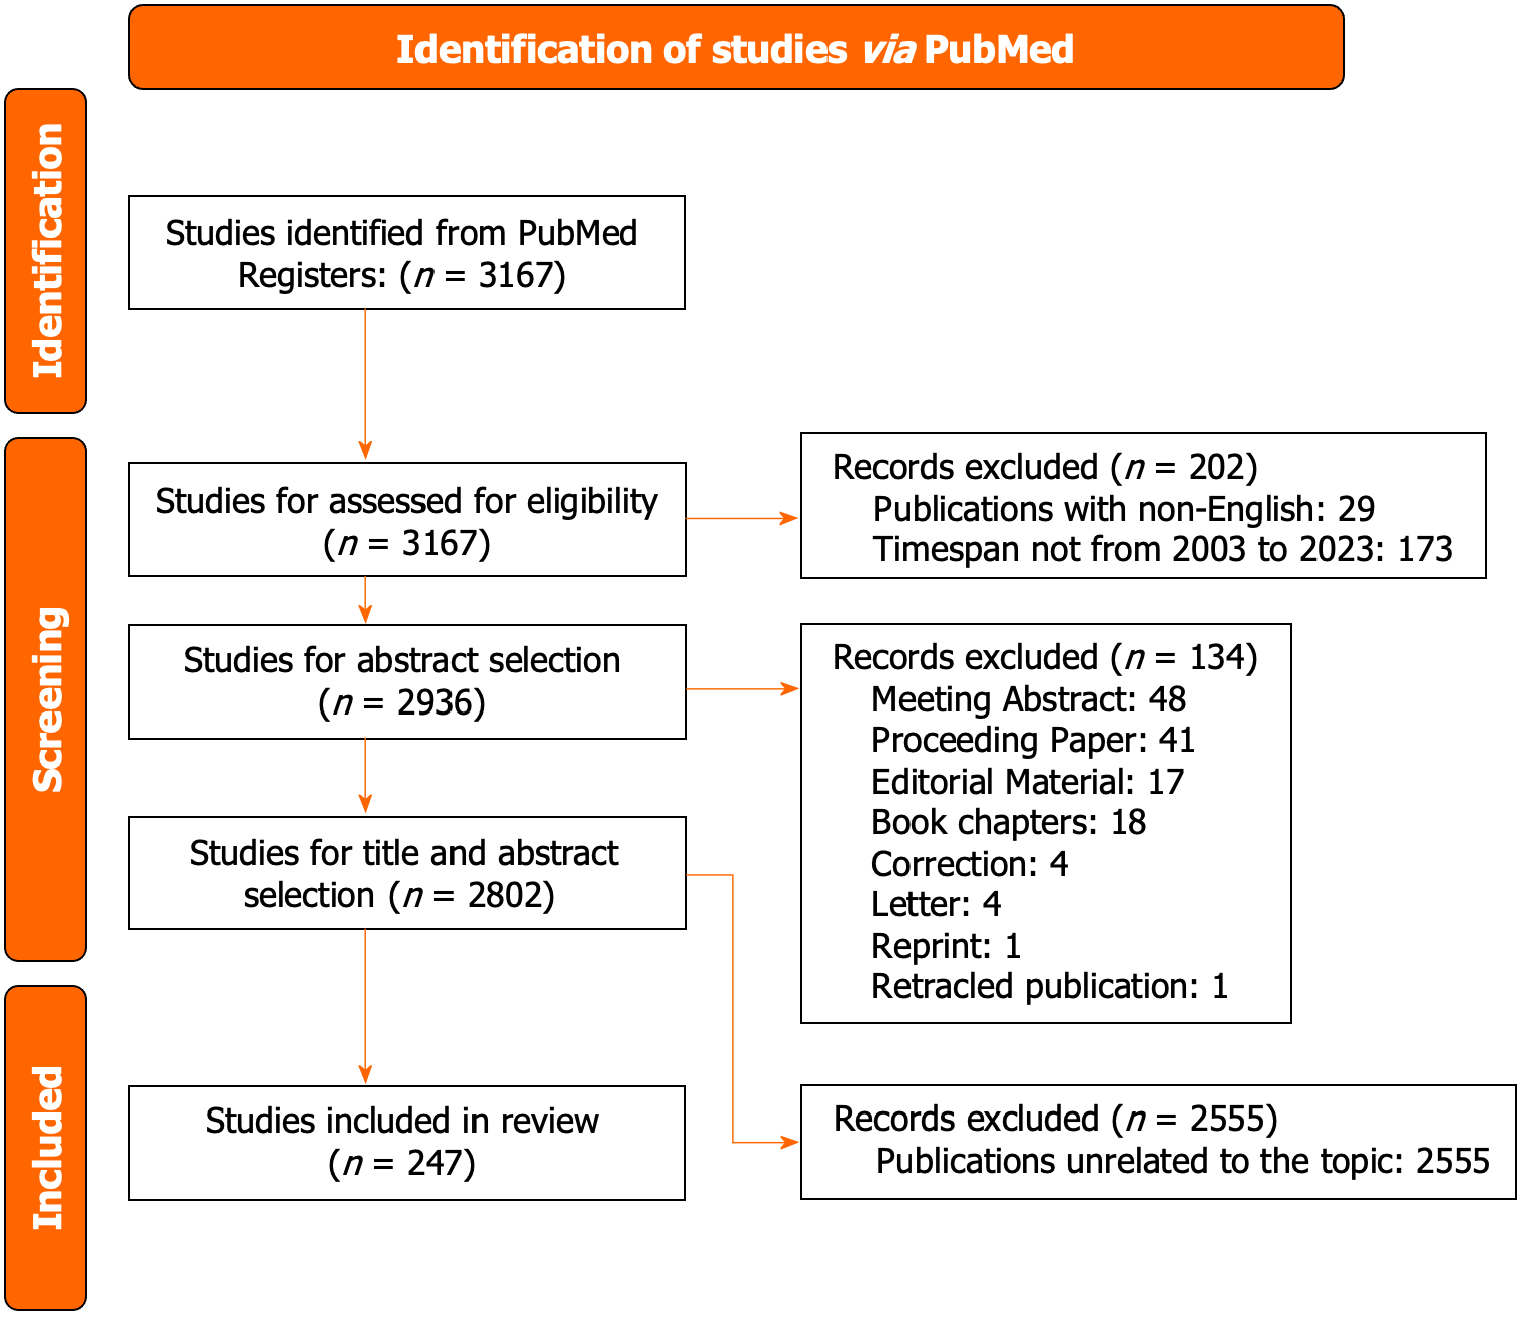
Figure 1 Flowchart of the article screening process and analysis methods.
Three steps are shown on the left of flowchart, which are identification, screening, and included respectively. The specific progress of each step is on the right of flowchart.
Figure 2 Trends of the related annual publications.
The horizontal axis shows the year of publication, and the vertical axis shows the annual number of publications.
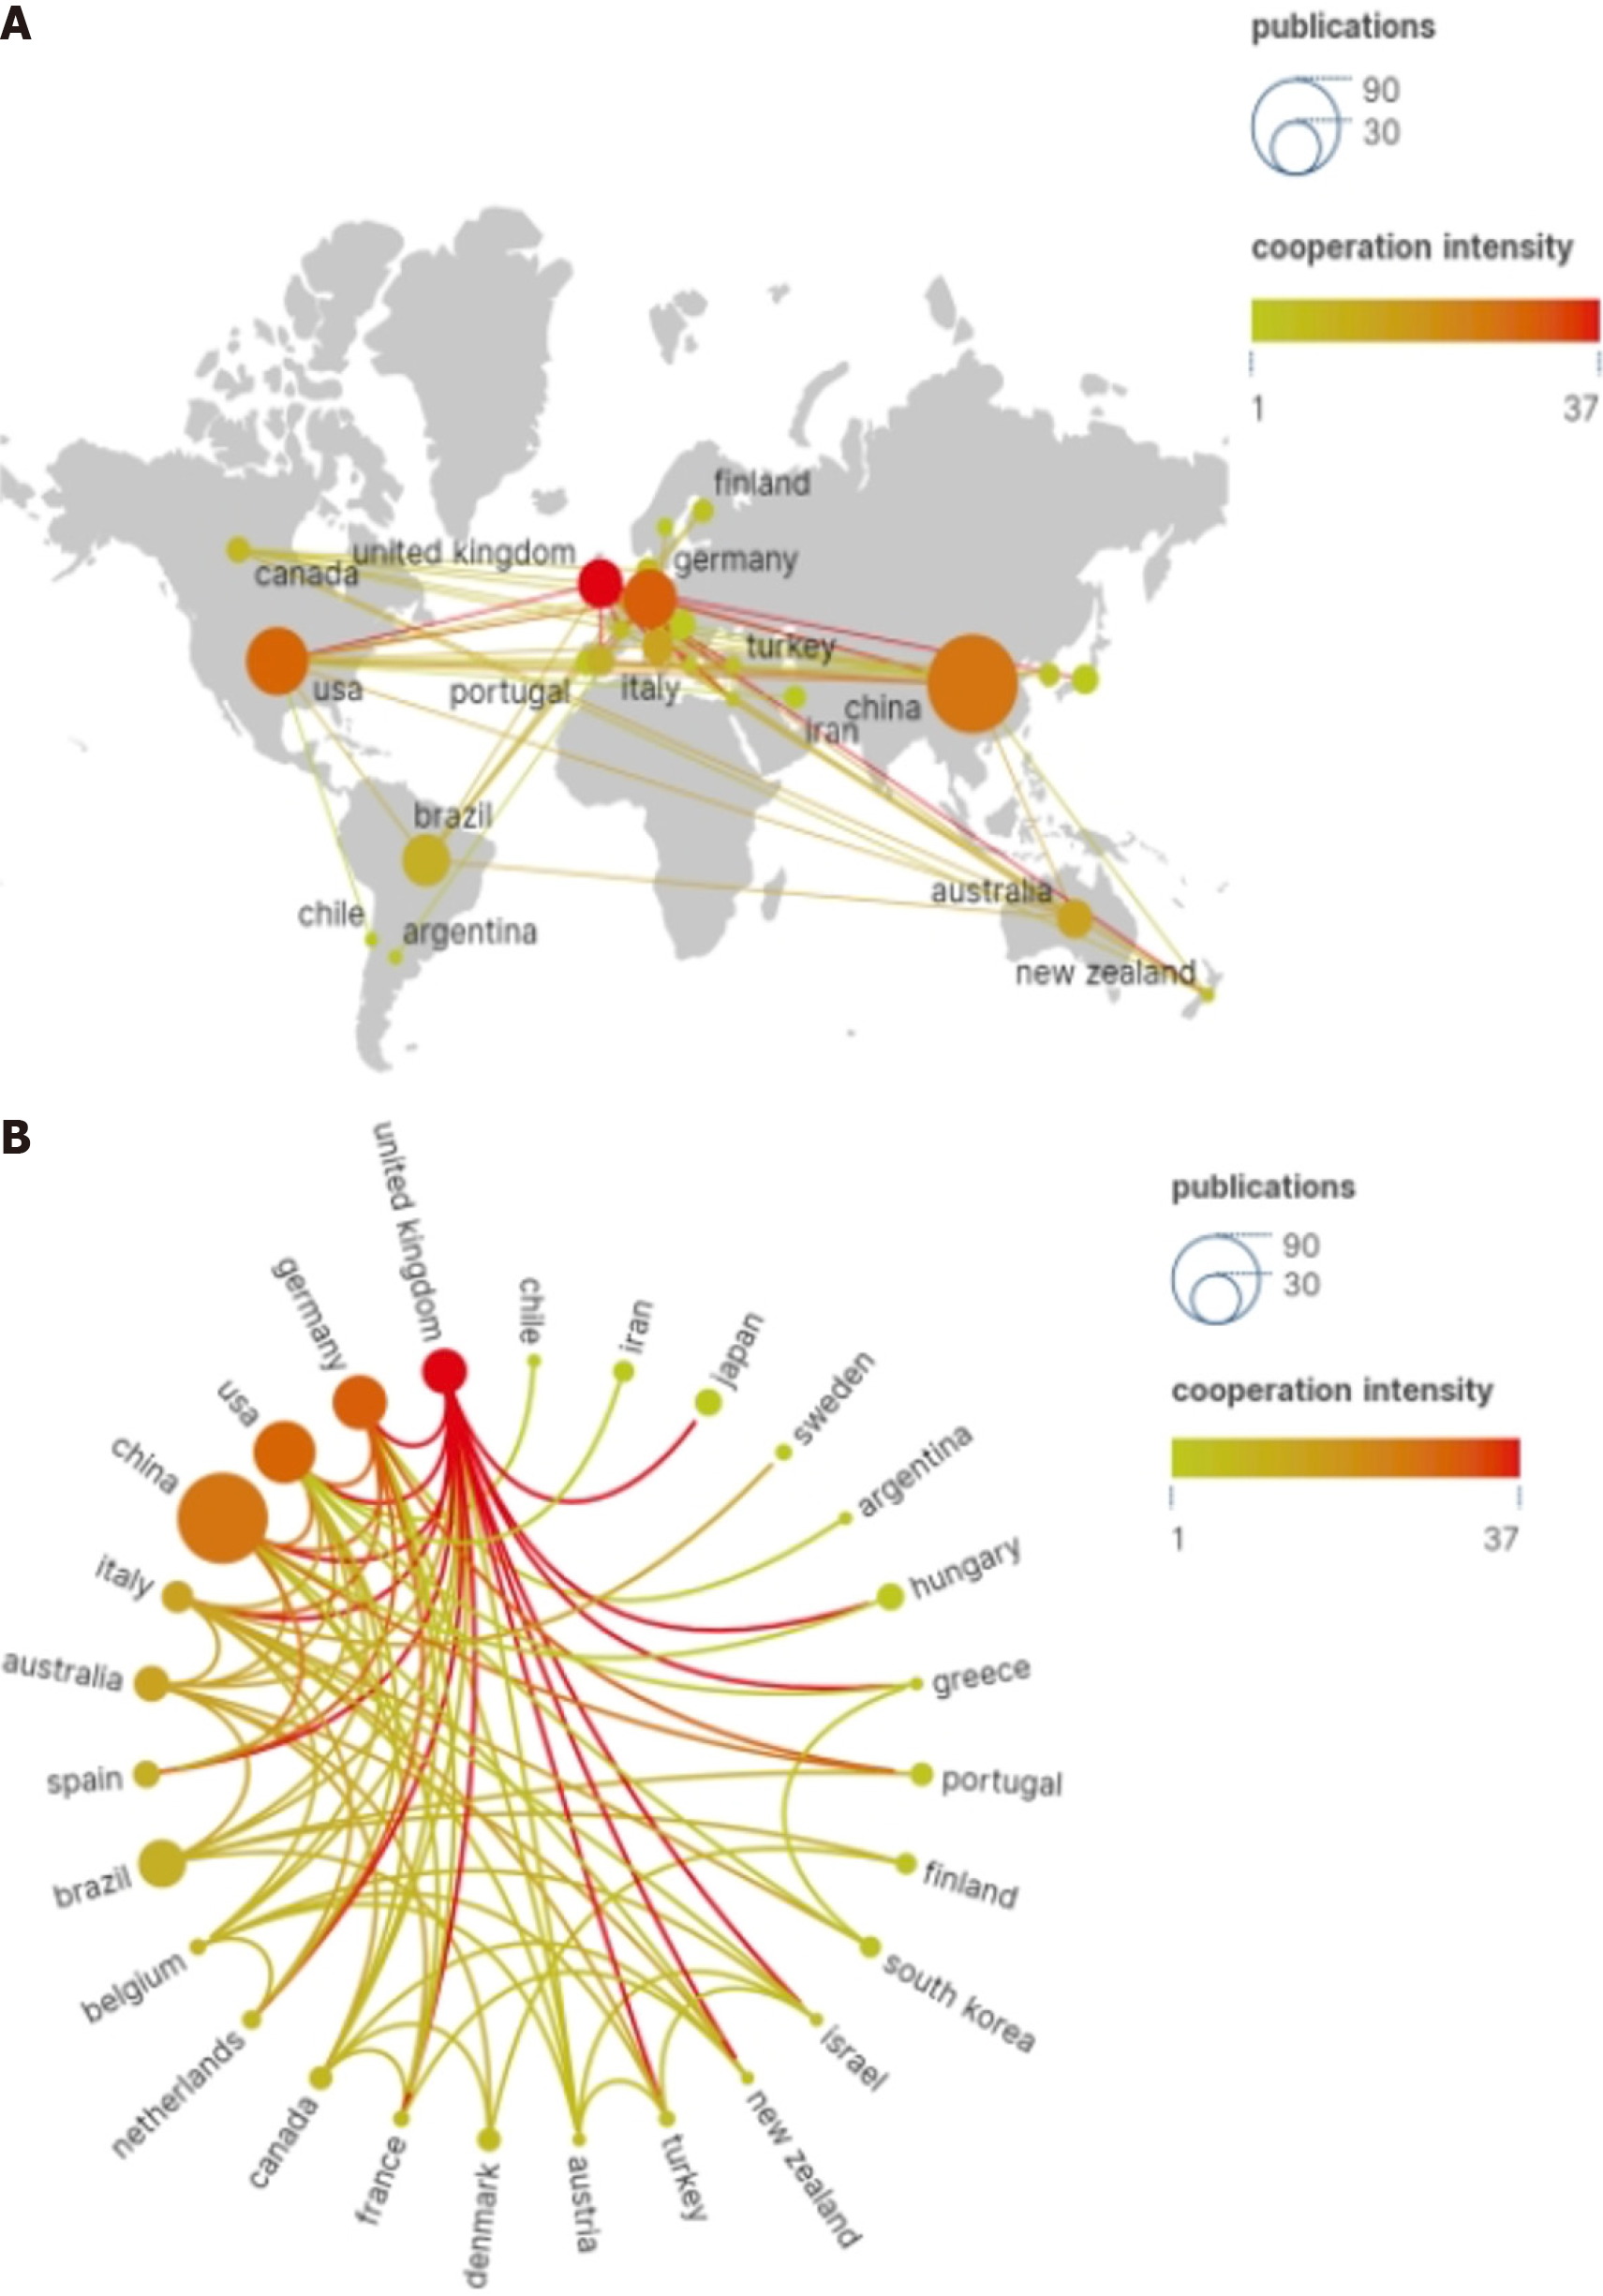
Figure 3 Cooperation between countries.
A: World map of the intensity of cooperation between countries; B: Circle diagram of international collaboration between countries. In these two visual maps, each node is a country, and the links between countries represent cooperative relations. The size of each node is proportional to the total number of publications. The red nodes indicate that there are more cooperative publications between the country and other countries, while the thicker connecting lines between the nodes indicate that the cooperation between the two countries is closer.
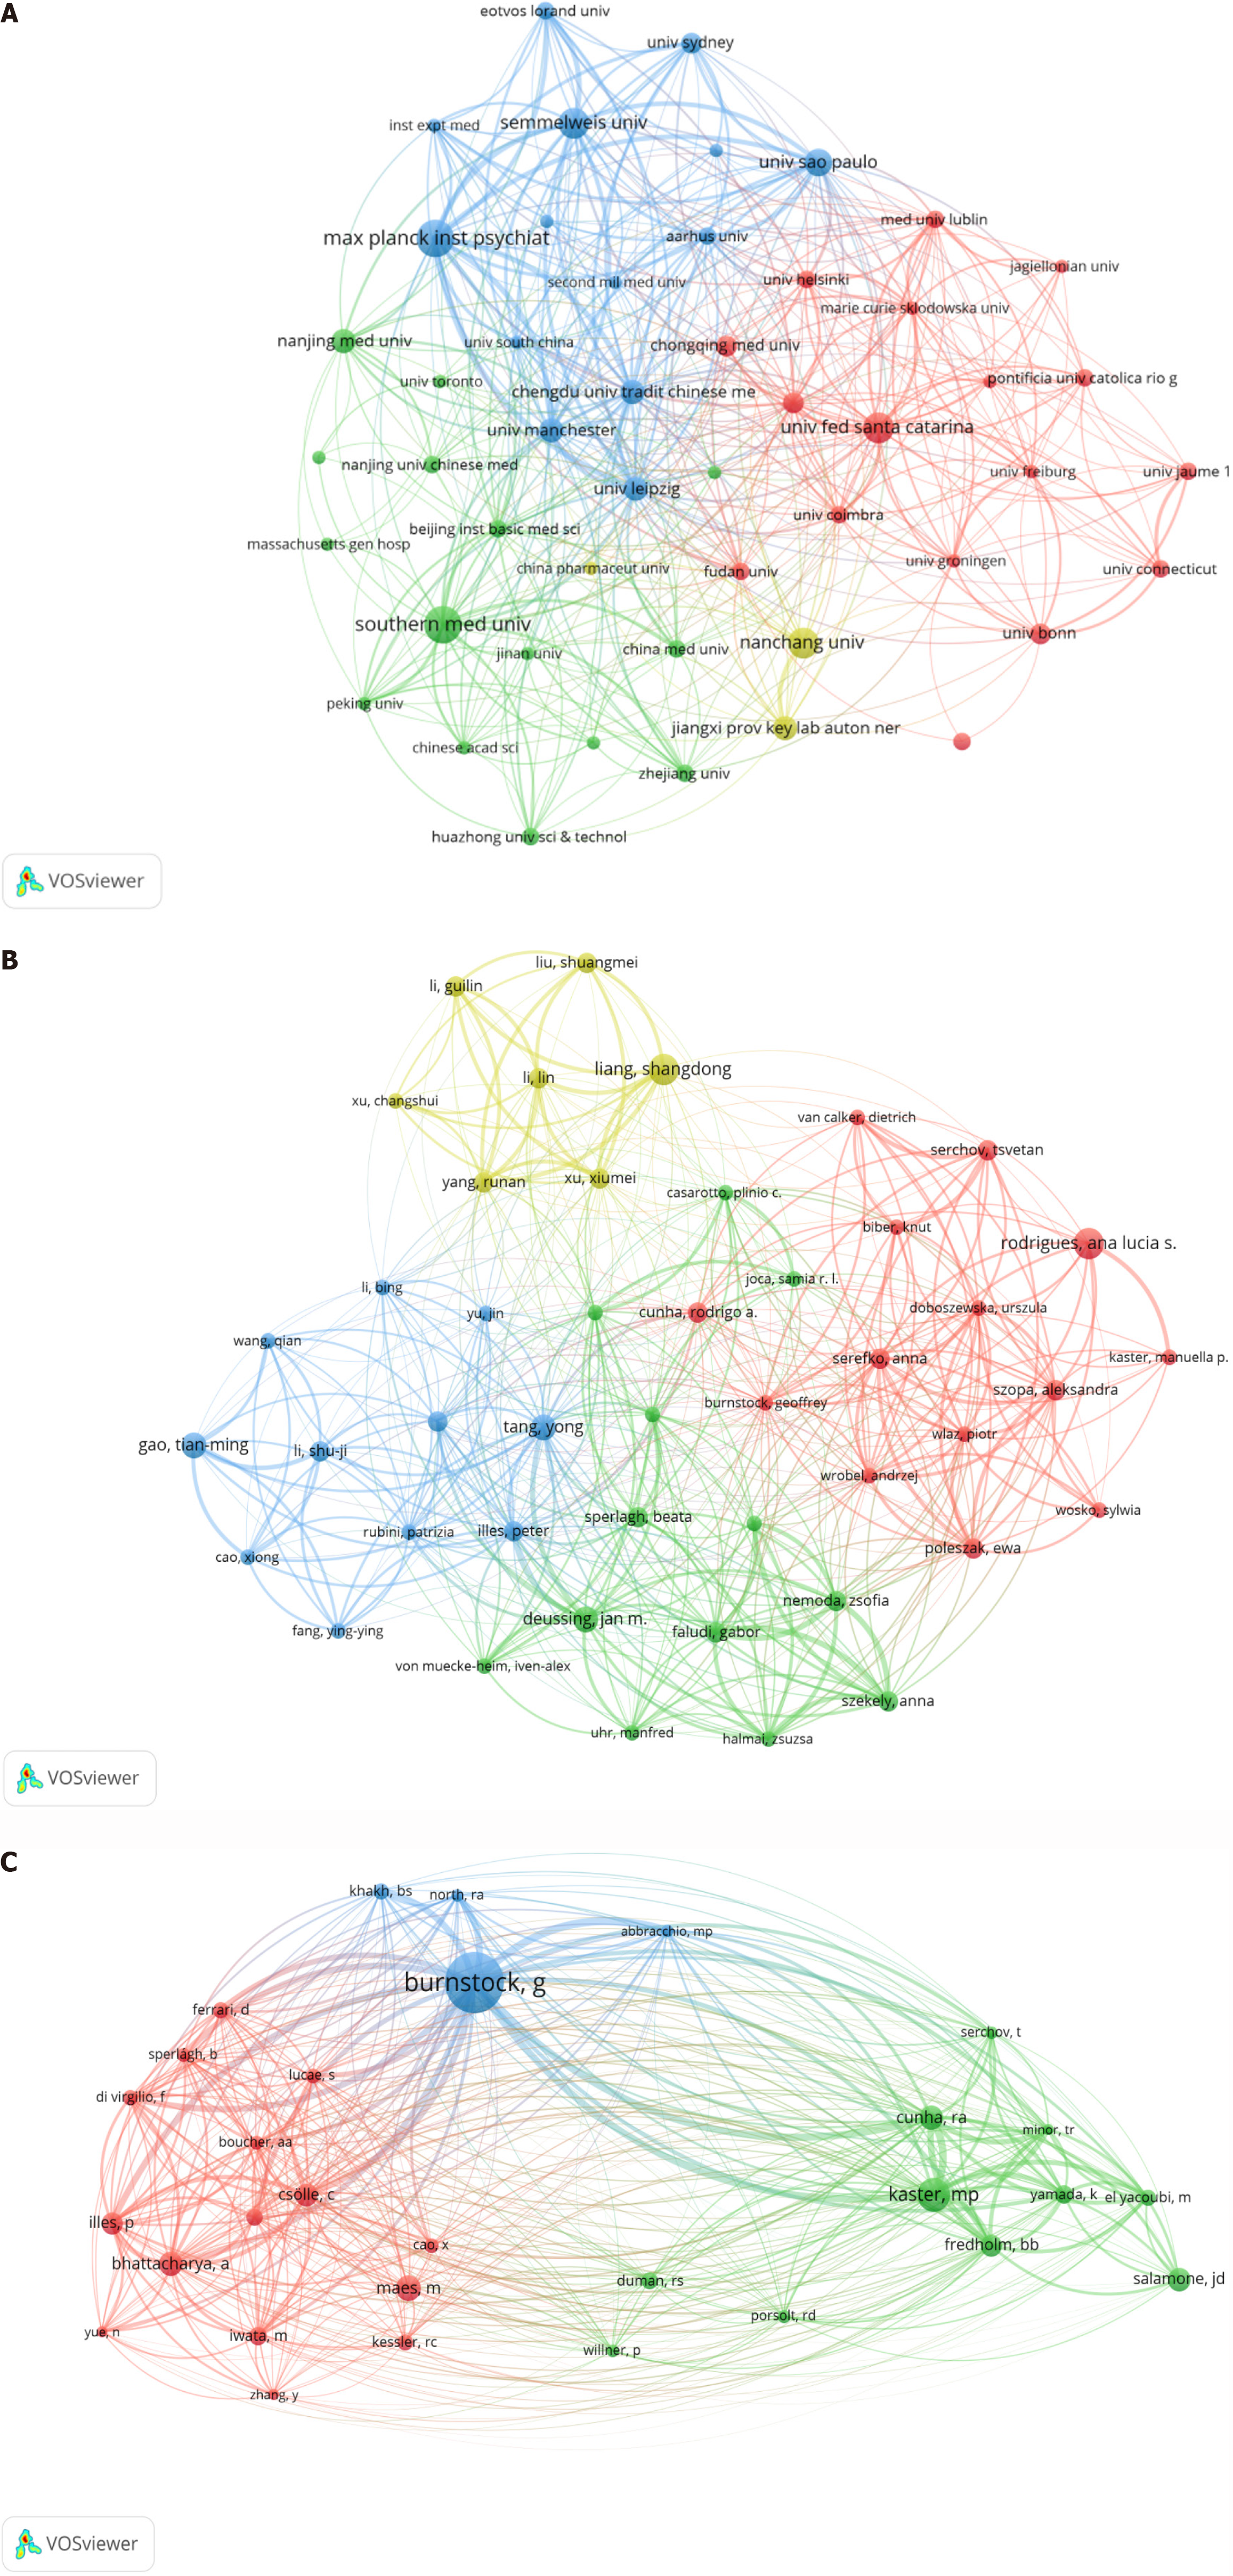
Figure 4 Cooperative network of according to VOSviewer.
A: Top 50 institutions. In this network visualization map, each node is an institution. The size of the node indicates the volume of publications, and the colors of nodes represent different institutions, and the connecting lines represent the cooperative relationship between individual institutions; B: Authors contributed to the field of purinergic receptors in depression; C: Co-cited authors contributed to the field of purinergic receptors in depression. In these two network visualization maps (B and C), each node is an author, and the links between the authors represent the cooperative relationship. The size of each node is proportional to the total number of publications, the colors of nodes represent different authors, and the connecting lines represent the cooperative relationship between individual authors.
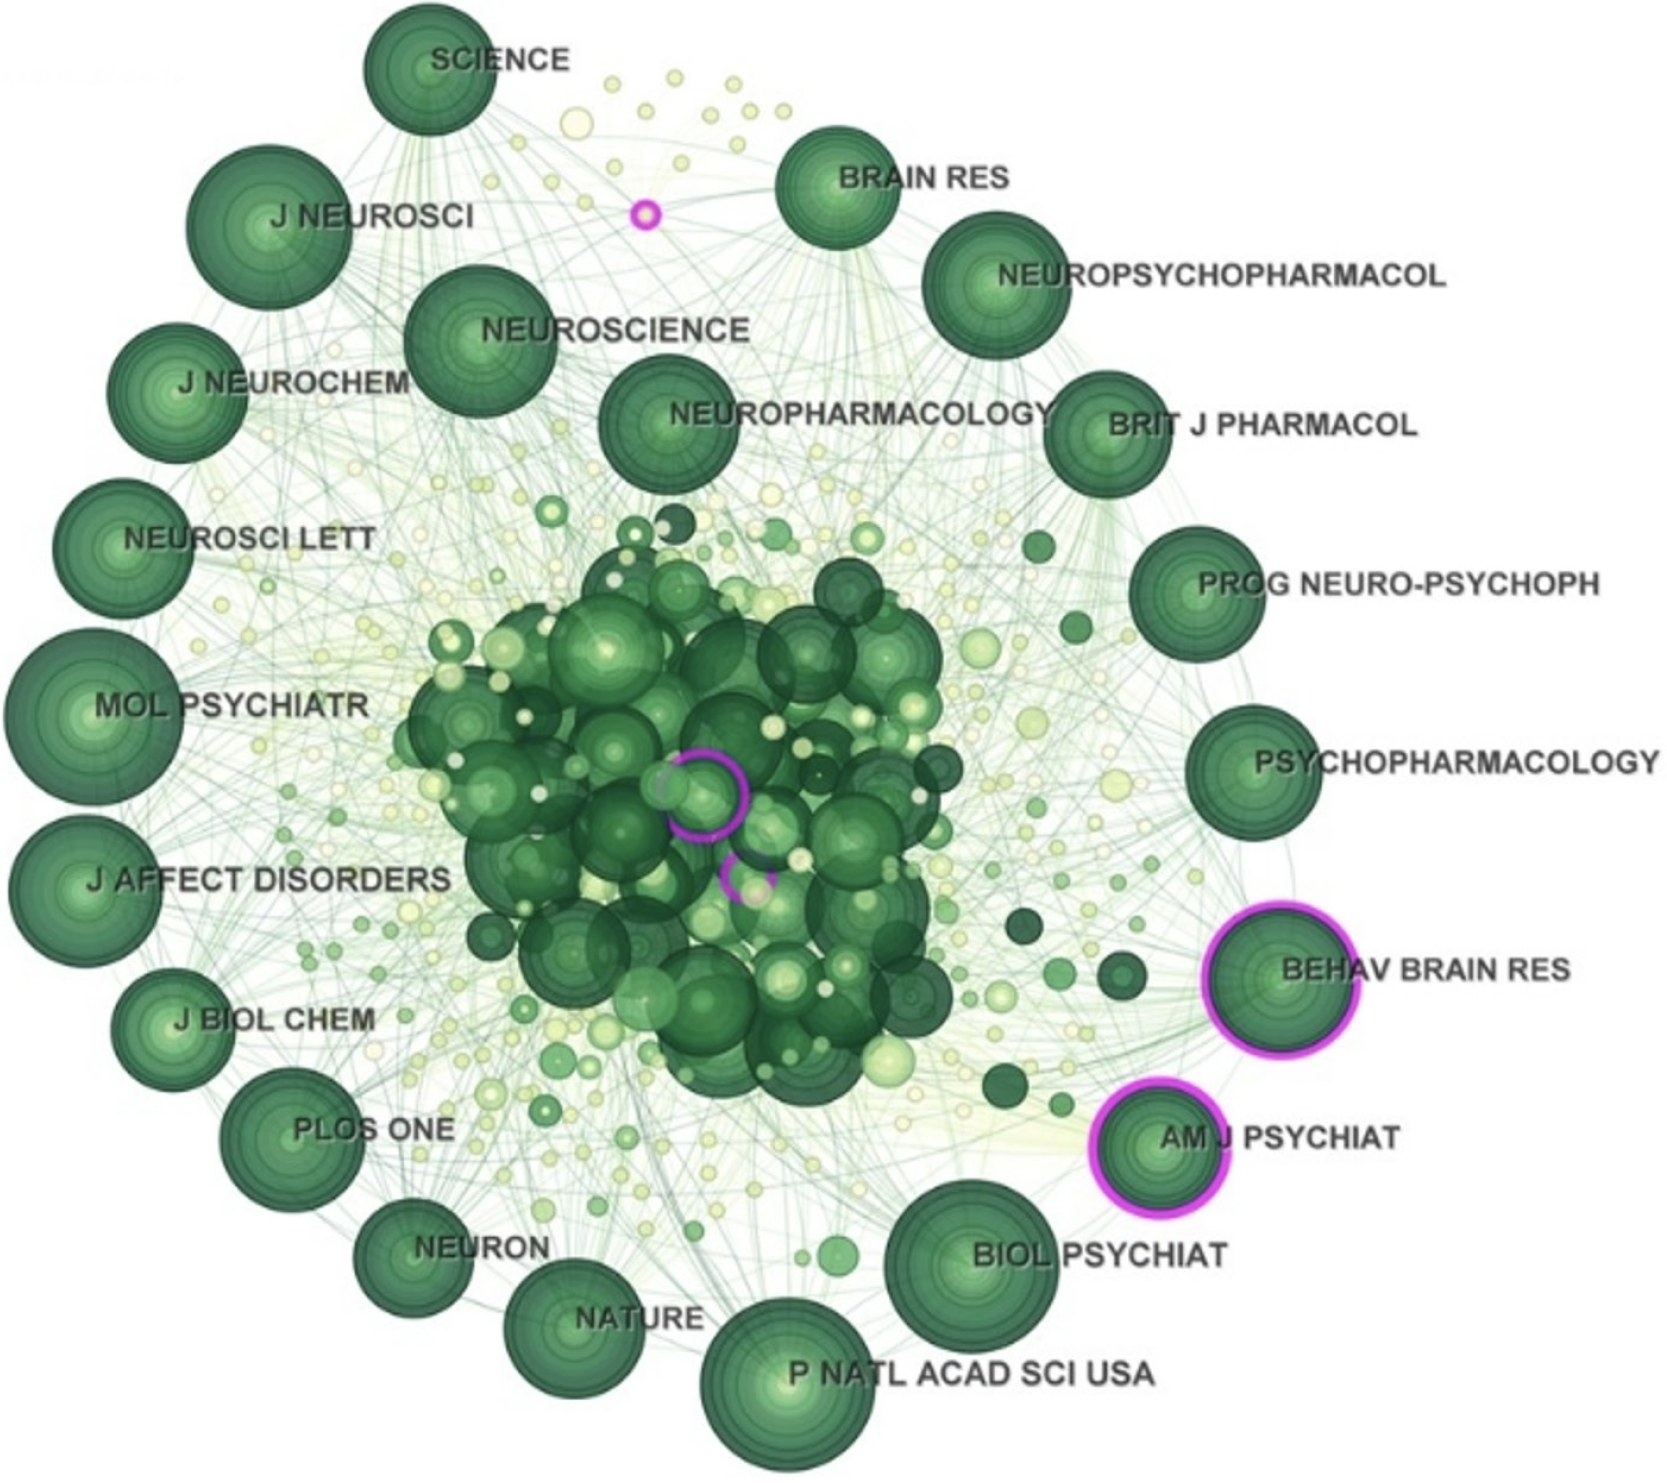
Figure 5 Cited journal maps related to purinergic receptors in depression.
In this network visualization map, each node represents a journal, and the links between the journals represent the cooperative relationship. The size of each node is proportional to the total number of publications, the colors of nodes represent different journals, and the connecting lines represent the cooperative relationship between individual journals.
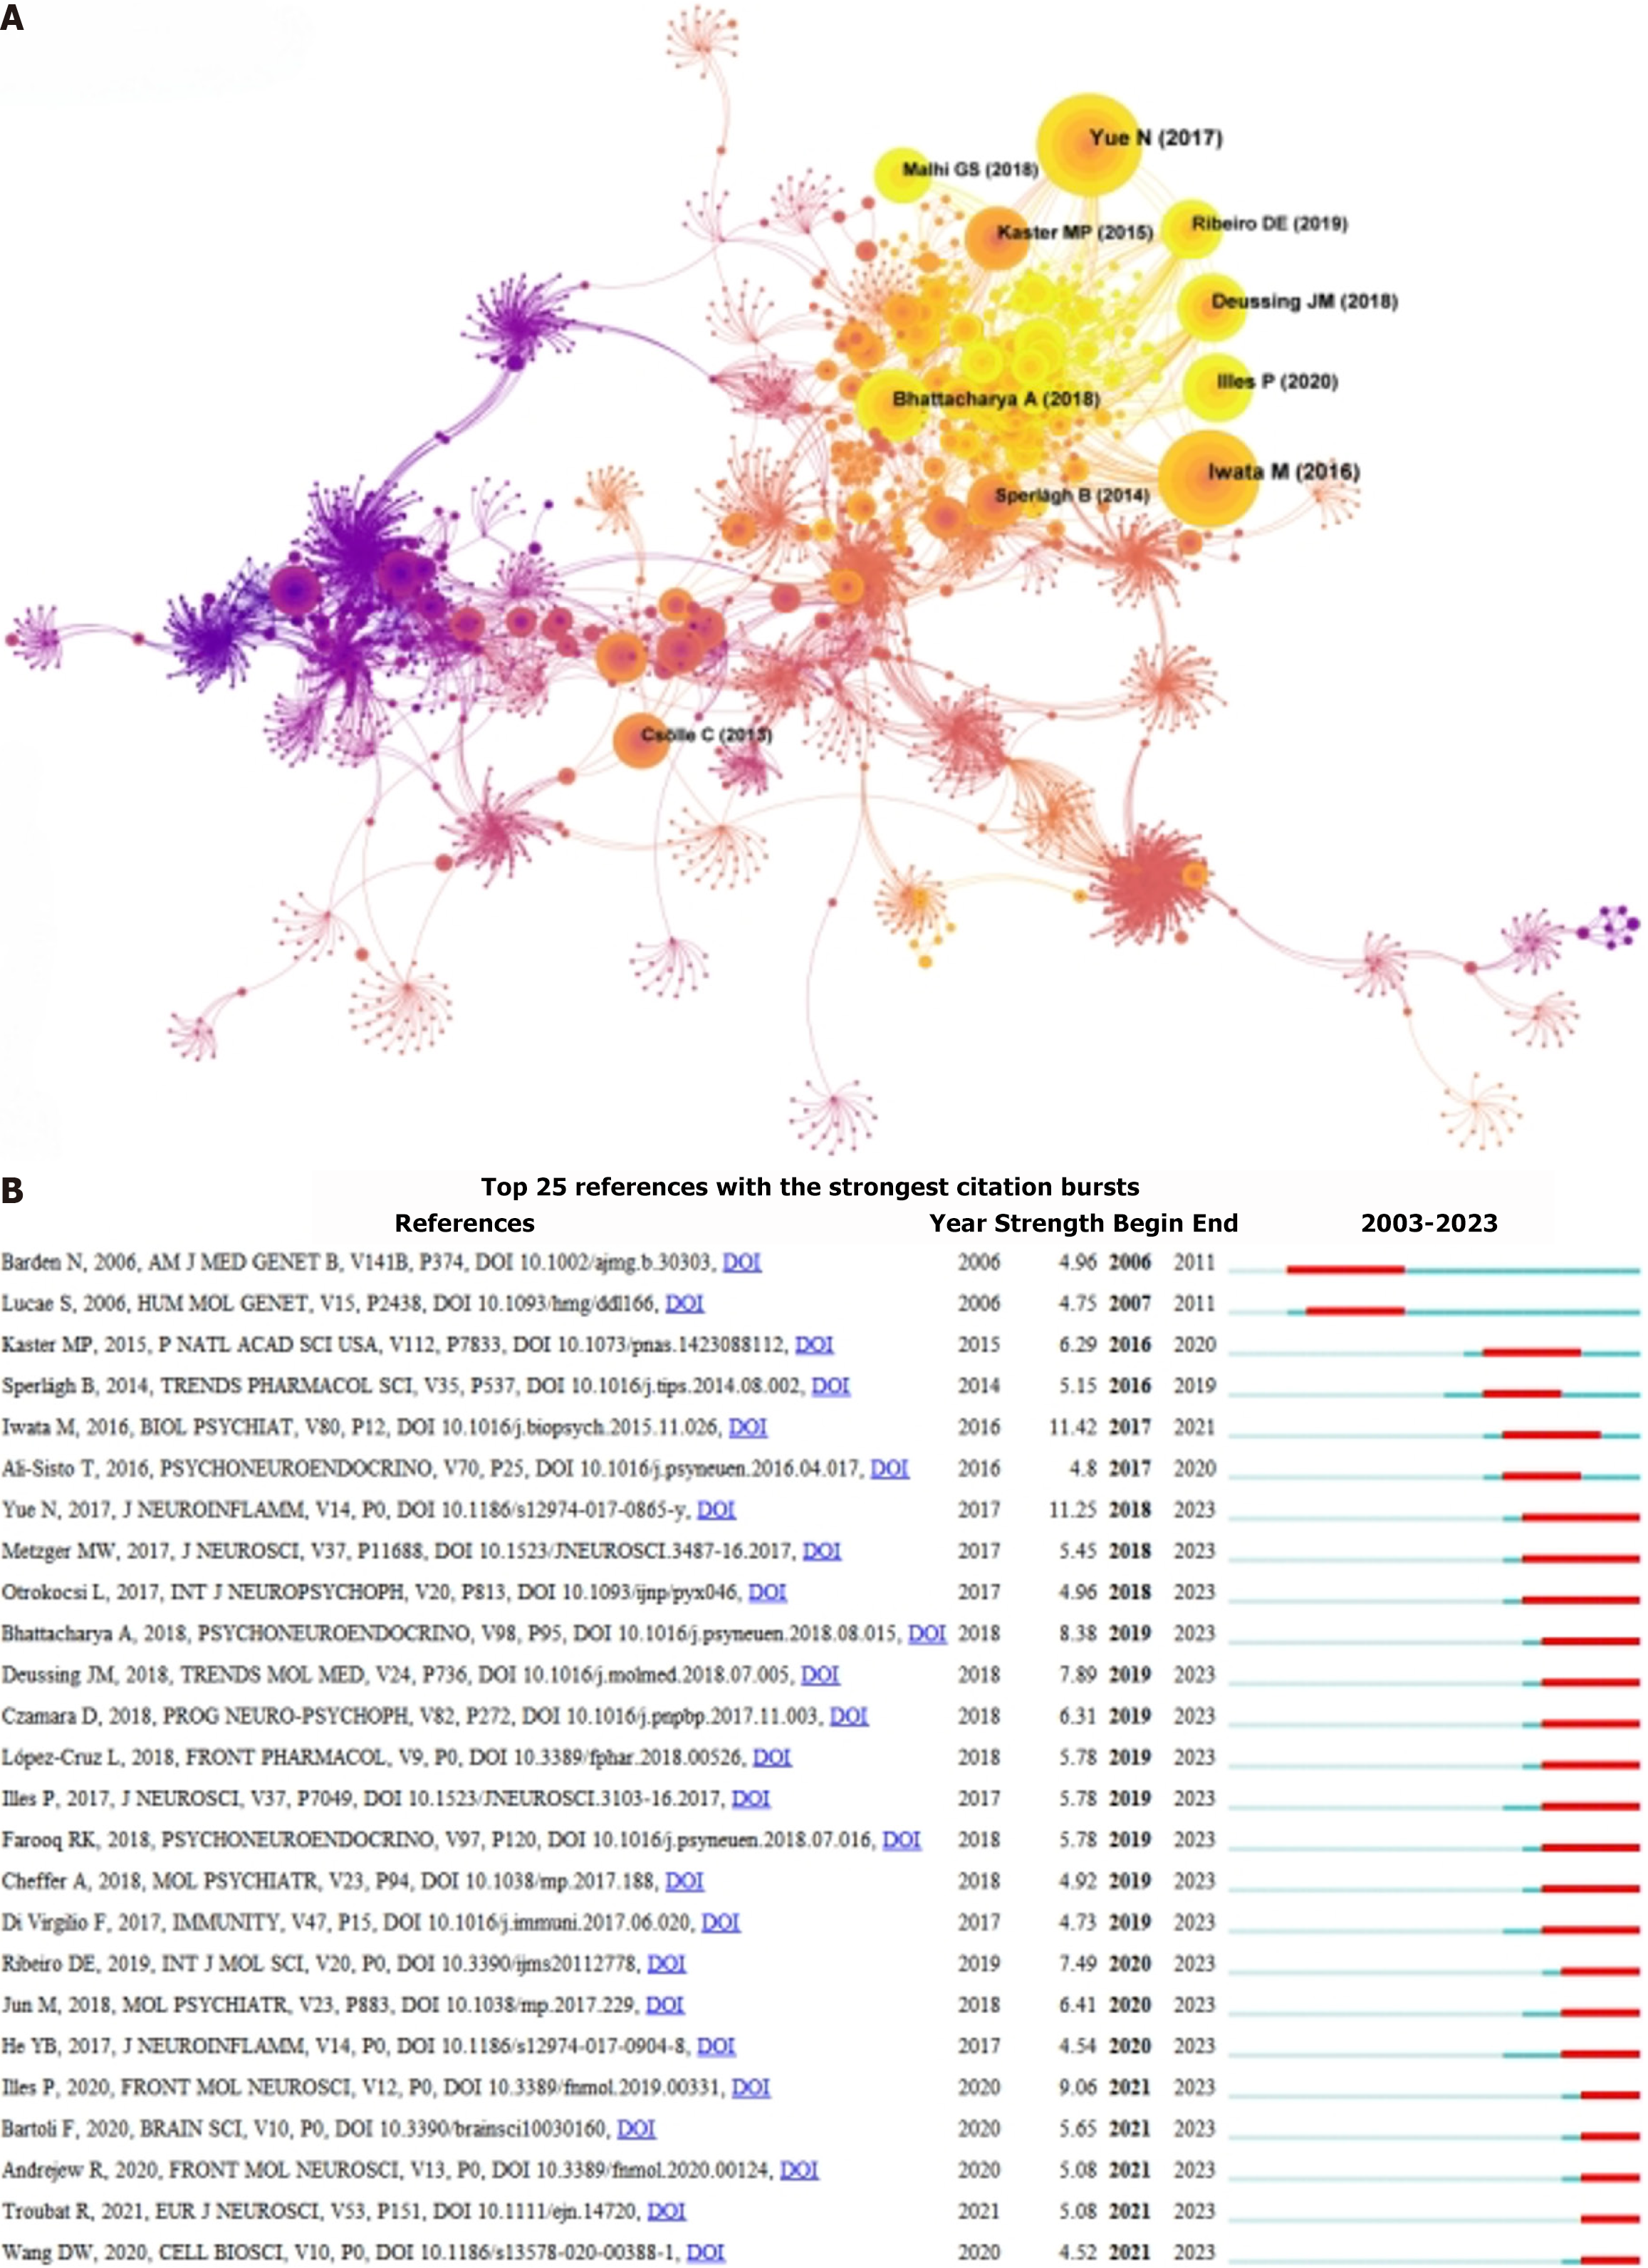
Figure 6 Cited references.
A: Cited references map related to the research of purinergic receptors in depression; B: Top 25 references with the strongest citation bursts. Each node represents a reference, and the links between the references represent the cooperative relationship. The size of each node is proportional to the total number of publications, the colors of nodes represent different references, and the connecting lines represent the cooperative relationship between individual references. The red bars represent the starting and ending, and the duration of citation bursts.
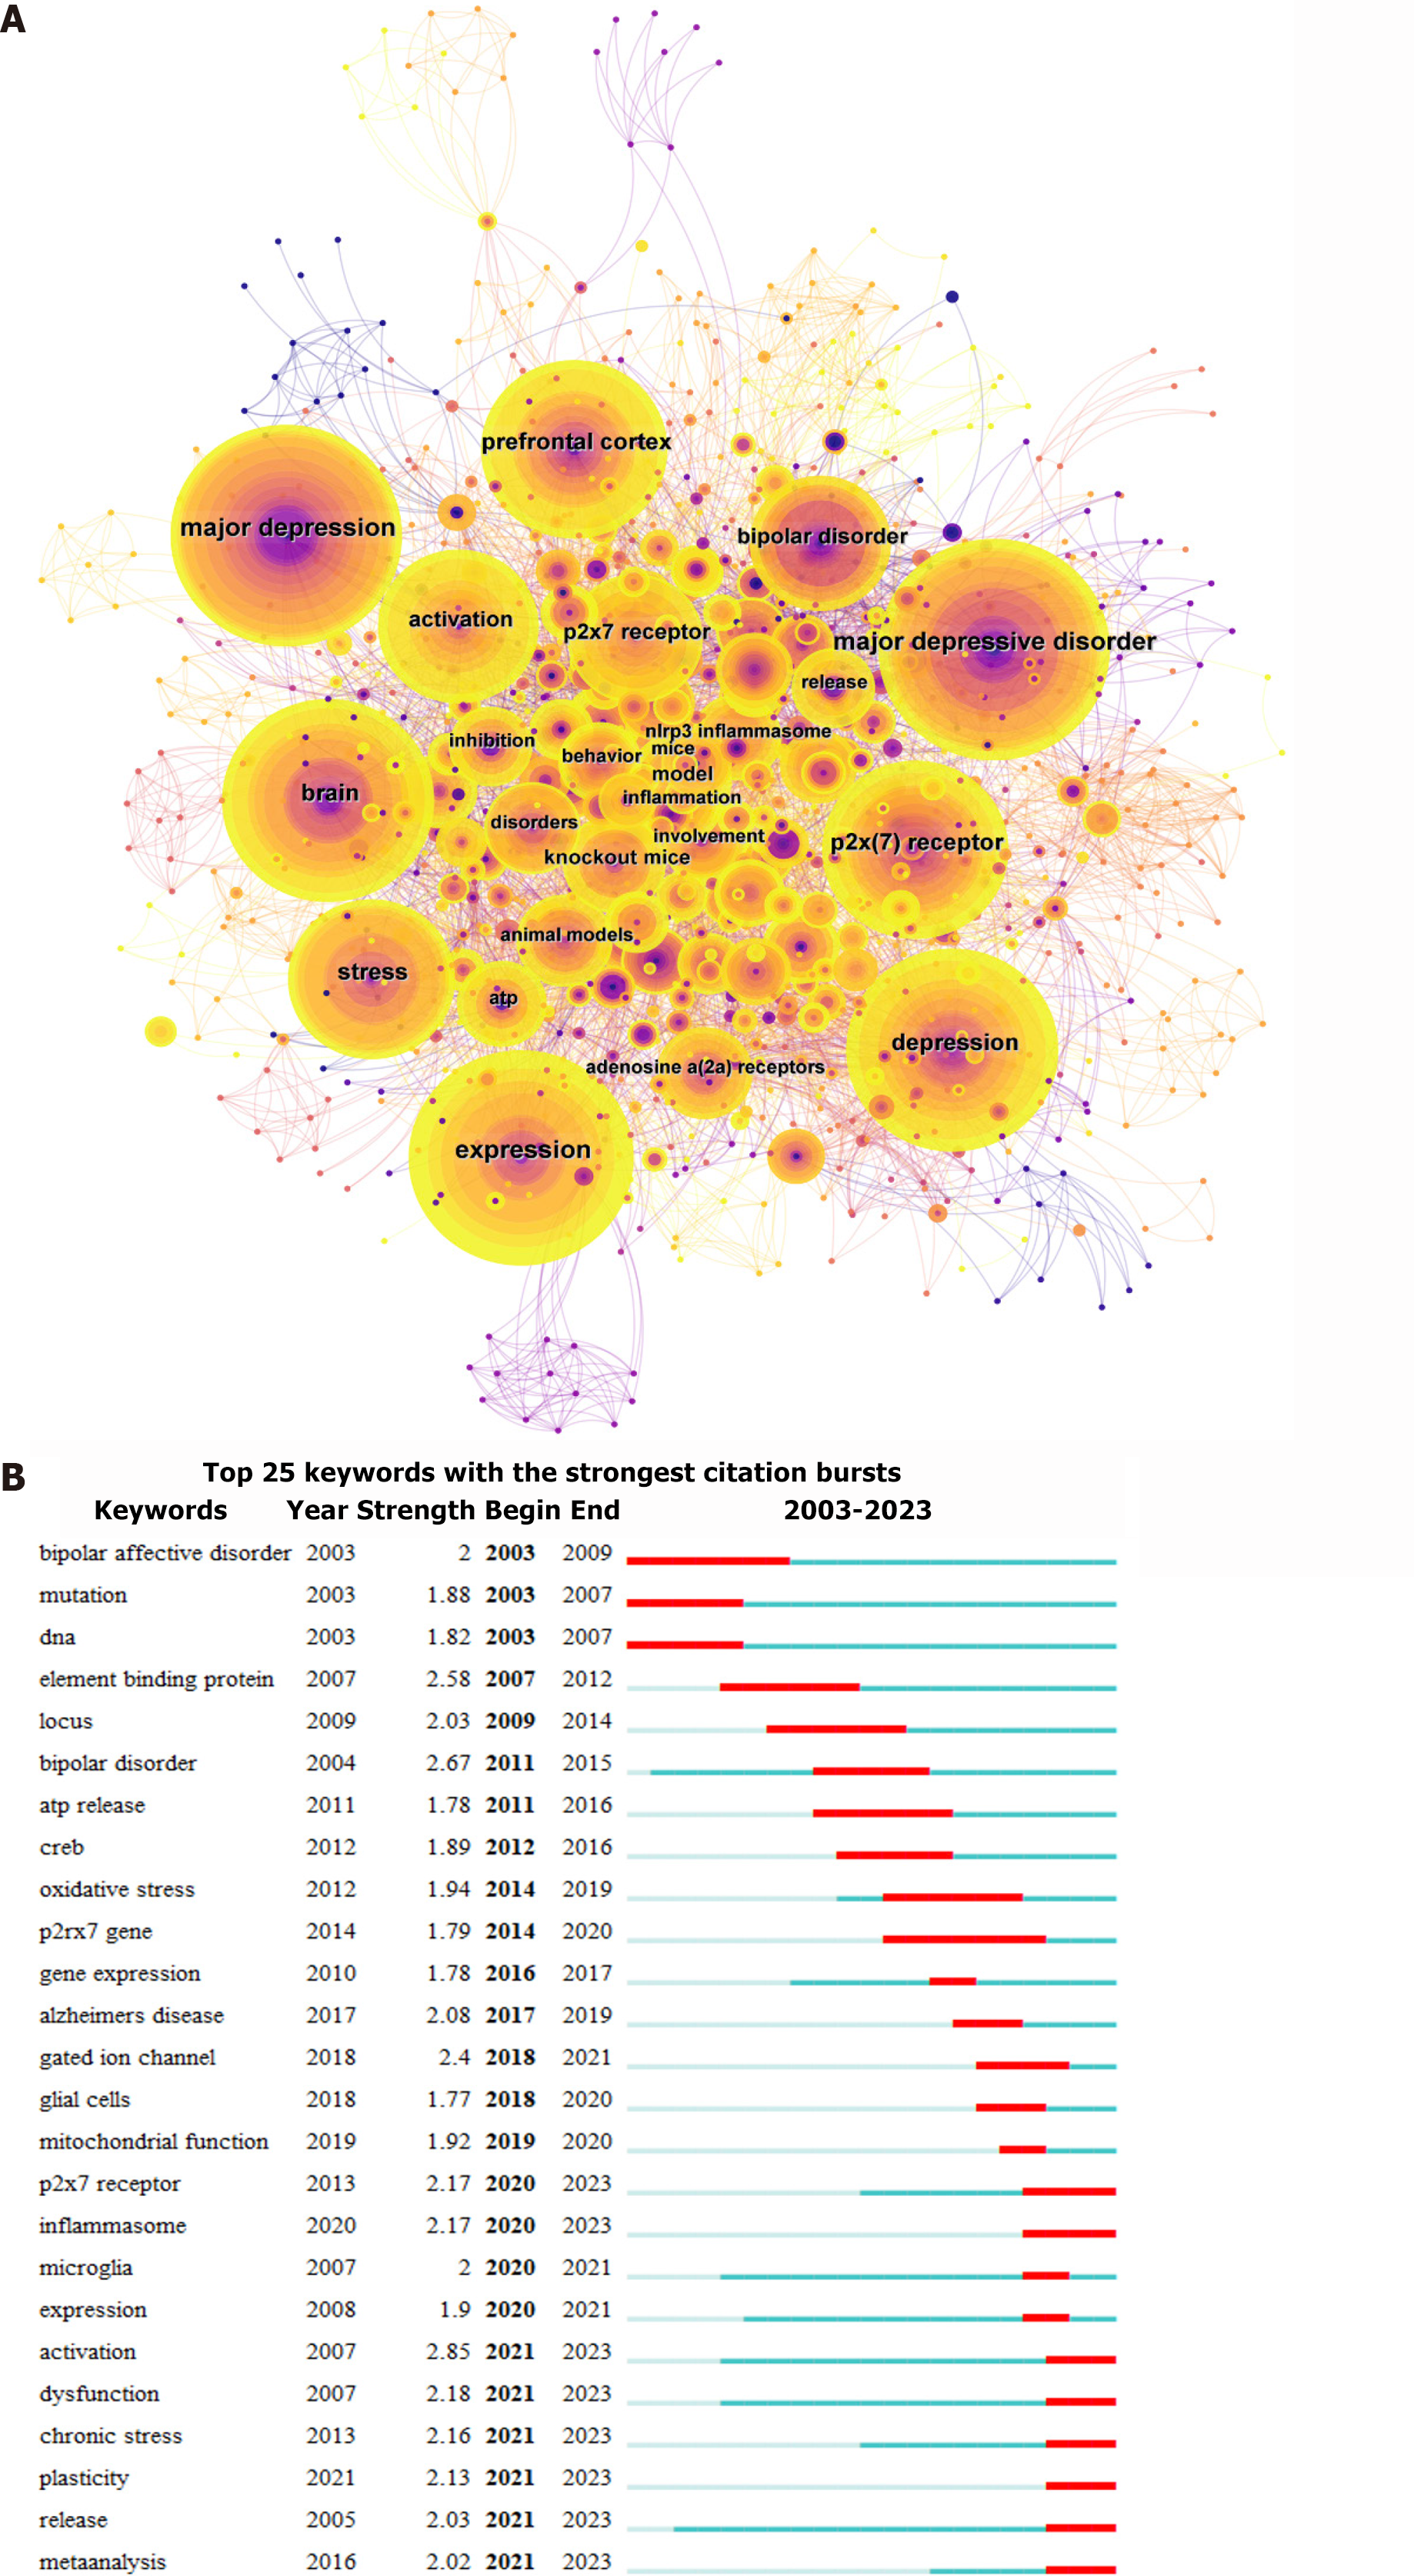
Figure 7 Keywords.
A: Network map of keywords related to the research of purinergic receptors in depression. Each node represents a keyword, and the links between the keywords represent the cooperative relationship. The size of each node is proportional to the total number of publications, and purple nodes represent references with high centrality; B: Top 25 keywords with the strongest citation bursts. Red horizontal lines indicate the importance and attention of the references in the field. A longer red line length indicates greater popularity for reference.
- Citation: Huang B, Chen WN, Peng CM, Shen XL, Xue J, Yan CC, Zhong FM. Global trends of purinergic receptors and depression: A bibliometric analysis from 2003 to 2023. World J Psychiatry 2025; 15(2): 102344
- URL: https://www.wjgnet.com/2220-3206/full/v15/i2/102344.htm
- DOI: https://dx.doi.org/10.5498/wjp.v15.i2.102344


