Copyright
©The Author(s) 2025.
World J Psychiatry. Feb 19, 2025; 15(2): 100214
Published online Feb 19, 2025. doi: 10.5498/wjp.v15.i2.100214
Published online Feb 19, 2025. doi: 10.5498/wjp.v15.i2.100214
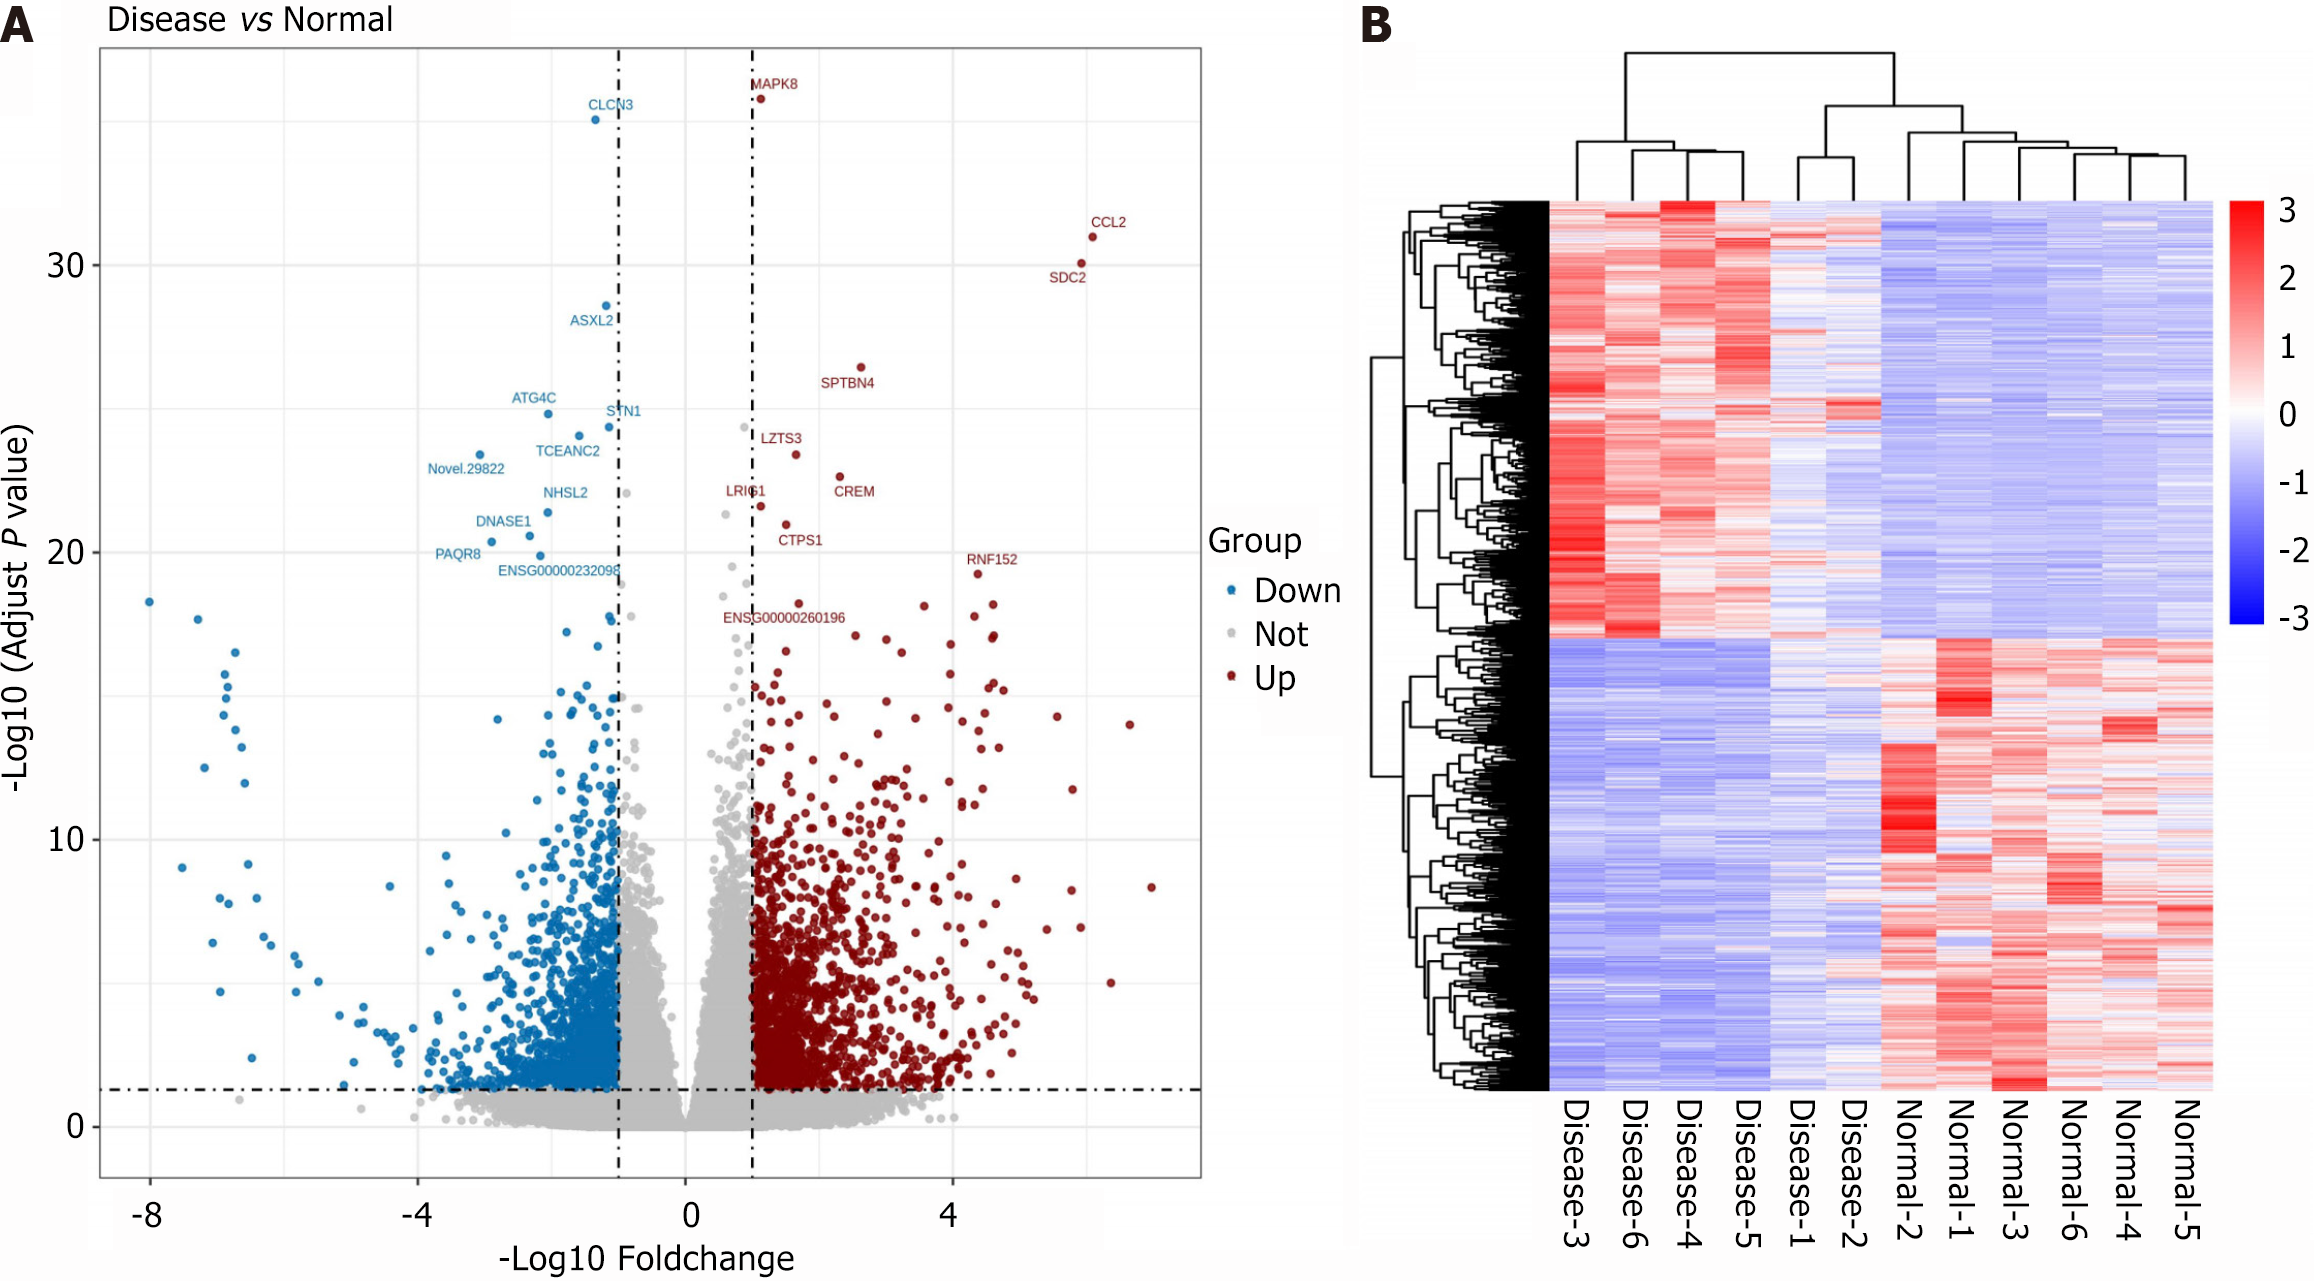
Figure 1 Analysis of transcriptomics sequencing results.
A: Volcano plot illustrating the distribution of differentially expressed genes between the schizophrenia (SZ) and Healthy controls (HC) groups; B: Cluster heatmap of differentially expressed genes in the SZ and HC groups.
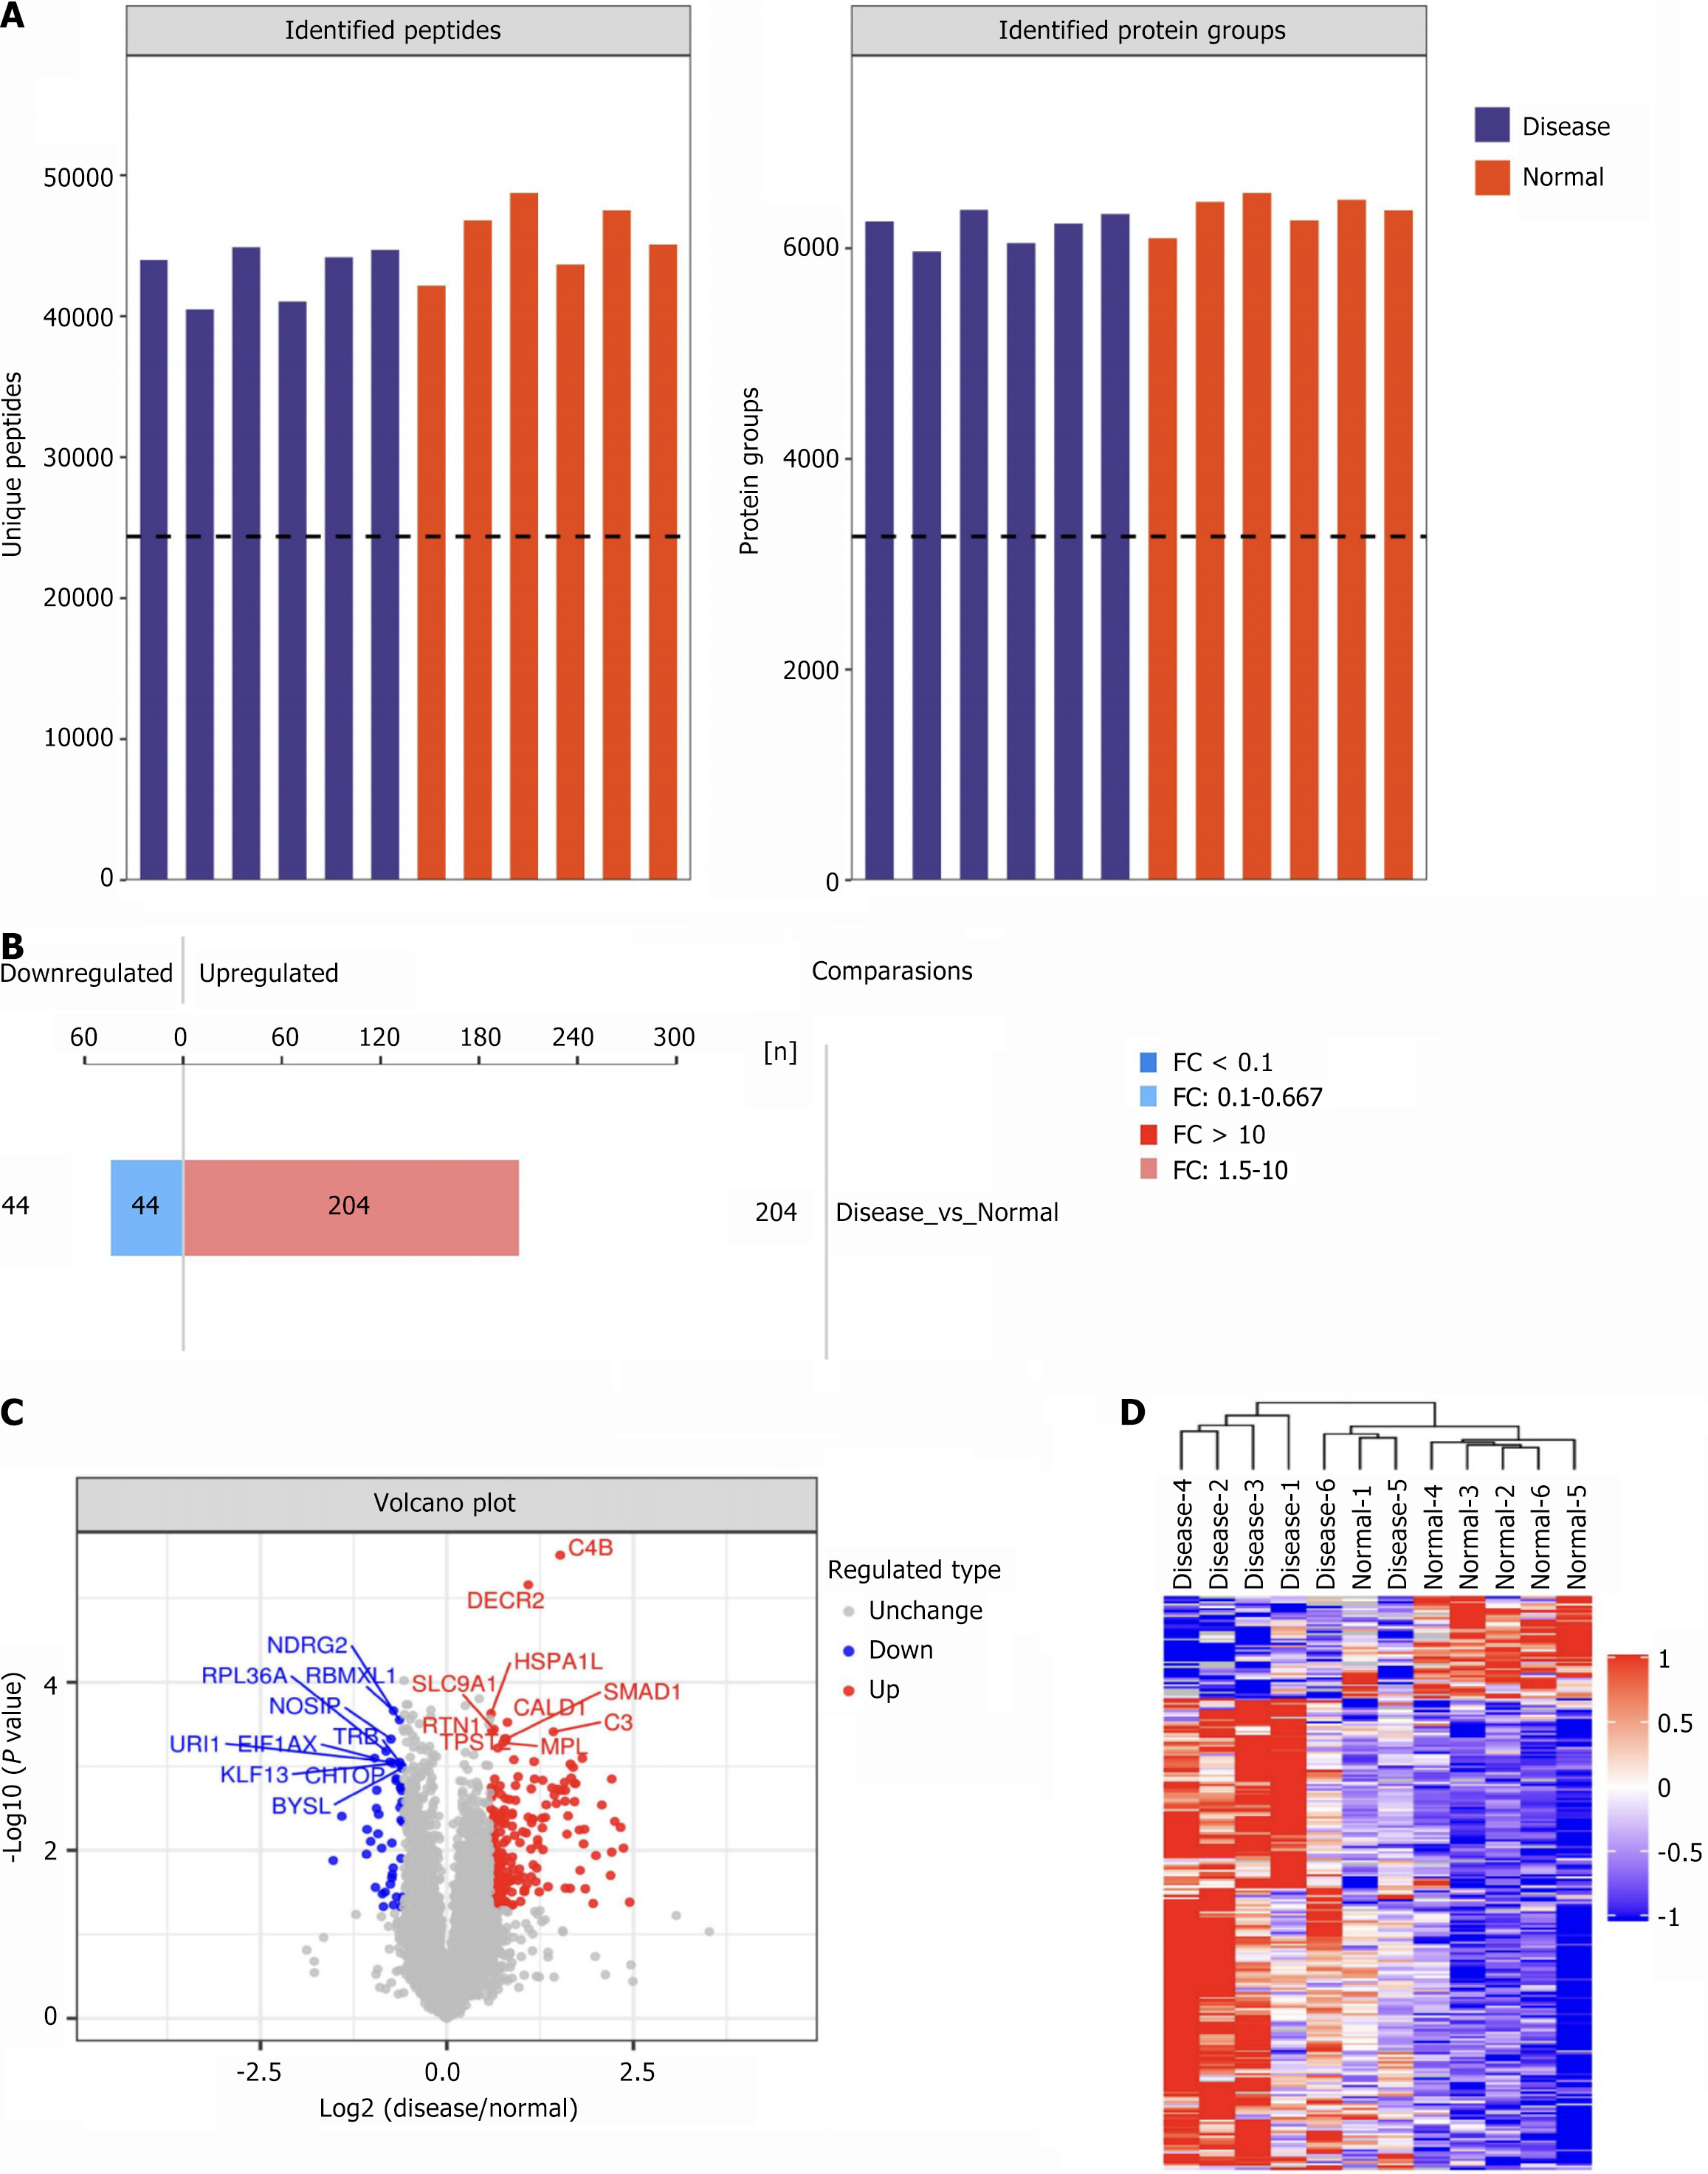
Figure 2 Analysis of quantitative results of data-independent acquisition proteomics.
A: Histogram summarizing data-independent acquisition identification statistics for the schizophrenia (SZ) and healthy controls (HC) groups; B: Histogram of quantitative differences in protein expression between the SZ and HC groups; C: Volcano plot depicting quantitative protein differences between the SZ and HC groups; D: Cluster heatmap of differentially expressed proteins between the SZ and HC groups.
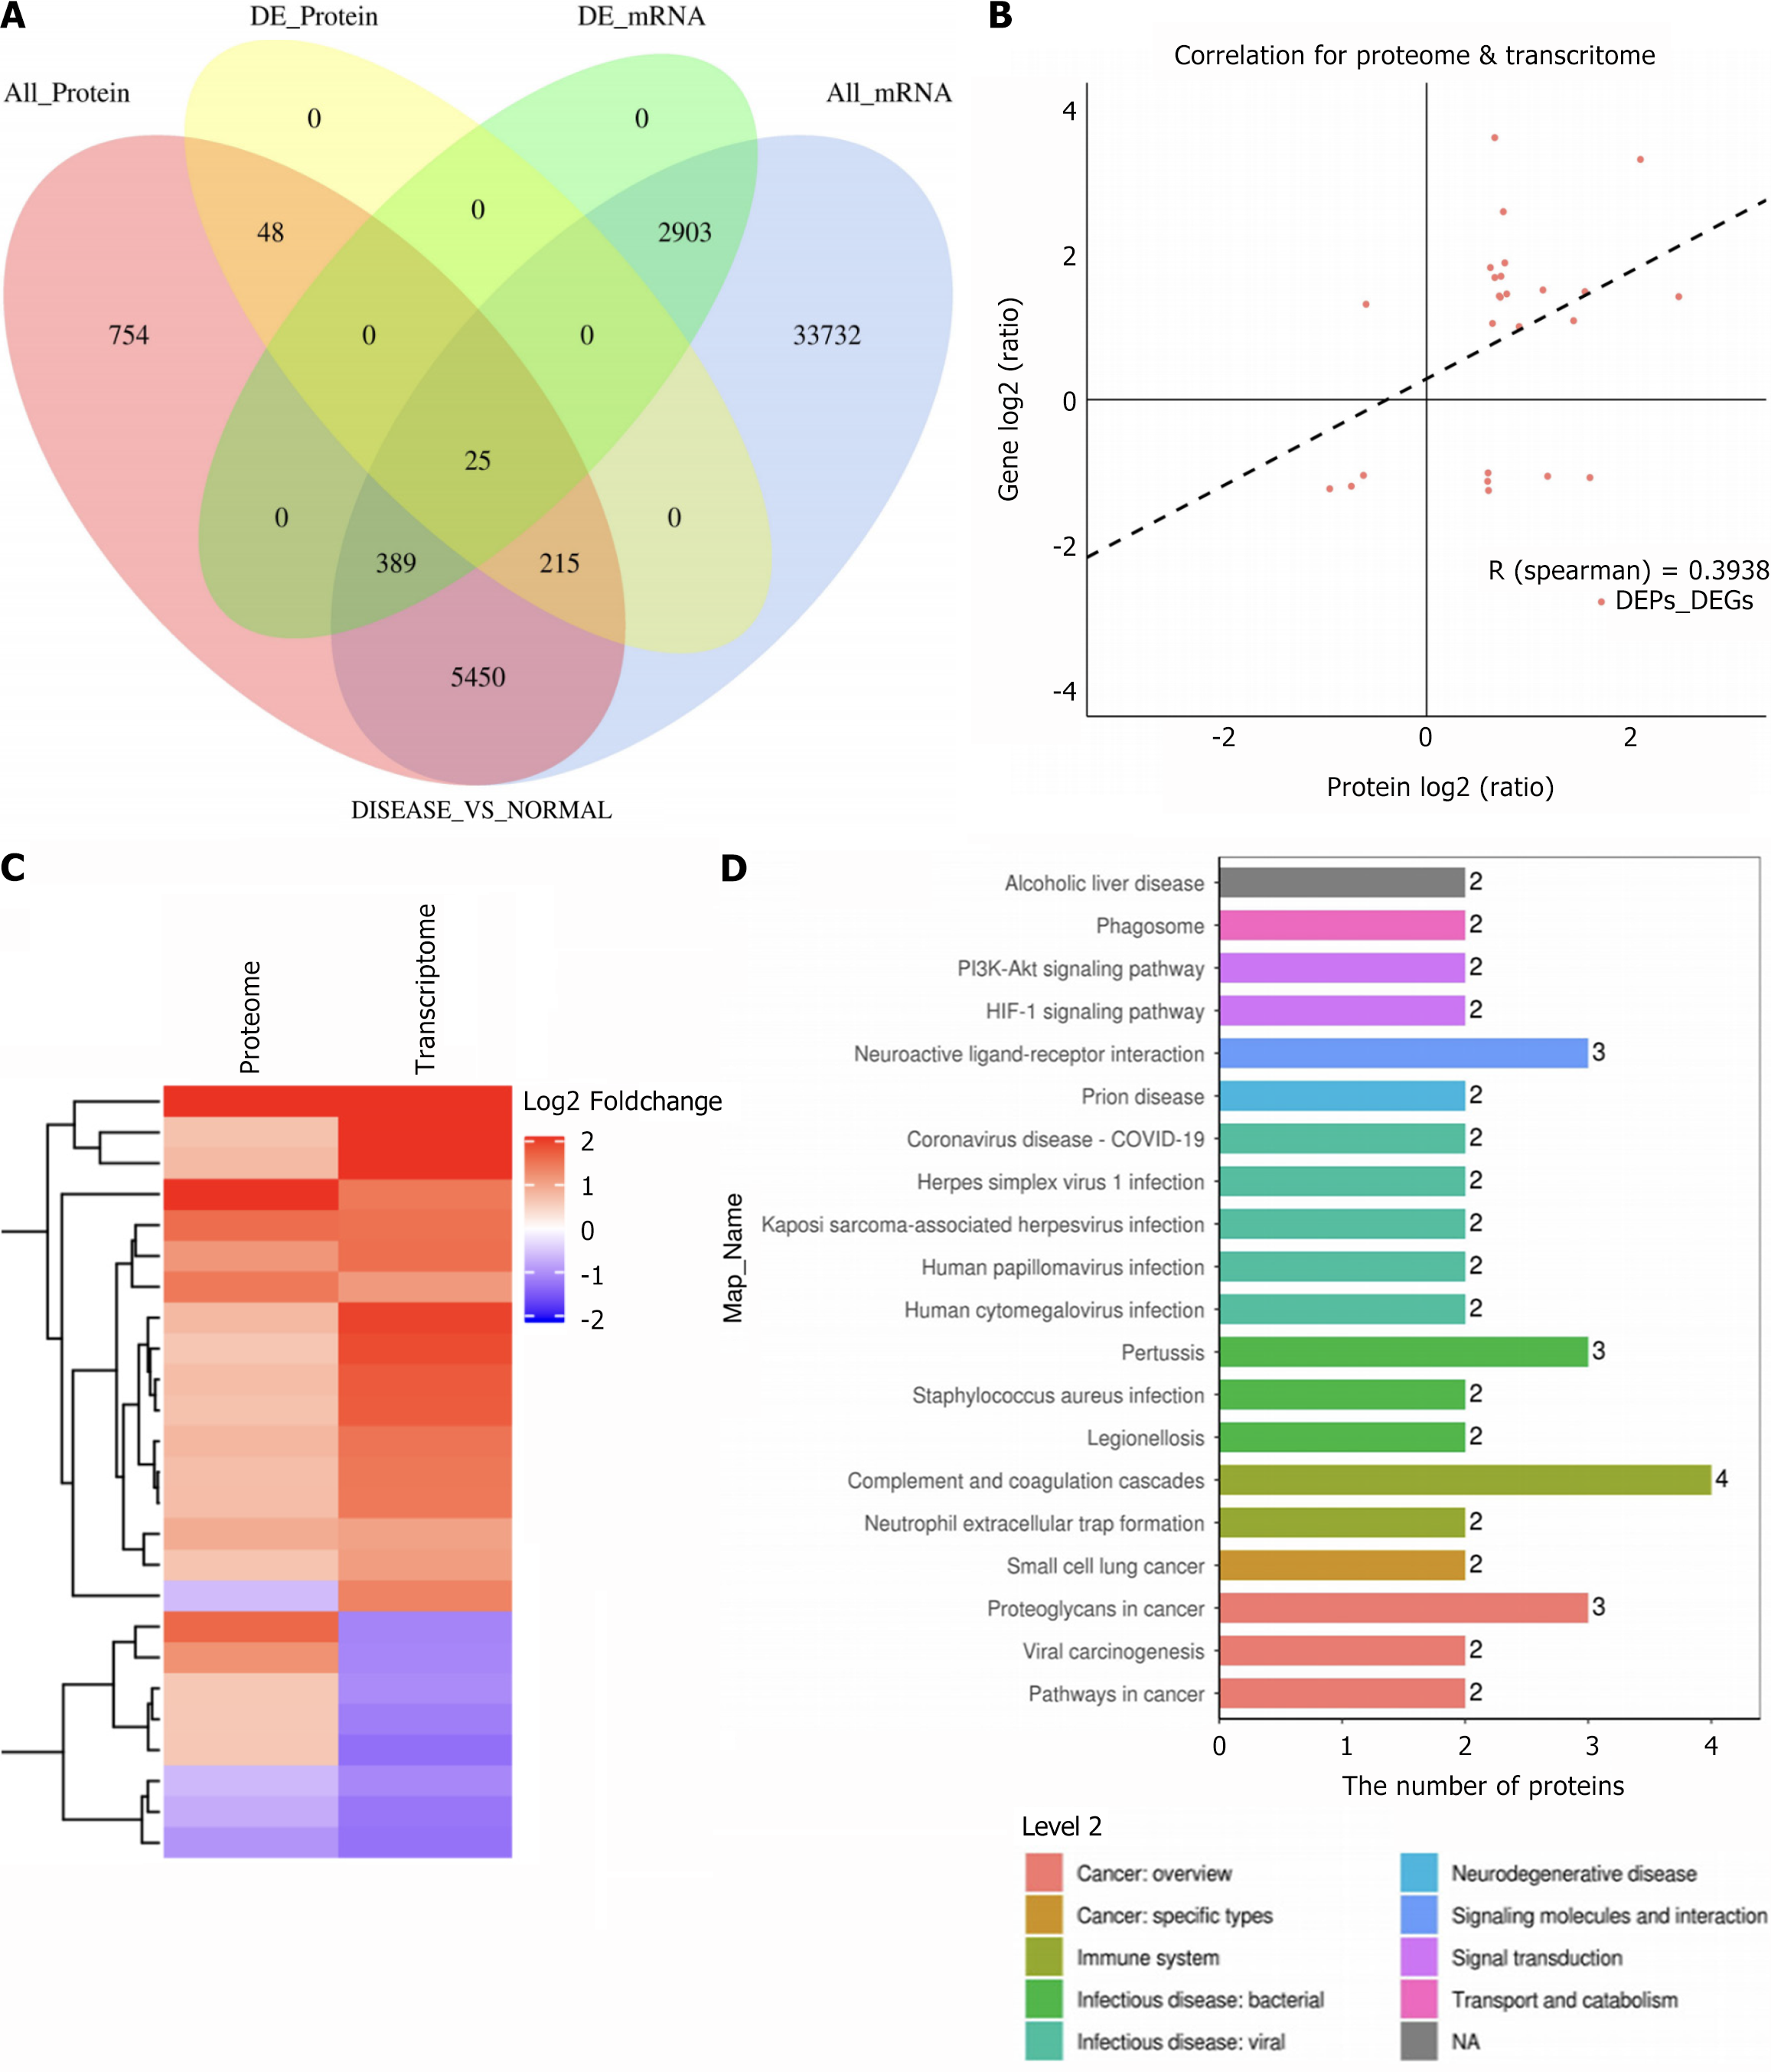
Figure 3 Integrated transcriptomics and proteomics analysis.
A: Venn diagram showing overlapping transcriptomic and proteomic associations at the quantitative and differential expression levels (DE_Protein numbers represent genes corresponding to proteins); B: Correlation analysis (Spearman) between significantly differentially expressed genes and proteins; C: Cluster heatmap of transcriptomic and proteomic expression patterns for associated molecules; D: KEGG enrichment analysis of differentially expressed genes.
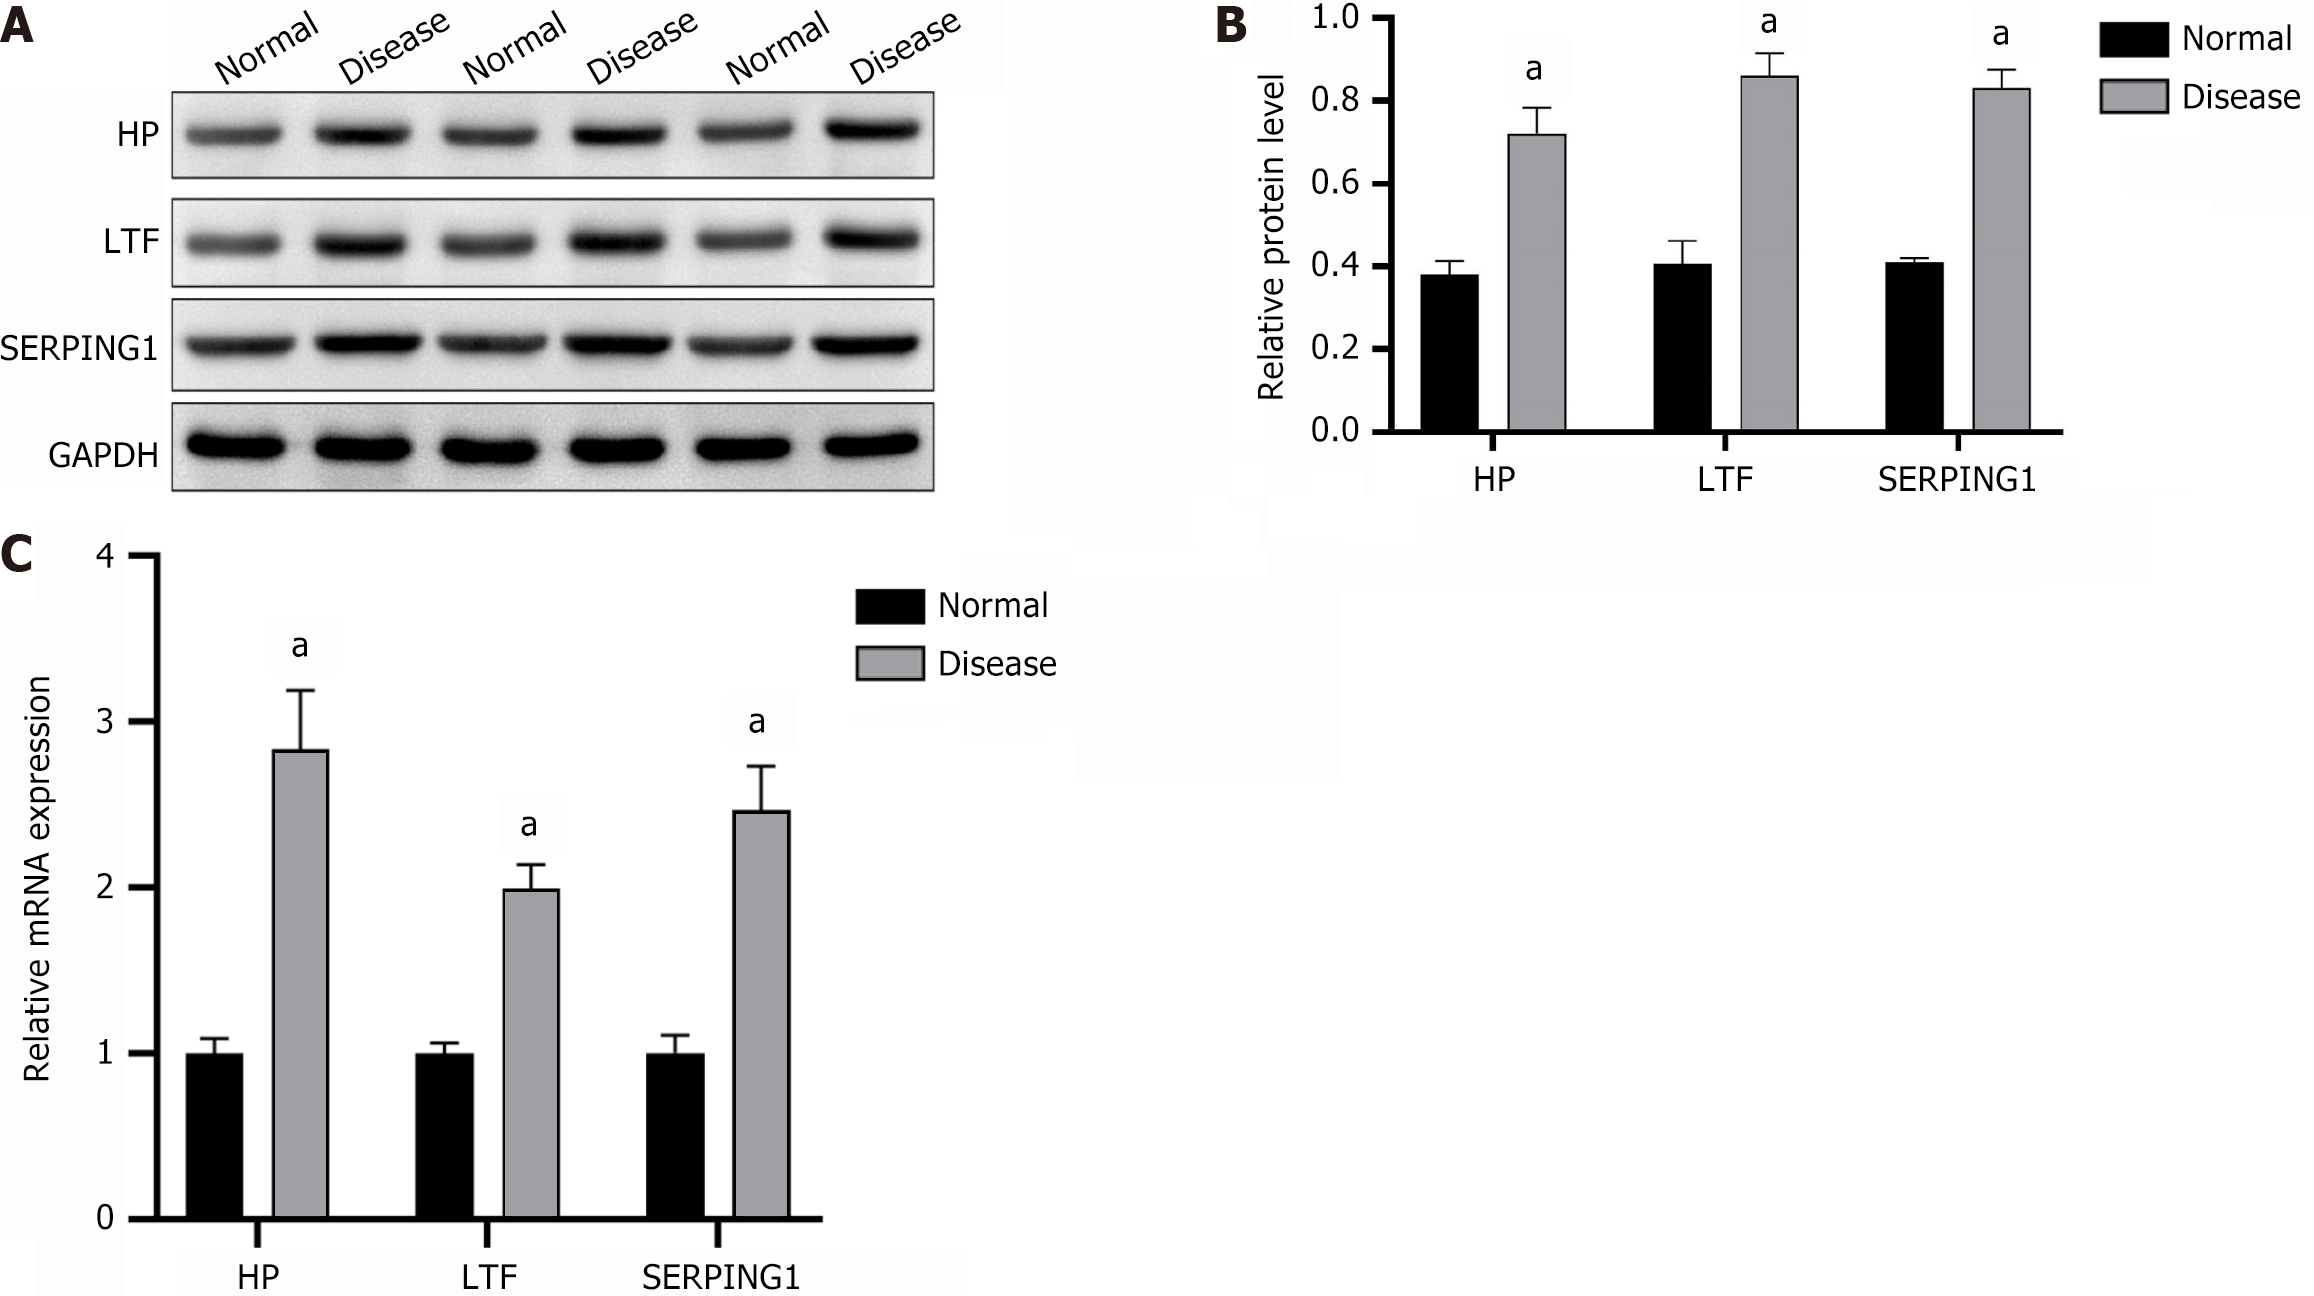
Figure 4 Expression of haptoglobin, lactotransferrin, and SERPING1 (n = 3).
A and B: Detected by western blot, Immunoblotting image (A) and statistical bar chart of relative protein expression (B); C: Analyzed by real-time fluorescence quantitative PCR. aP < 0.001; HP: Haptoglobin; LTF: Lactotransferrin.
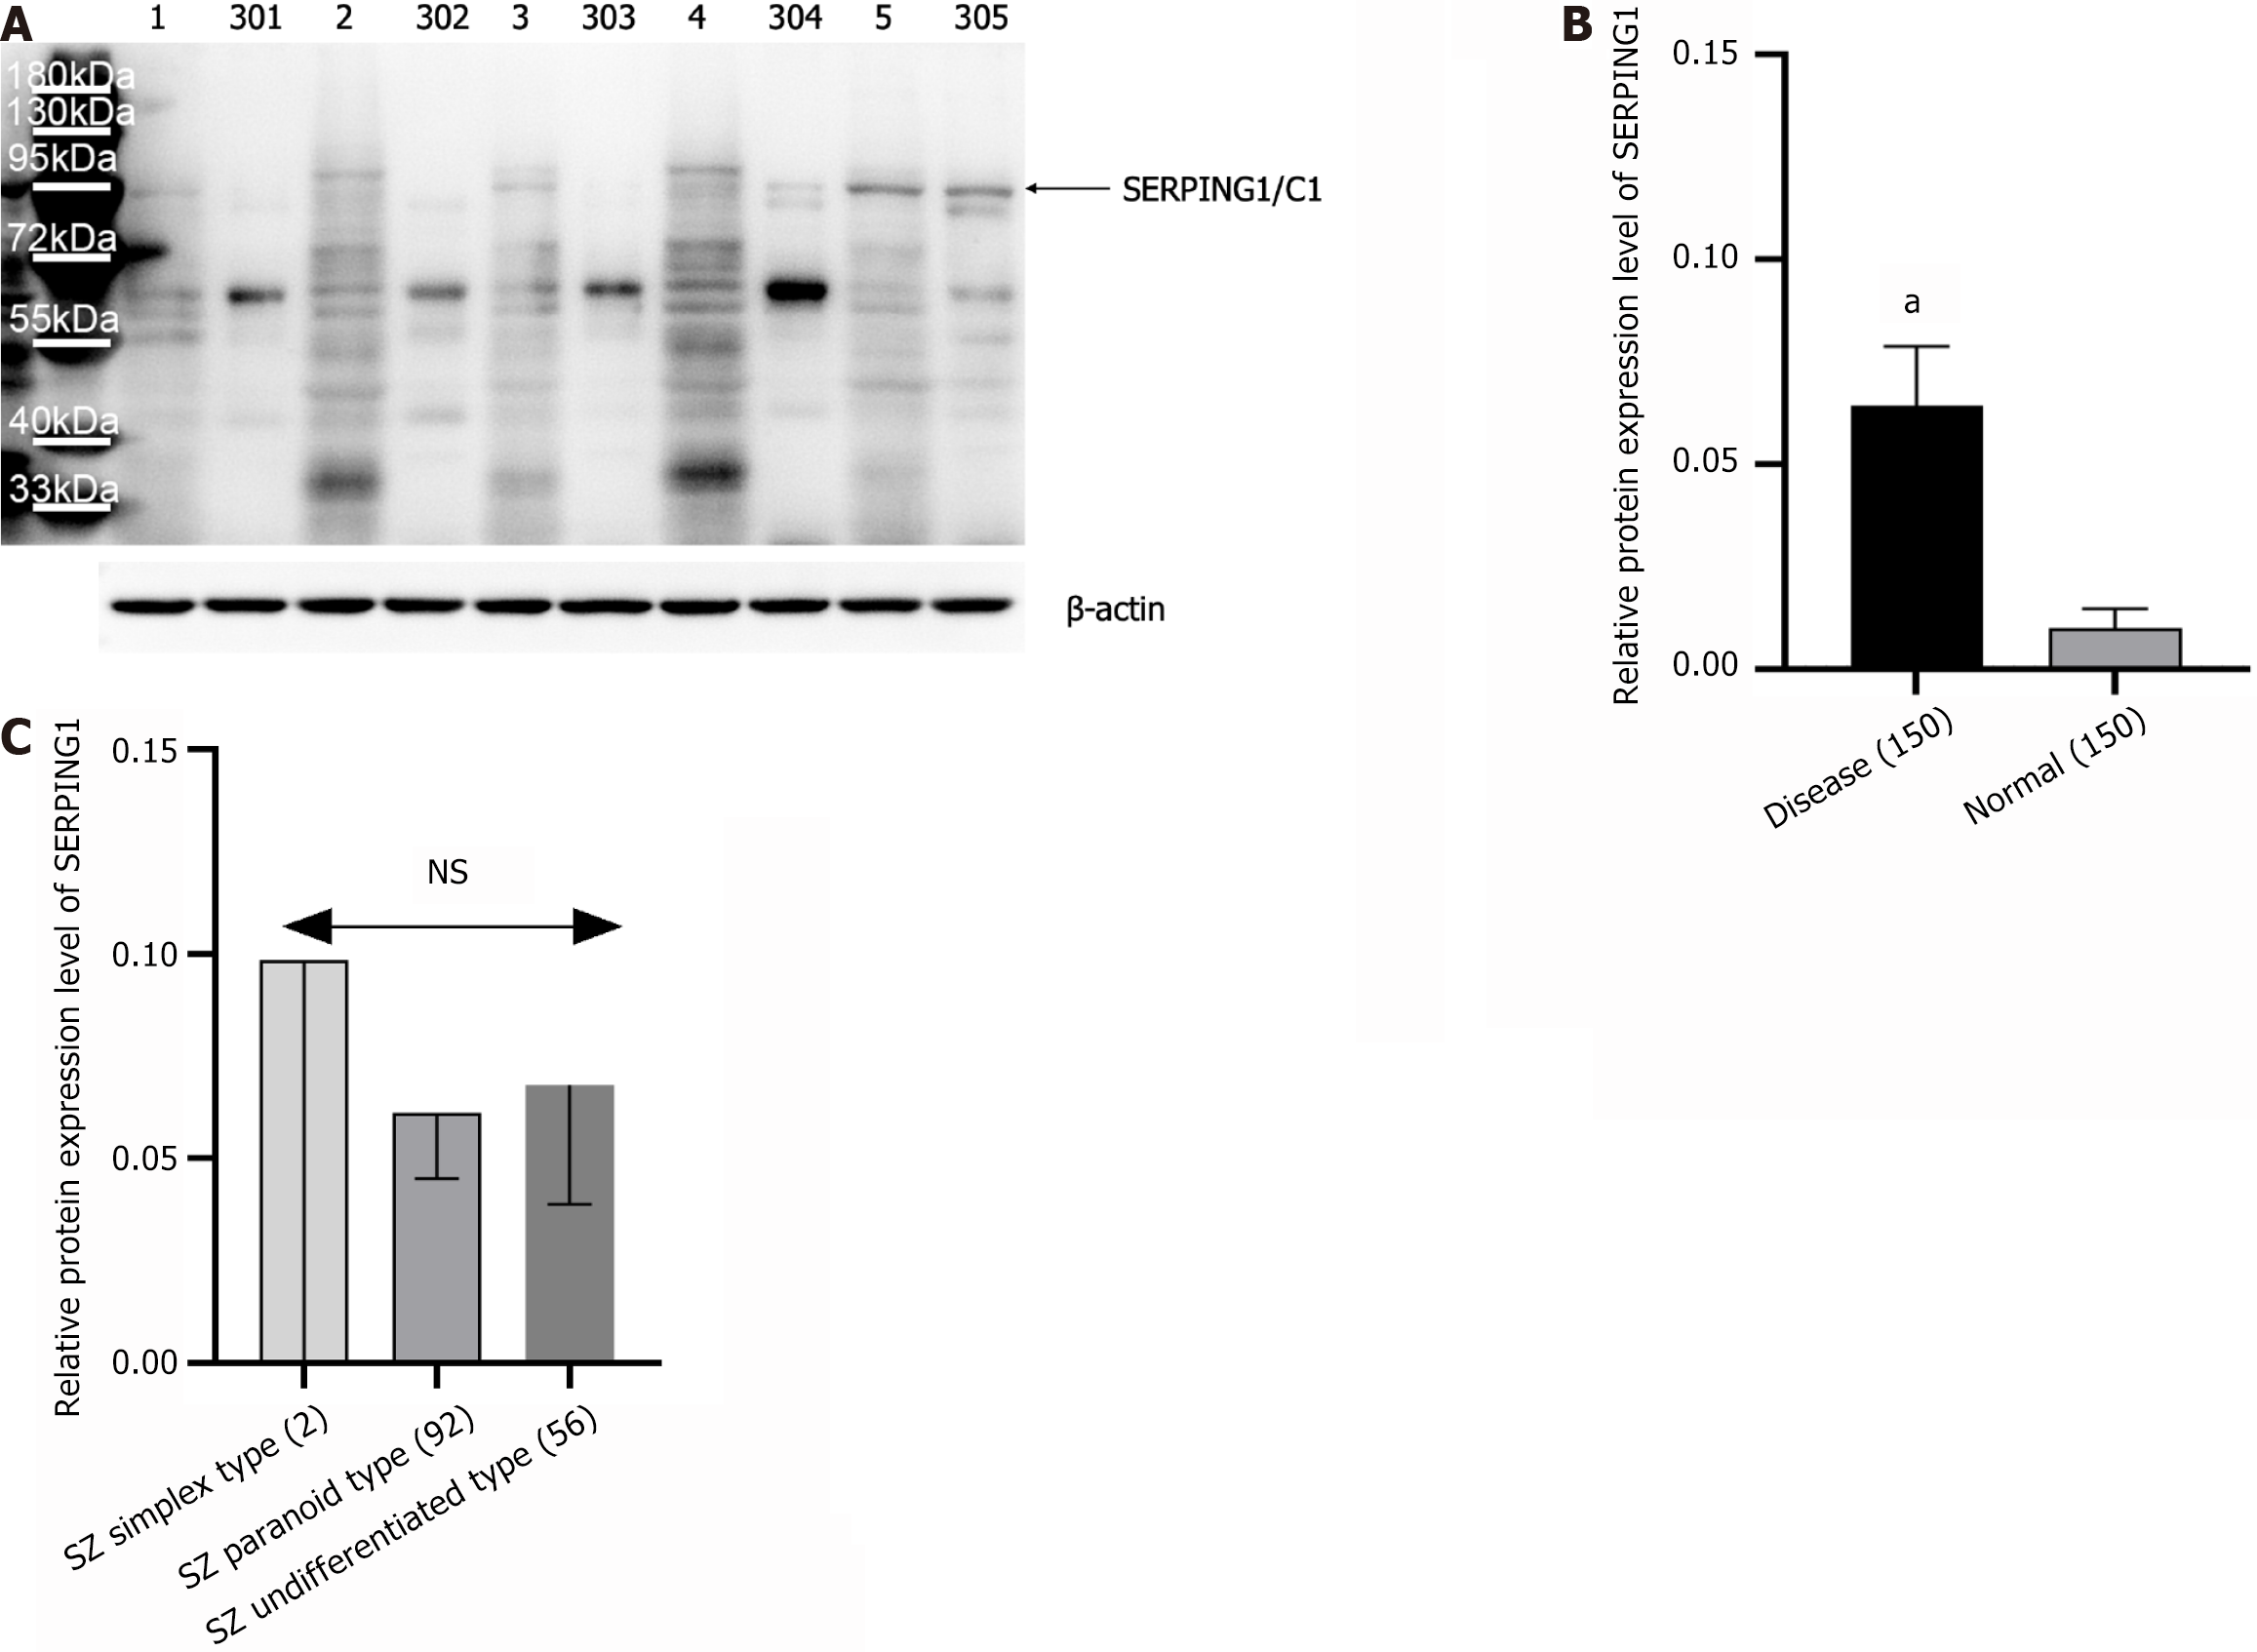
Figure 5 Expression of SERPING1 was detected by western blot (n = 150, including three samples of the results shown in Figure 4A; Here only a subset' western blot images are shown in Figure 5).
A: Immunoblot image [schizophrenia (SZ) group samples numbered 1-150, healthy controls (HC) group samples numbered 301-450; representative western blot images are displayed]; B: Statistical bar chart of relative protein expression comparing SZ and HC groups; C: Statistical bar chart of relative protein expression across SZ subtypes. aP < 0.001, NS: Not significant.
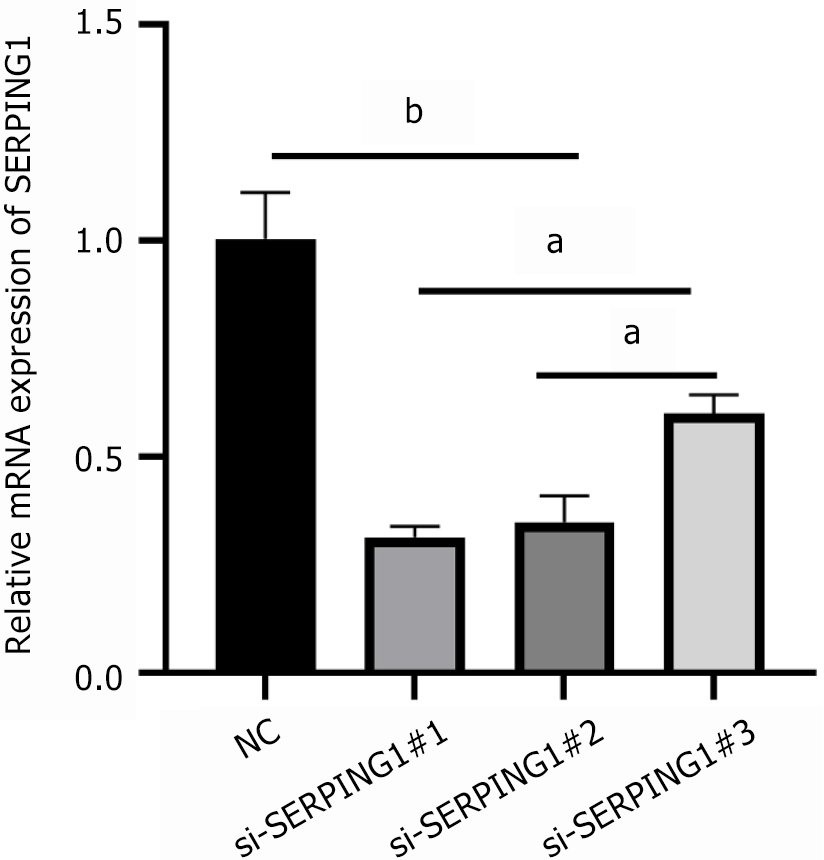
Figure 6 Analysis of SERPING1 expression in si-SERPING1 Lentiviral infection status by real-time fluorescence quantitative PCR (n = 3).
aP < 0.01; bP < 0.001; NC: Negative control.
Figure 7 Analysis of calmodulin-dependent protein kinase II, cAMP response element-binding protein, and brain-derived neurotrophic factor expression in lentiviral infection status by western blot (n = 3).
A: Immunoblotting image; B: Statistical bar chart of relative protein expression. aP < 0.001; NC: Negative control.
Figure 8 Apoptosis of rat neuronal cells which were treated with si-SERPING1 Lentiviral was detected by flow cytometry (n = 3).
A: Flow cytometry scatter plot; B: Statistical bar chart of apoptosis rate. aP < 0.001; NC: Negative control.
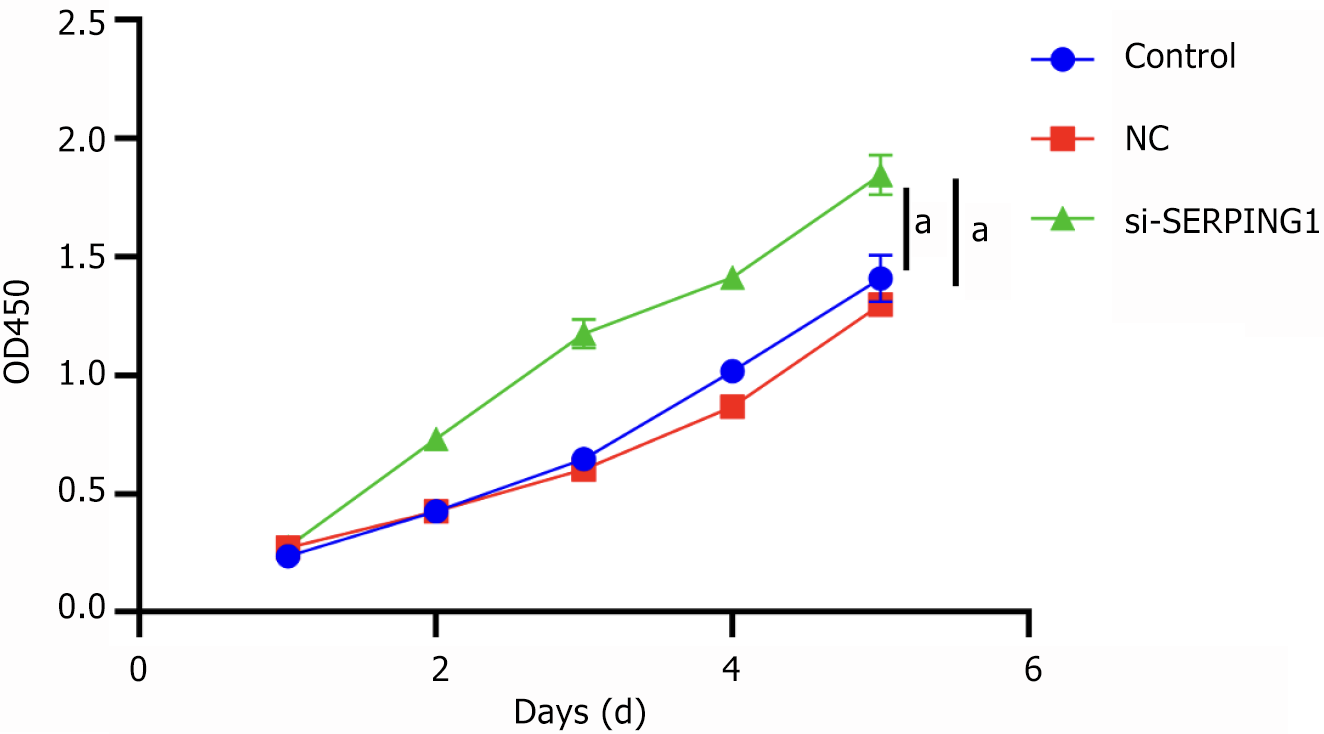
Figure 9 The cell viability was analyzed by Cell Counting Kit-8 in rat neuronal cells treated with si-SERPING1 lentiviral (n = 3).
aP < 0.001. NC: Negative control.
- Citation: Li F, Ren X, Liu JX, Wang TD, Wang B, Wei XB. Integrative transcriptomic and proteomic analysis reveals that SERPING1 inhibits neuronal proliferation via the CaMKII-CREB-BDNF pathway in schizophrenia. World J Psychiatry 2025; 15(2): 100214
- URL: https://www.wjgnet.com/2220-3206/full/v15/i2/100214.htm
- DOI: https://dx.doi.org/10.5498/wjp.v15.i2.100214


