Copyright
©The Author(s) 2025.
World J Psychiatry. Jan 19, 2025; 15(1): 101186
Published online Jan 19, 2025. doi: 10.5498/wjp.v15.i1.101186
Published online Jan 19, 2025. doi: 10.5498/wjp.v15.i1.101186
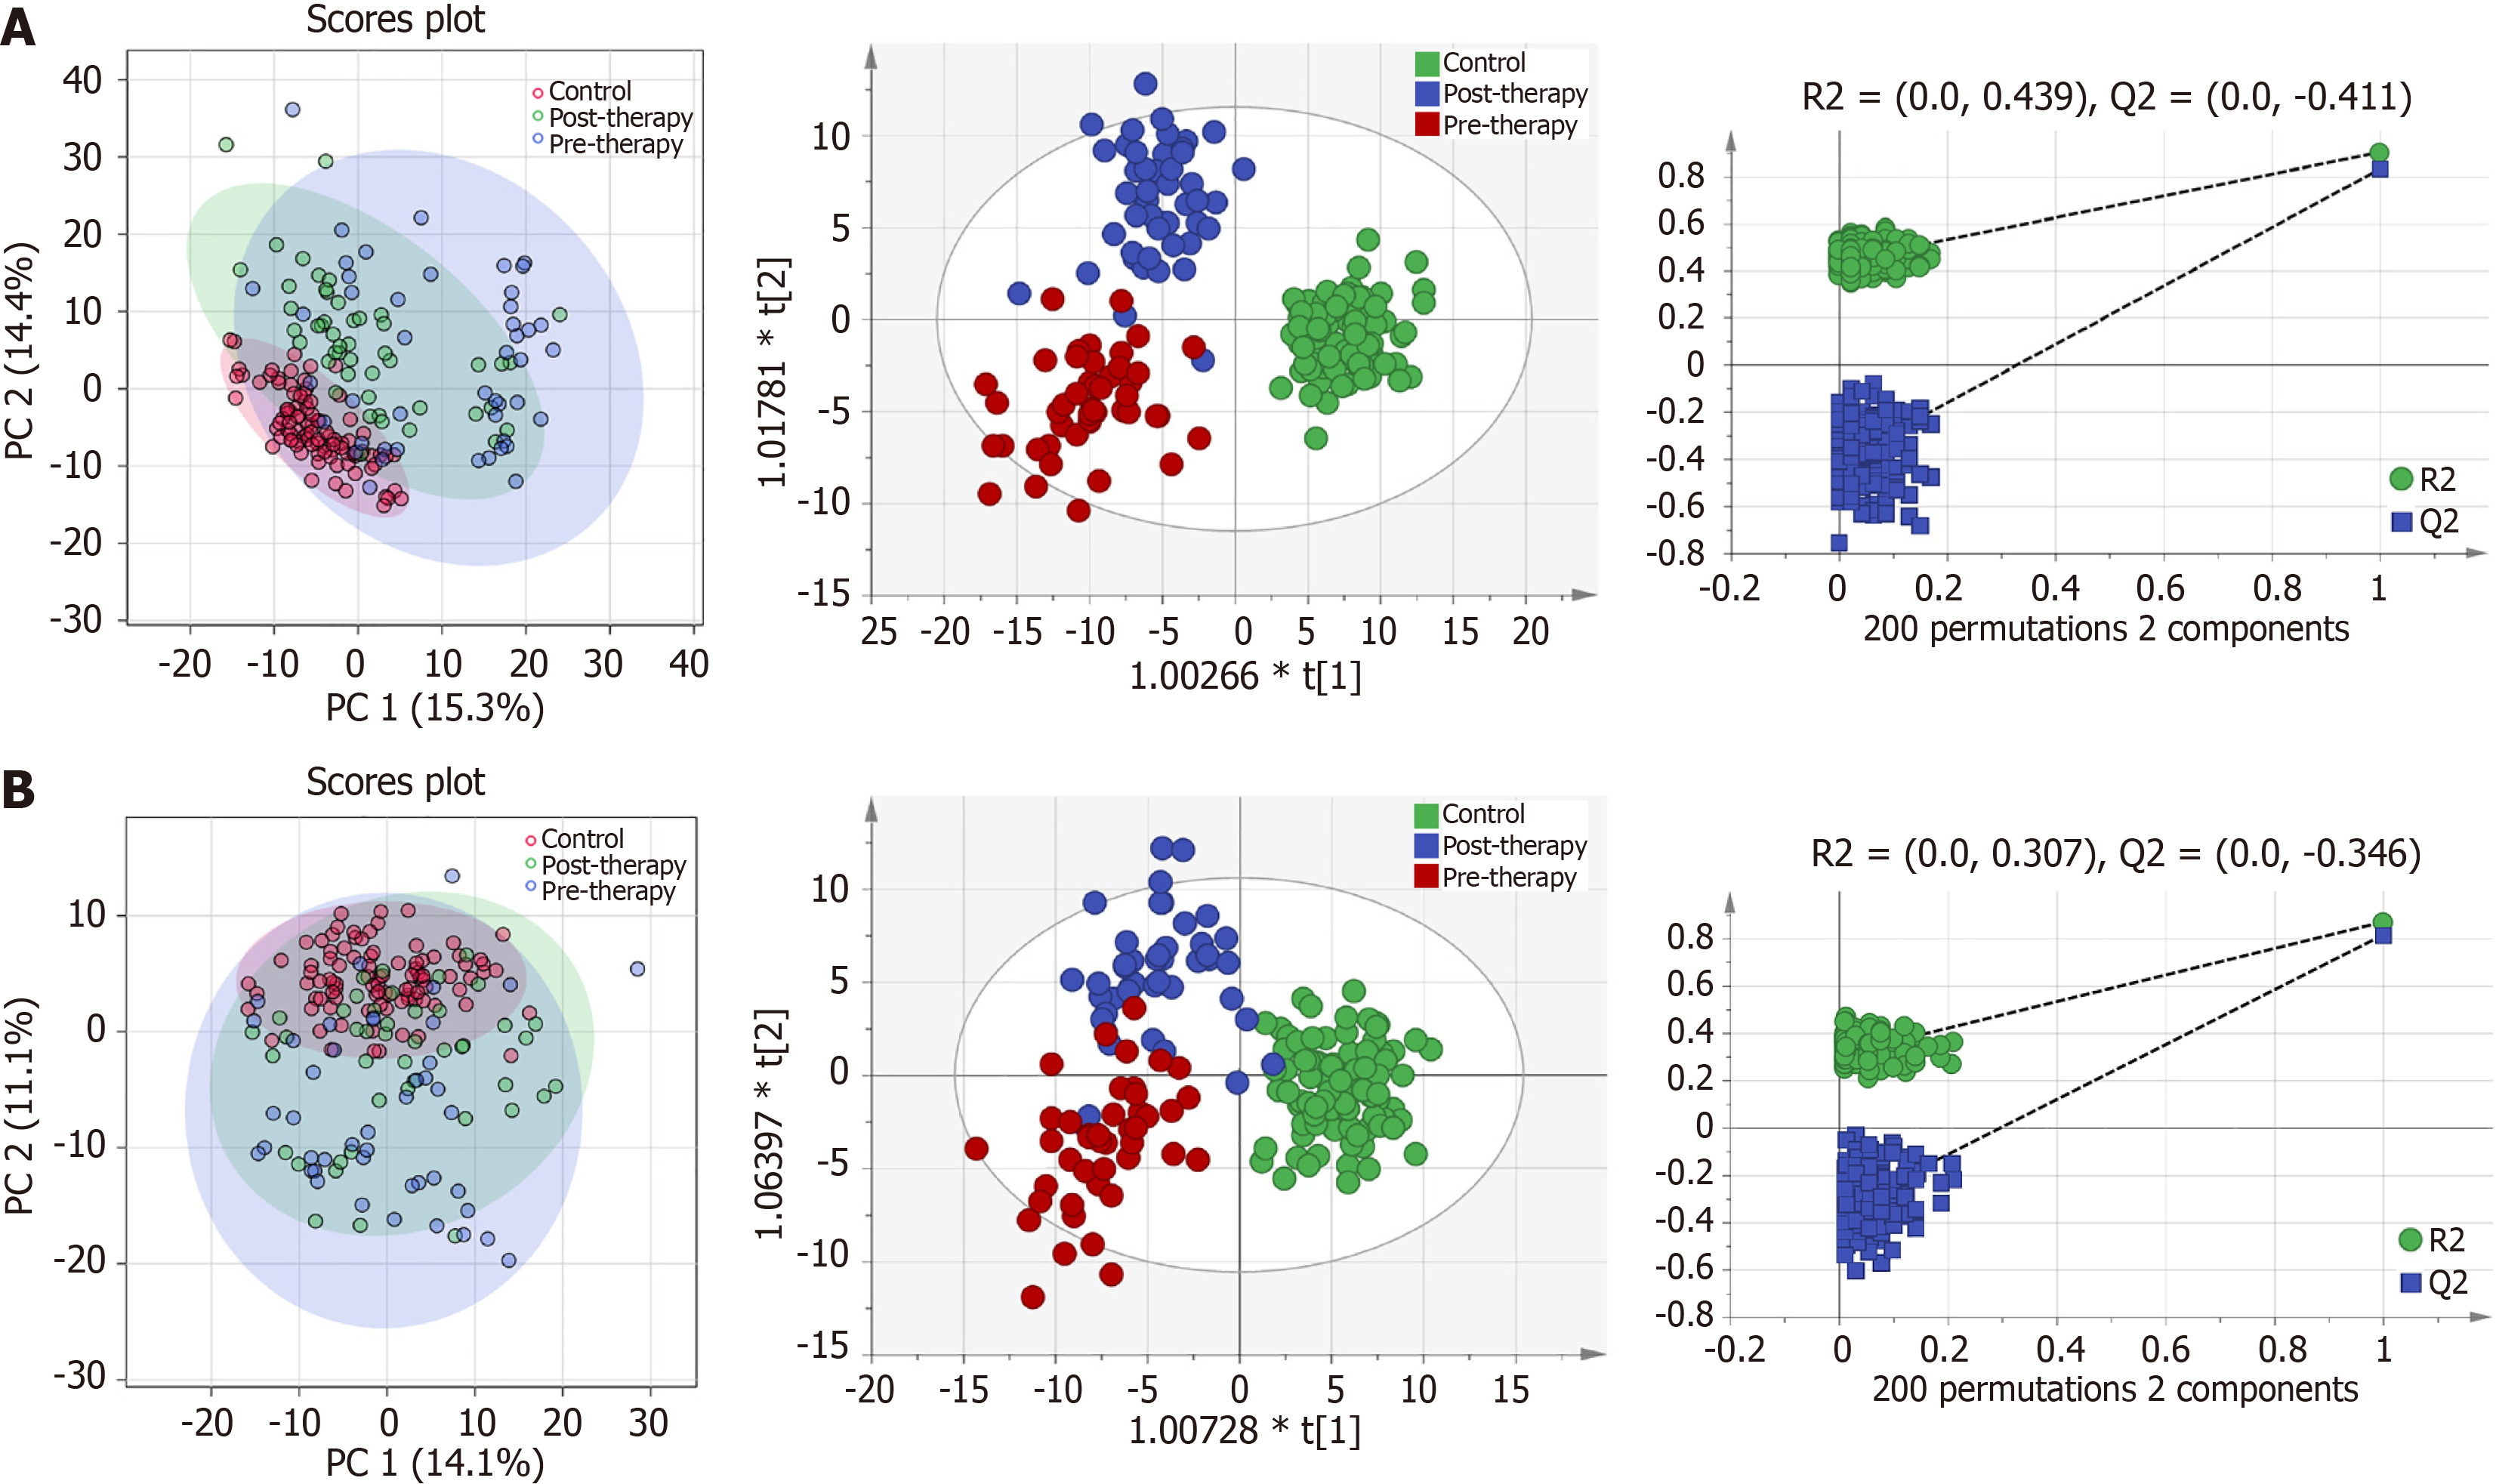
Figure 1 Metabolomic profiling analysis of the two groups.
A: Positive ion modes; B: Negative ion modes. Principal component analysis and orthogonal partial least squares discriminant analysis score plots and permutation tests of the two groups in positive (A) and negative (B) ion modes.
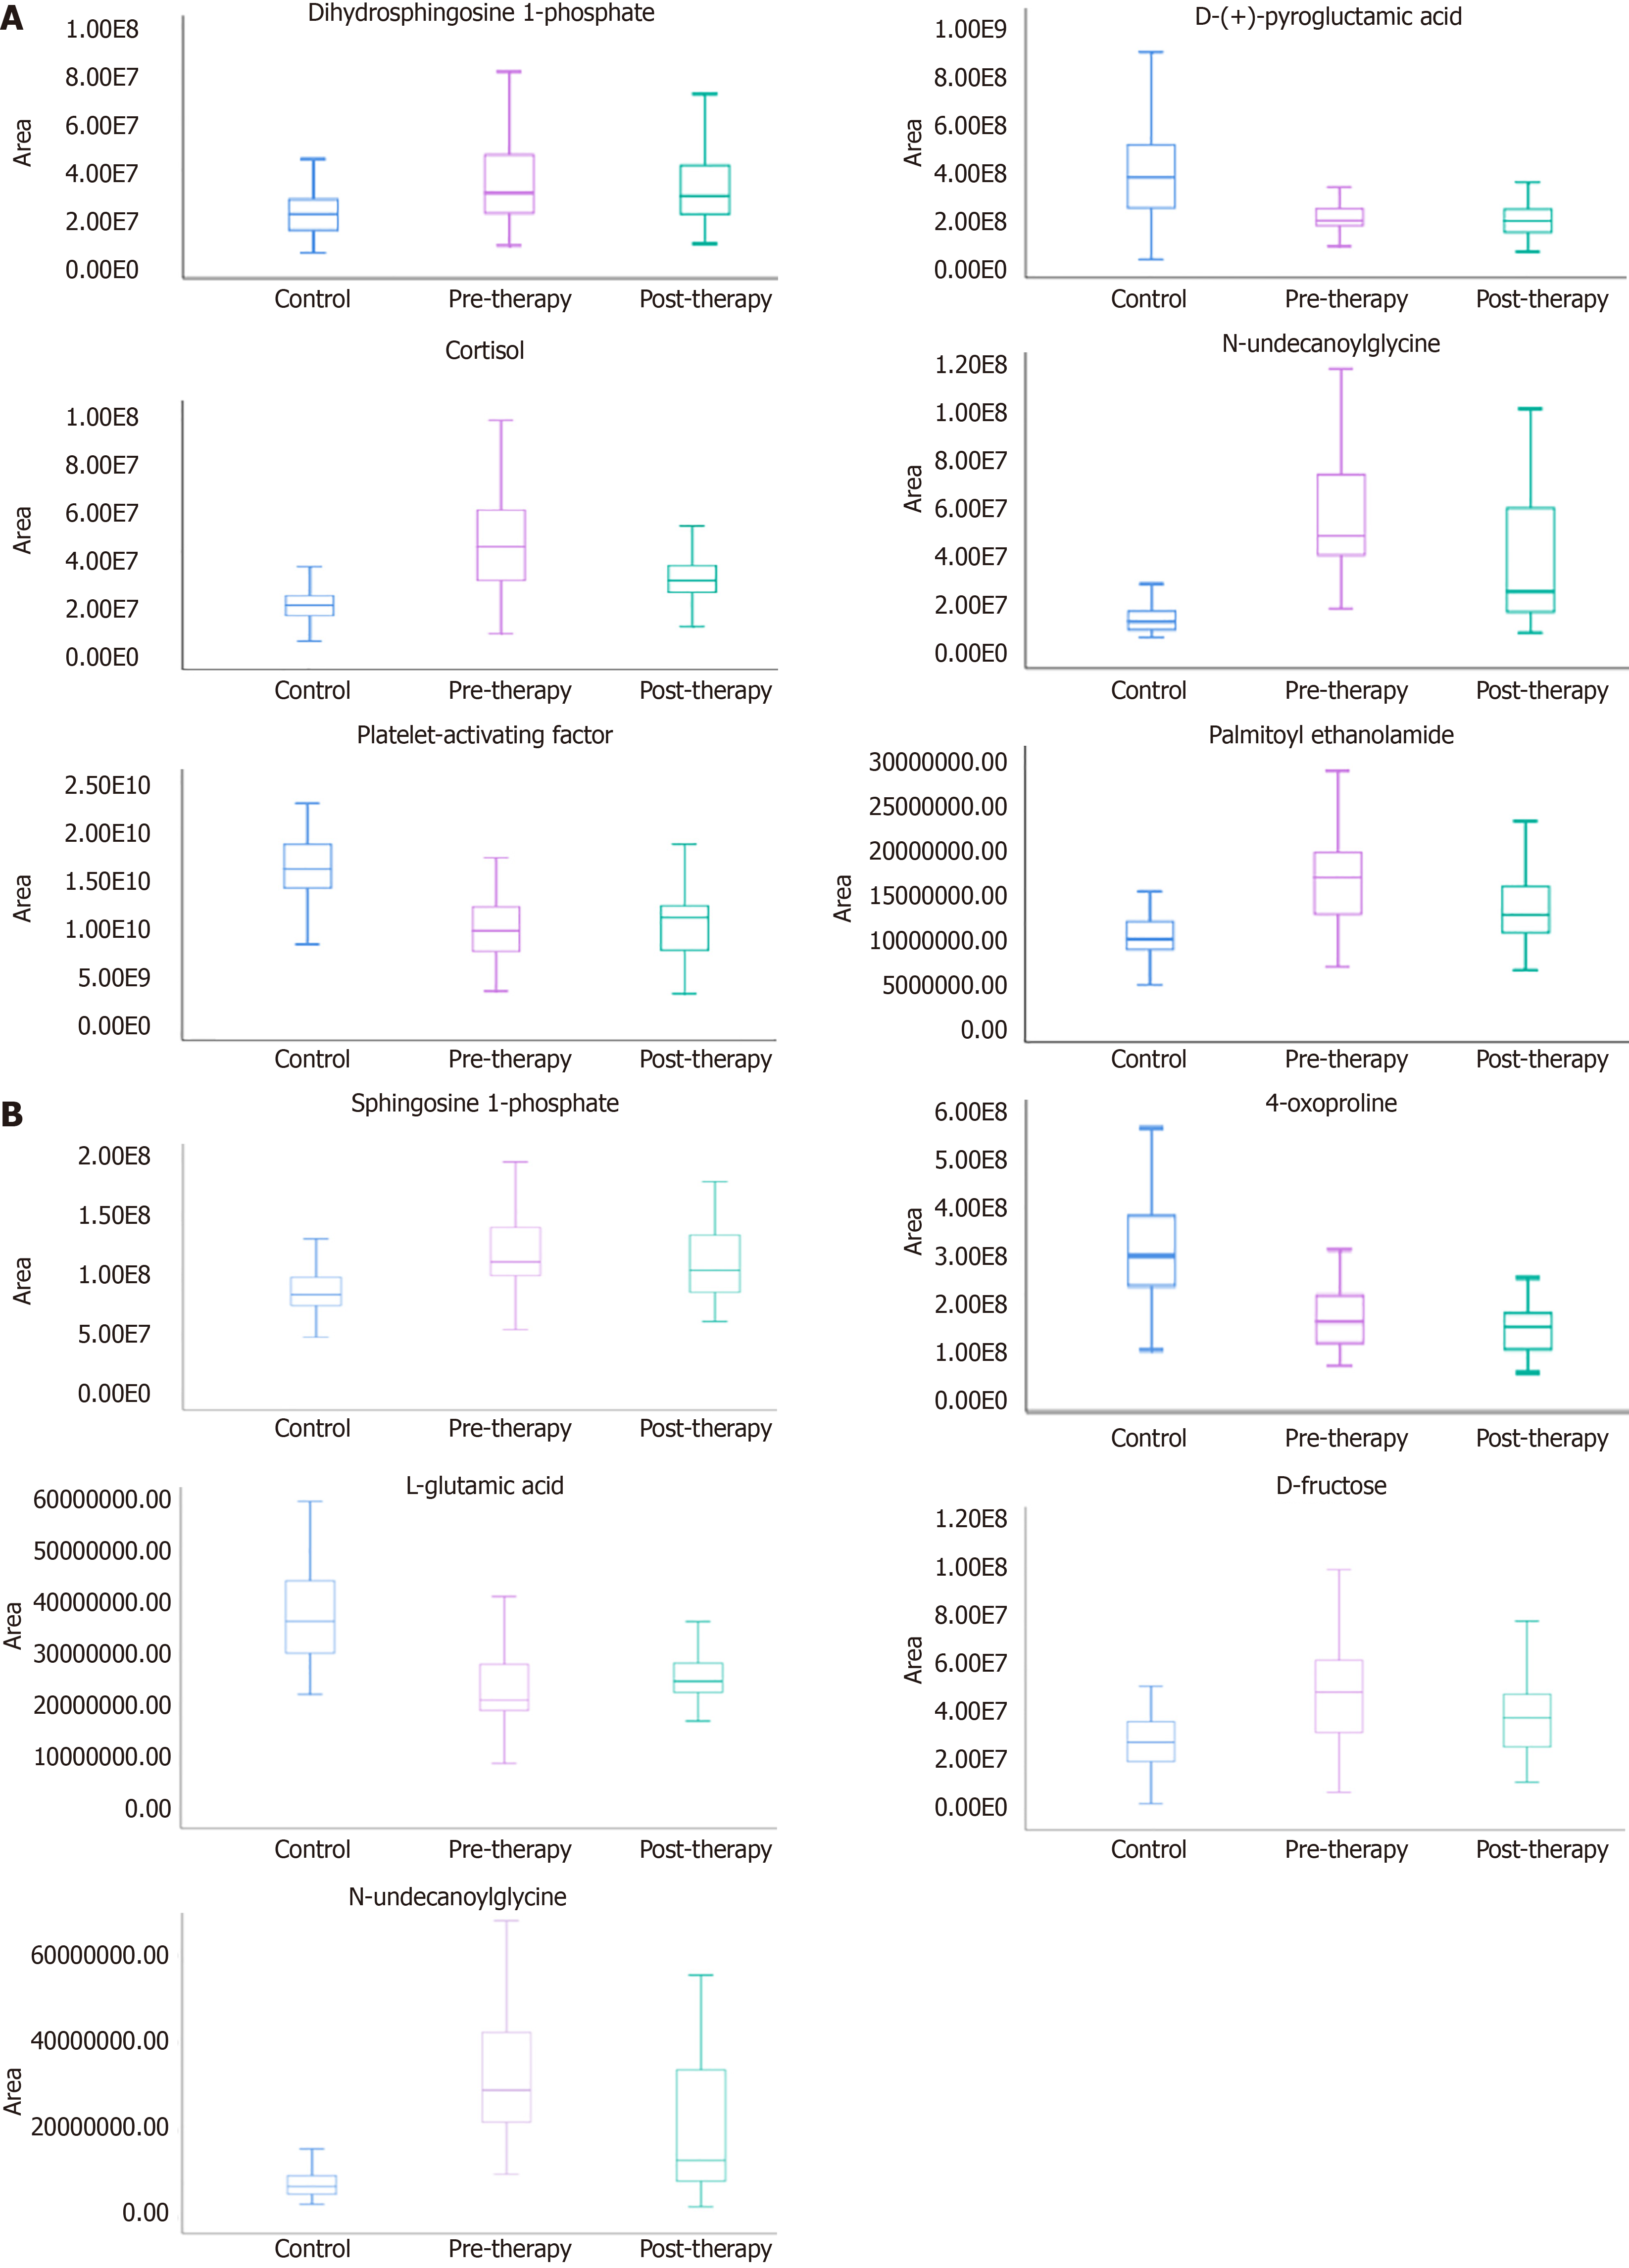
Figure 2 Relative peak areas of differentially abundant metabolites in the experimental group regulated by olanzapine.
A: Positive ion mode; B: Negative ion mode. All data are presented as the median ± min to max (n = 11).
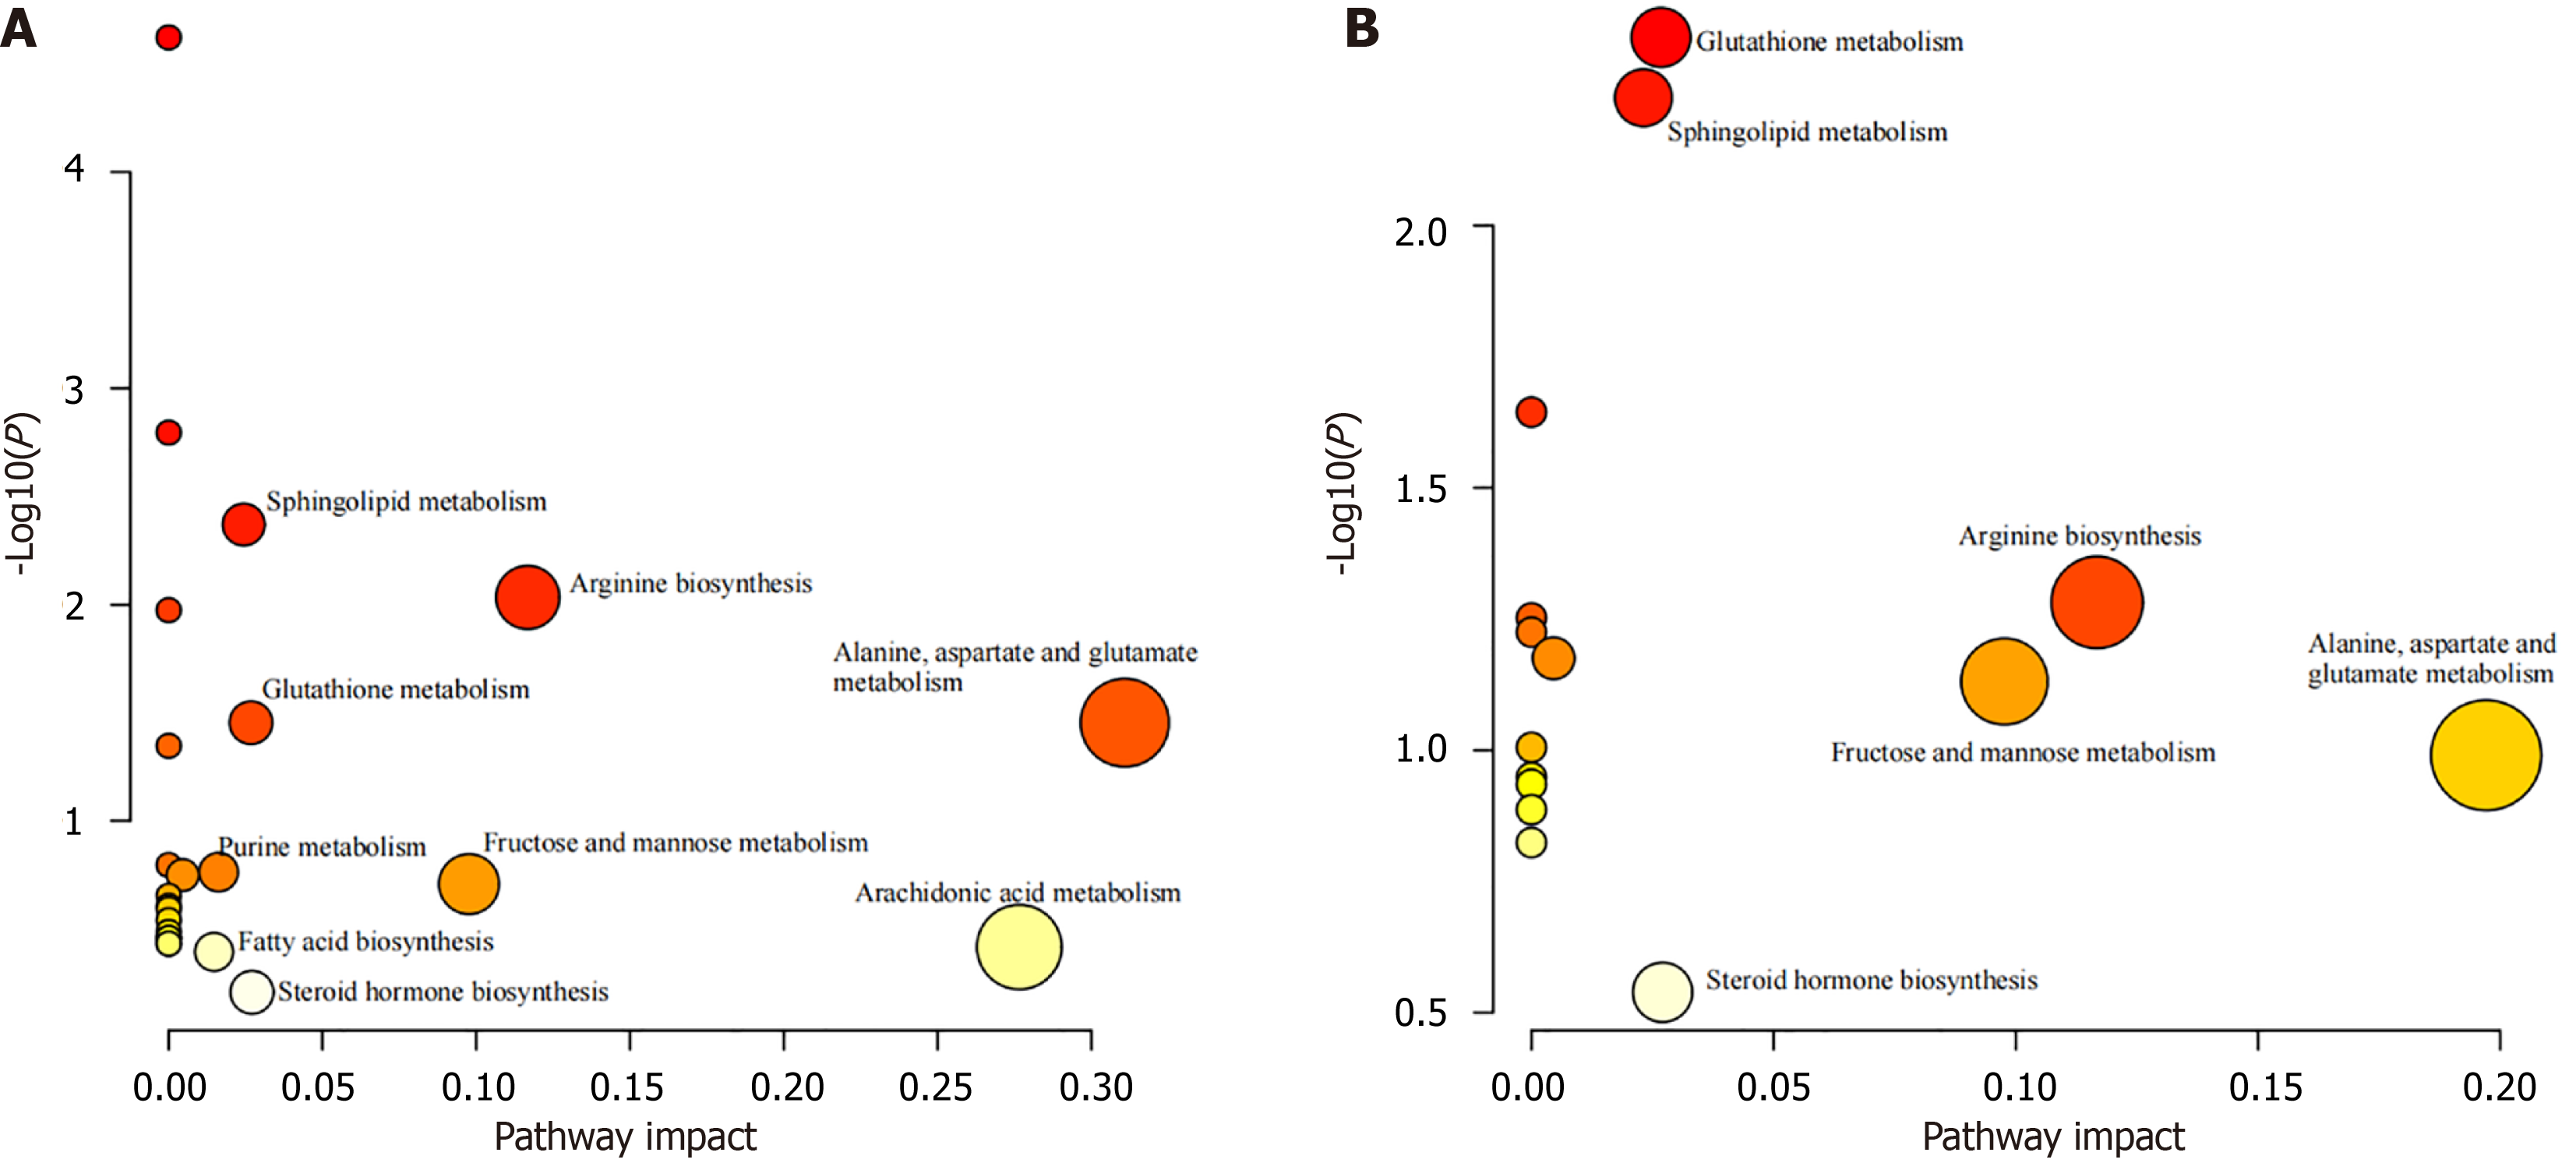
Figure 3 Metabolic pathway analysis.
A: The disordered metabolic pathways in Schizophrenia patients with a moderate to high risk of violent attacks; B: The metabolic pathways regulated by olanzapine. The size and color of each circle indicate the significance of the pathway ranked by the P value and the pathway impact score, respectively. Red represents higher P values, and yellow represents lower P values. The larger the circle is, the higher the impact score.
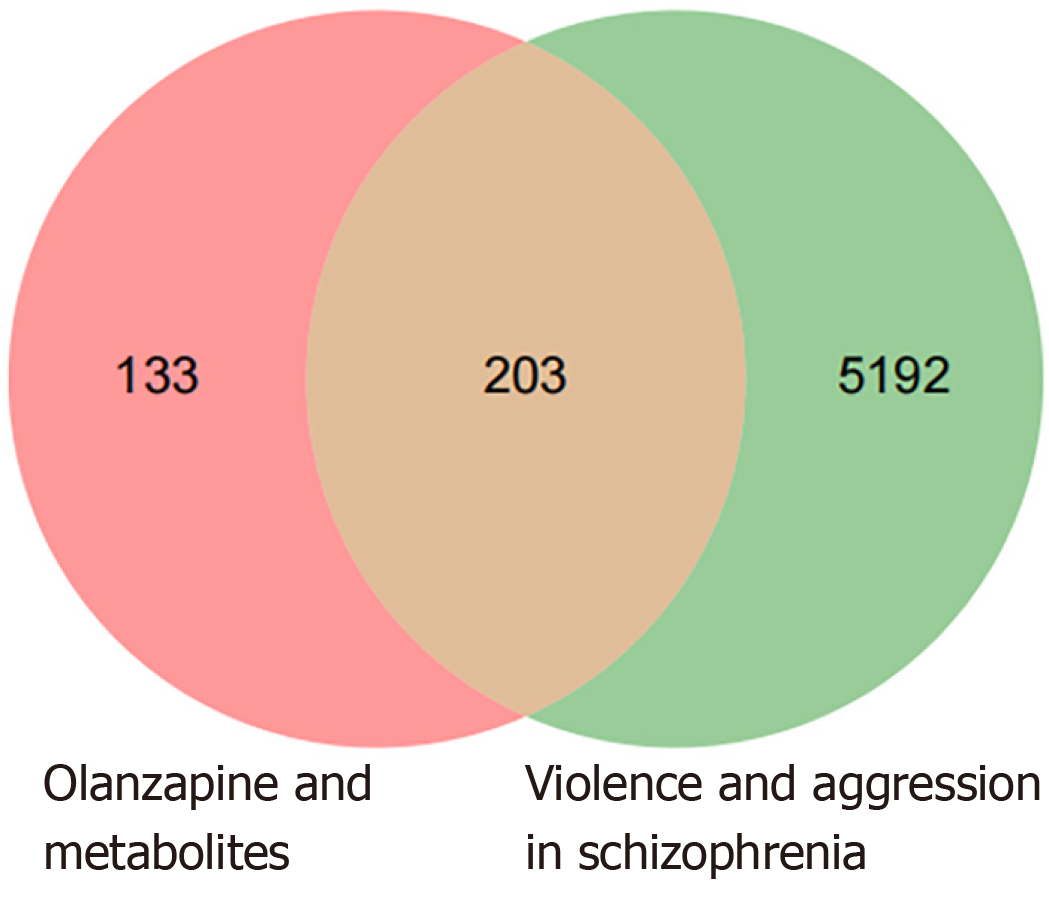
Figure 4 Venn diagram of common targets.
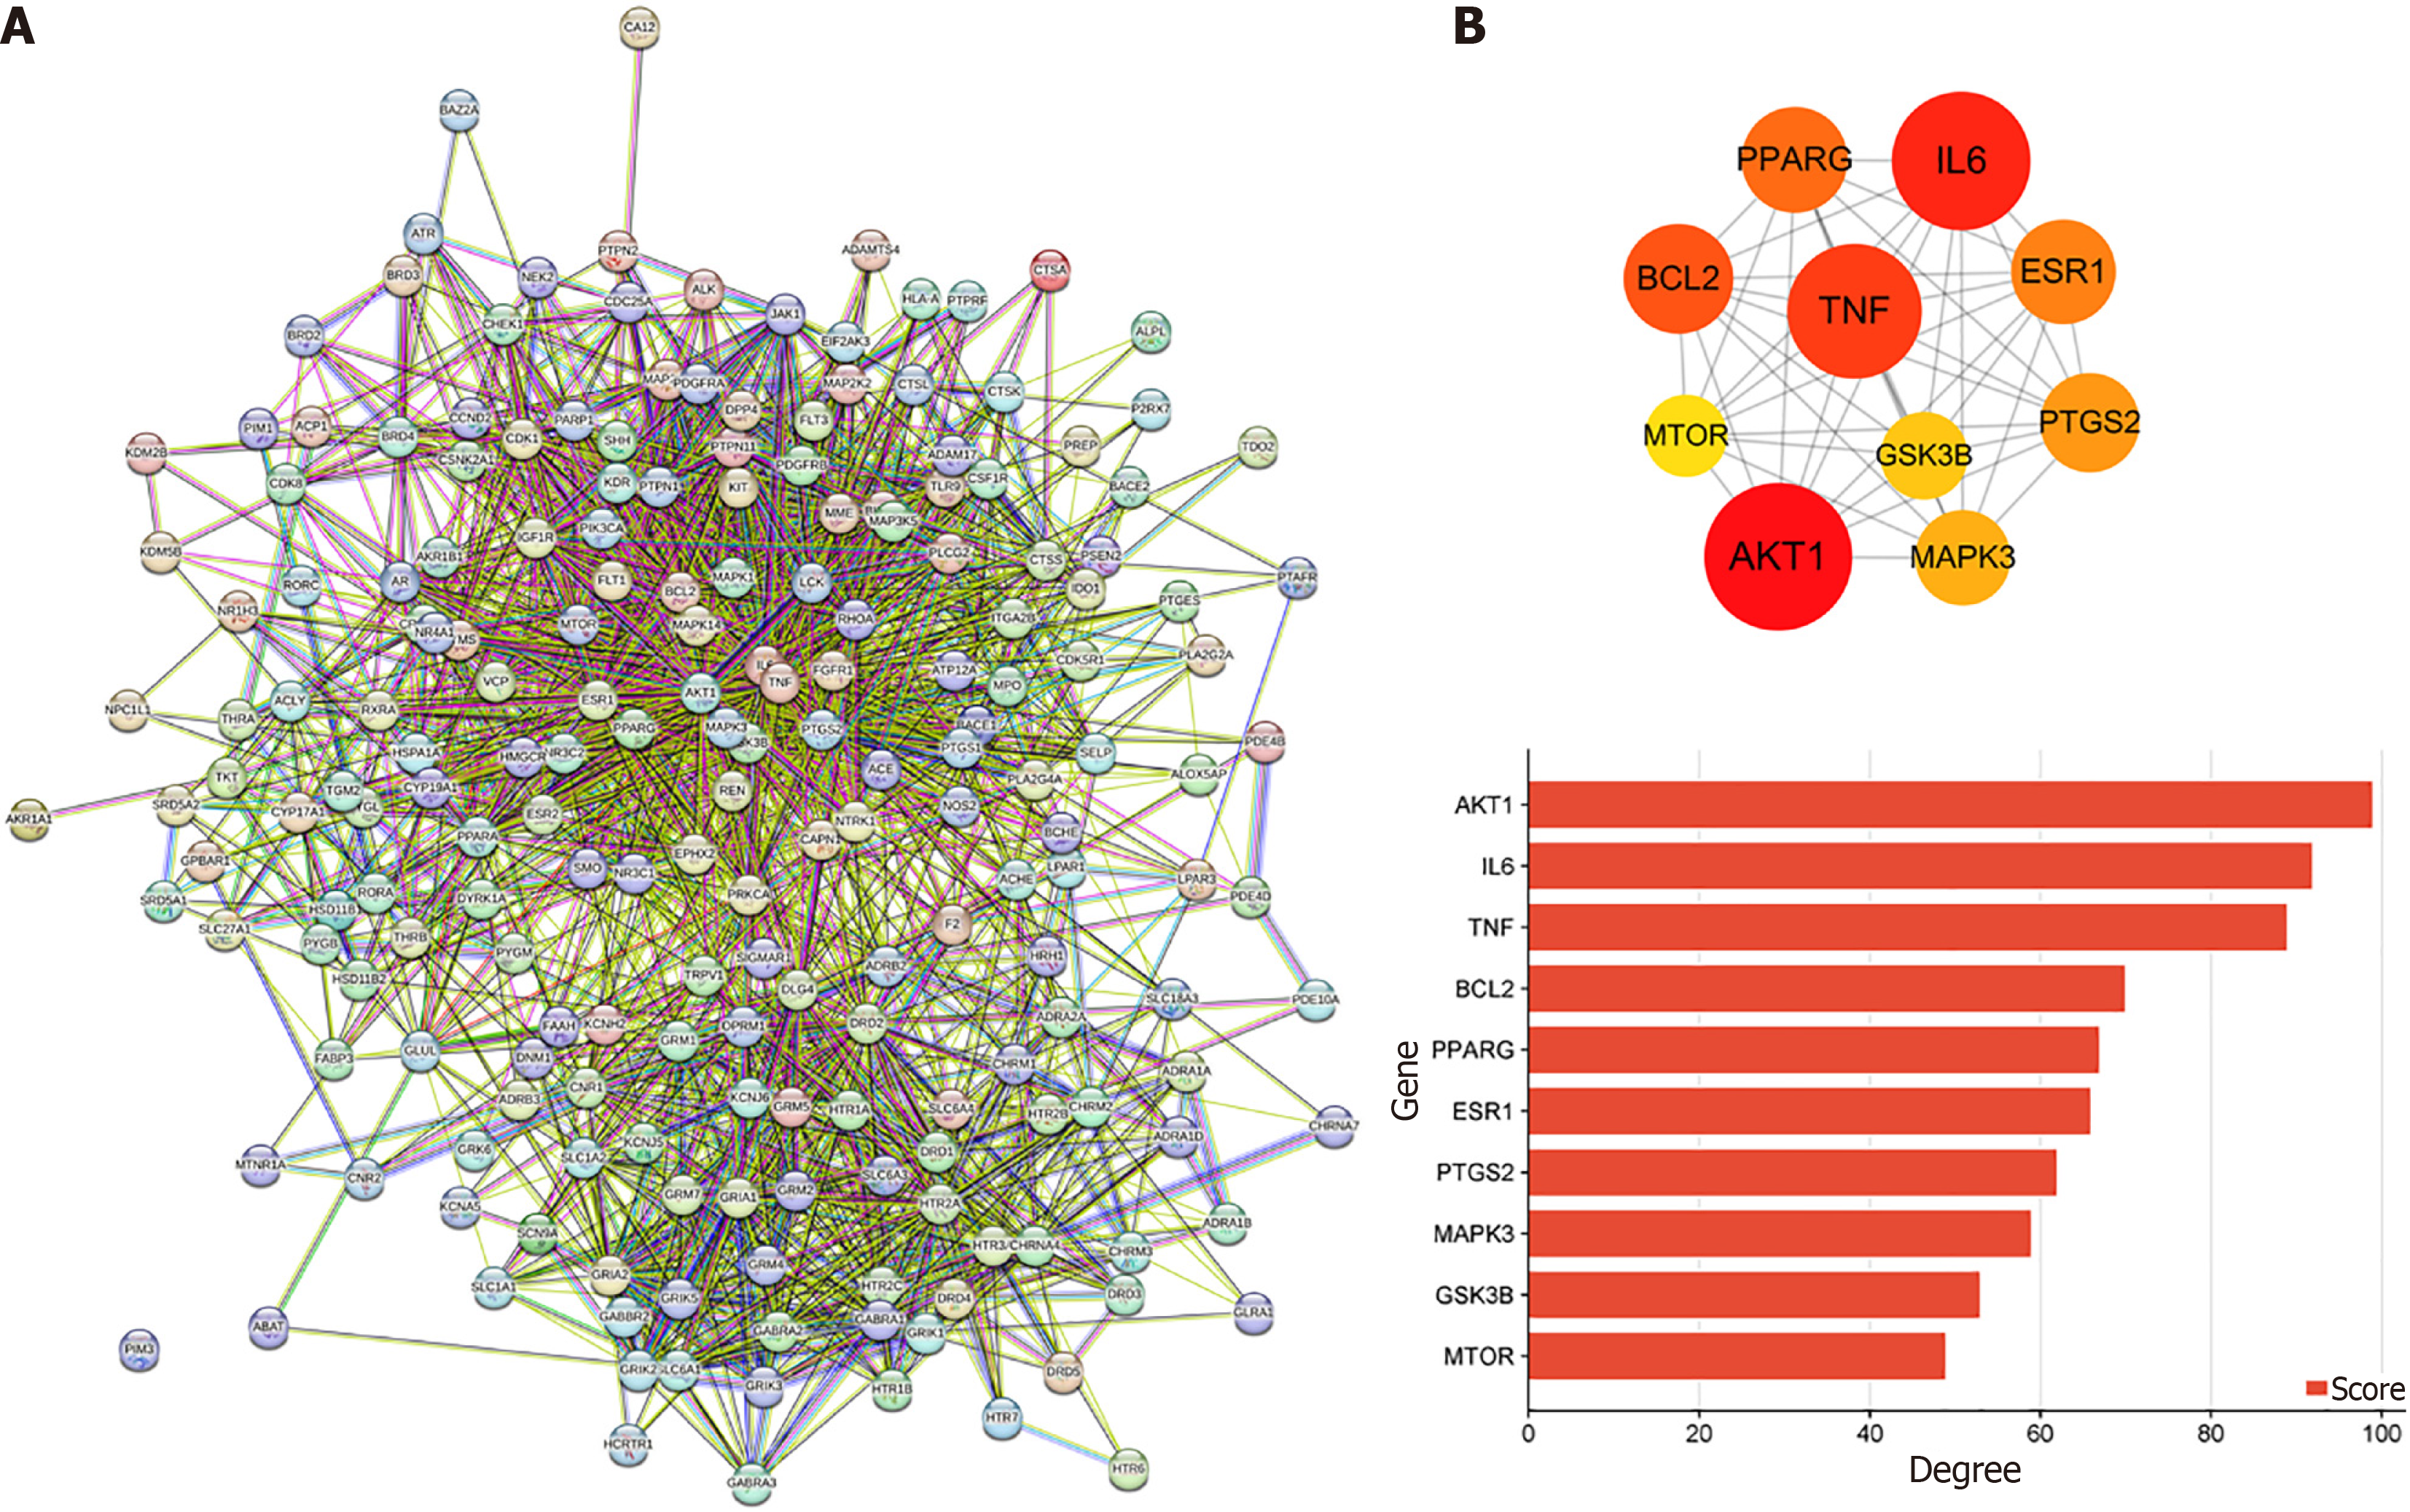
Figure 5 Protein-protein interaction network and hub genes.
A: Protein-protein interaction network; B: Hub genes.
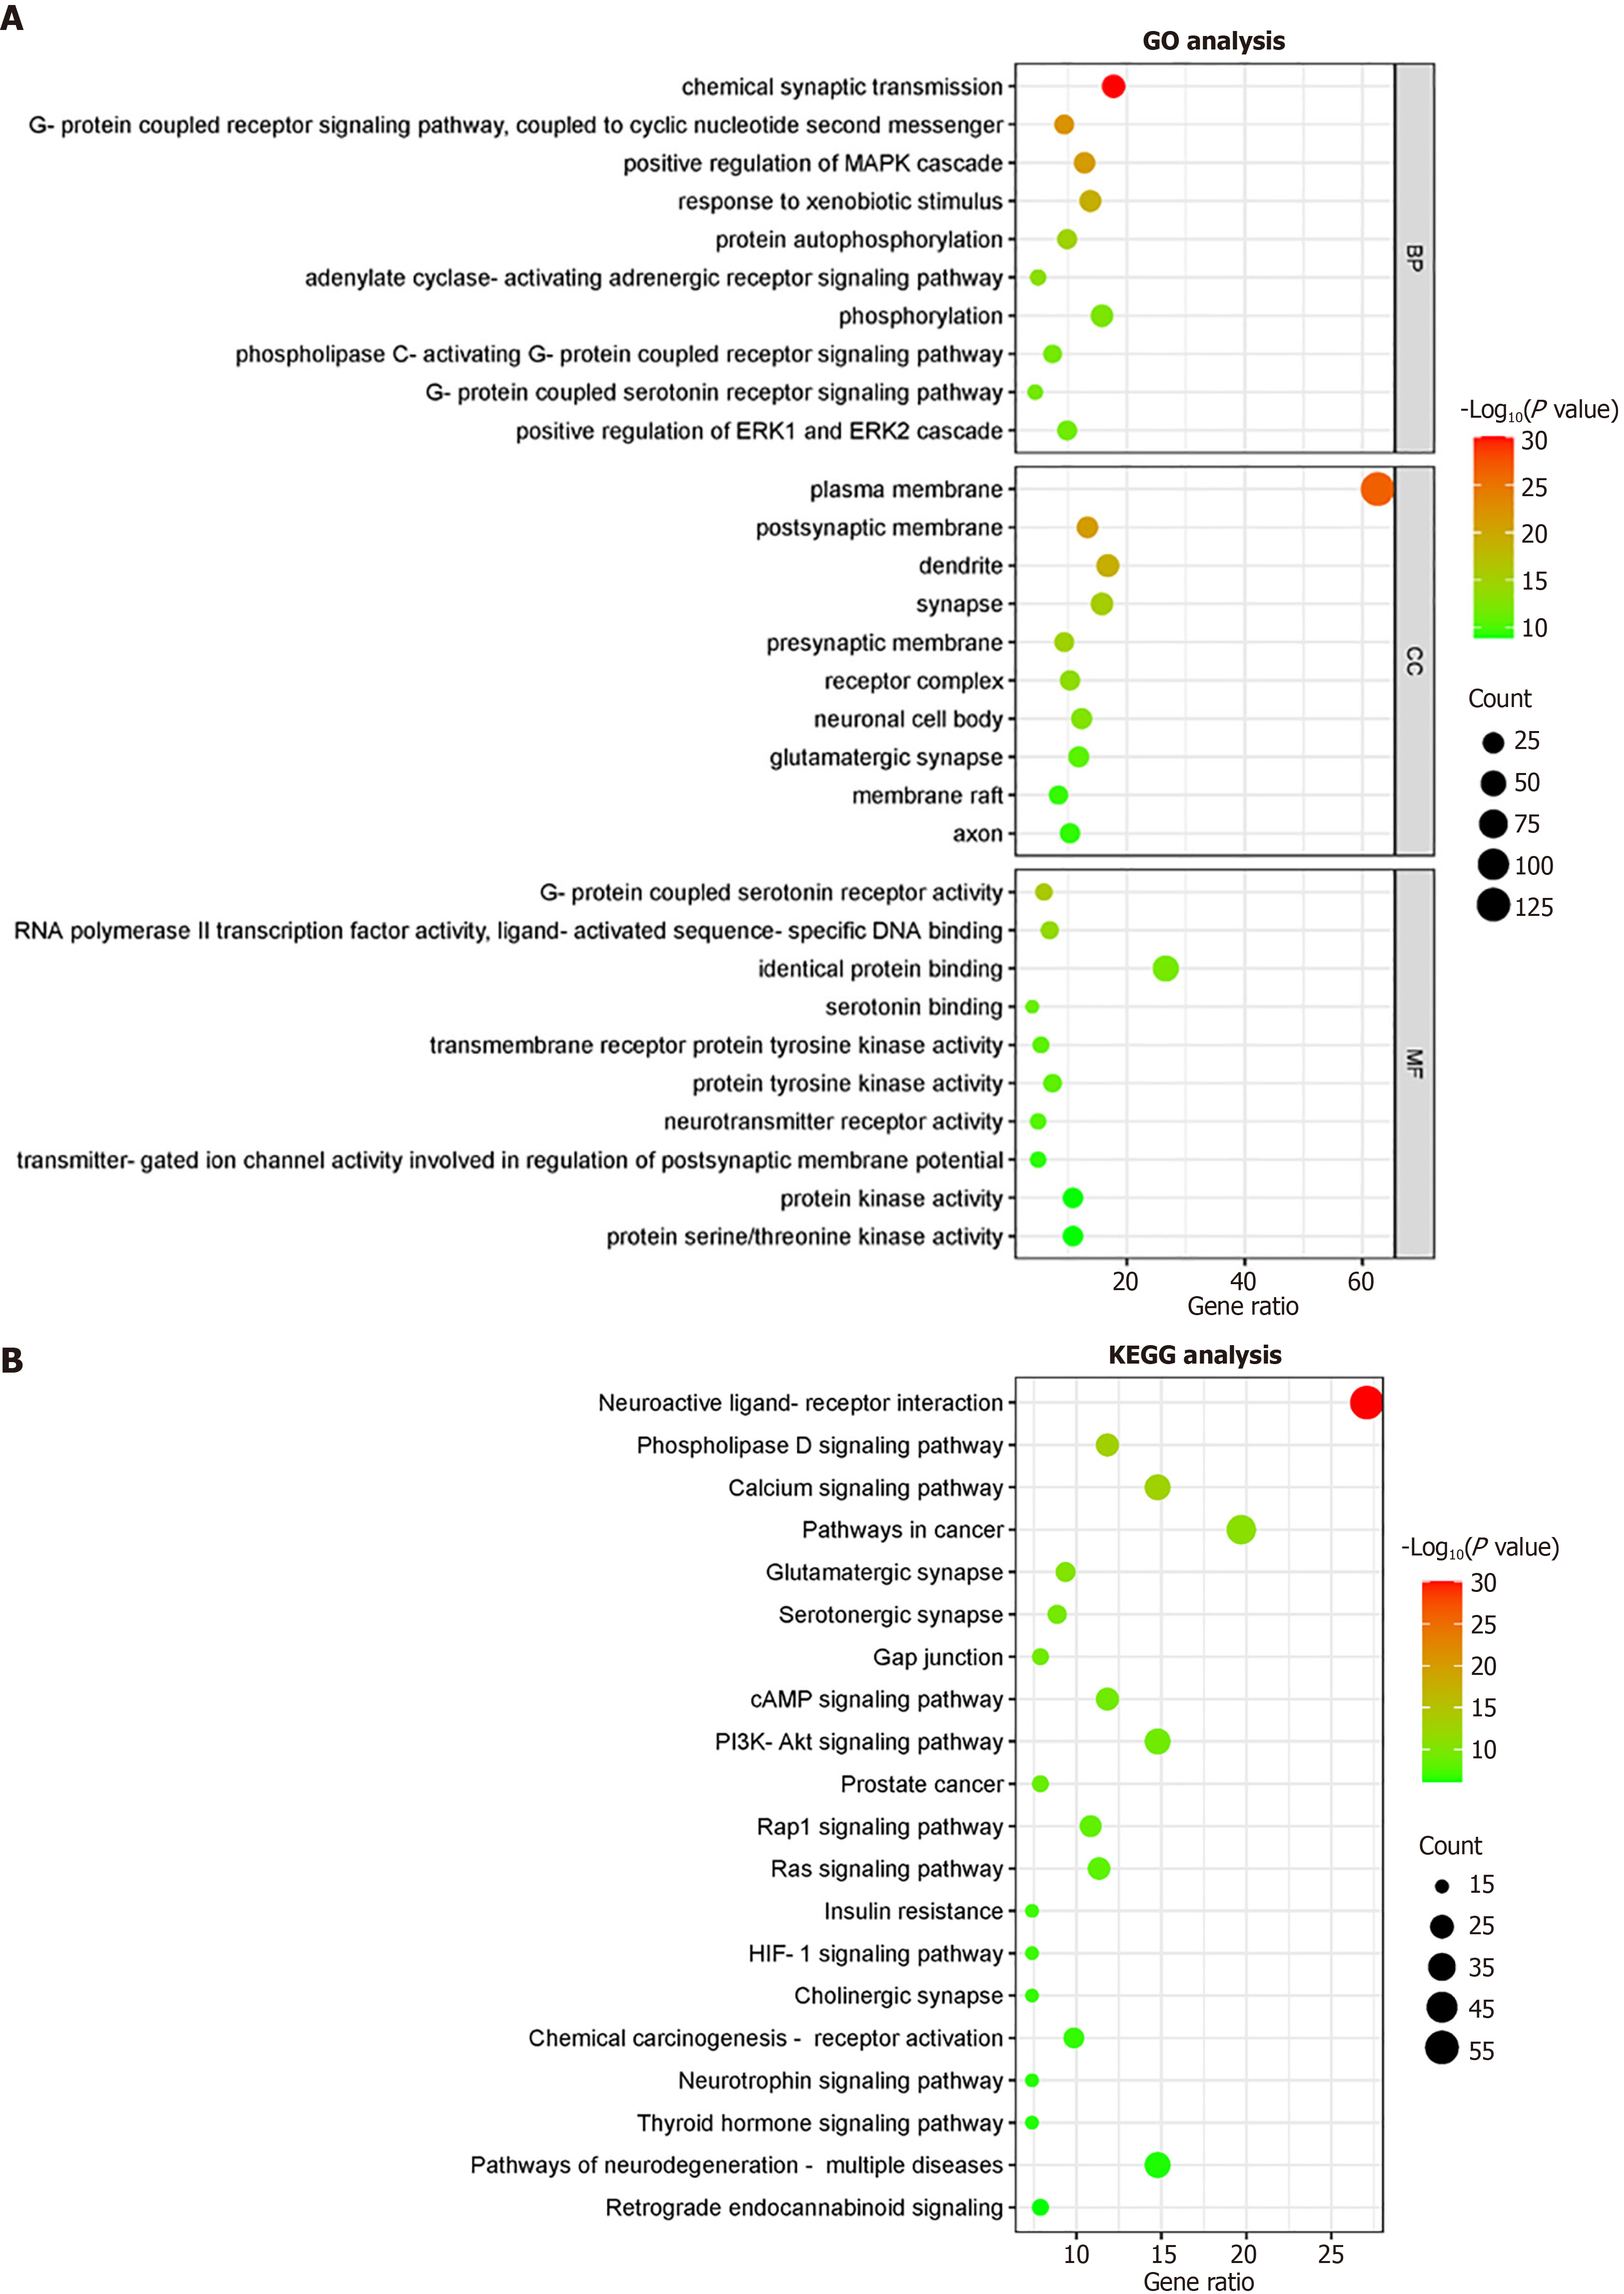
Figure 6 Gene Ontology function and Kyoto Encyclopedia of Genes and Genomes pathway enrichment analysis.
A: Gene Ontology function; B: Kyoto Encyclopedia of Genes and Genomes pathway enrichment analysis.
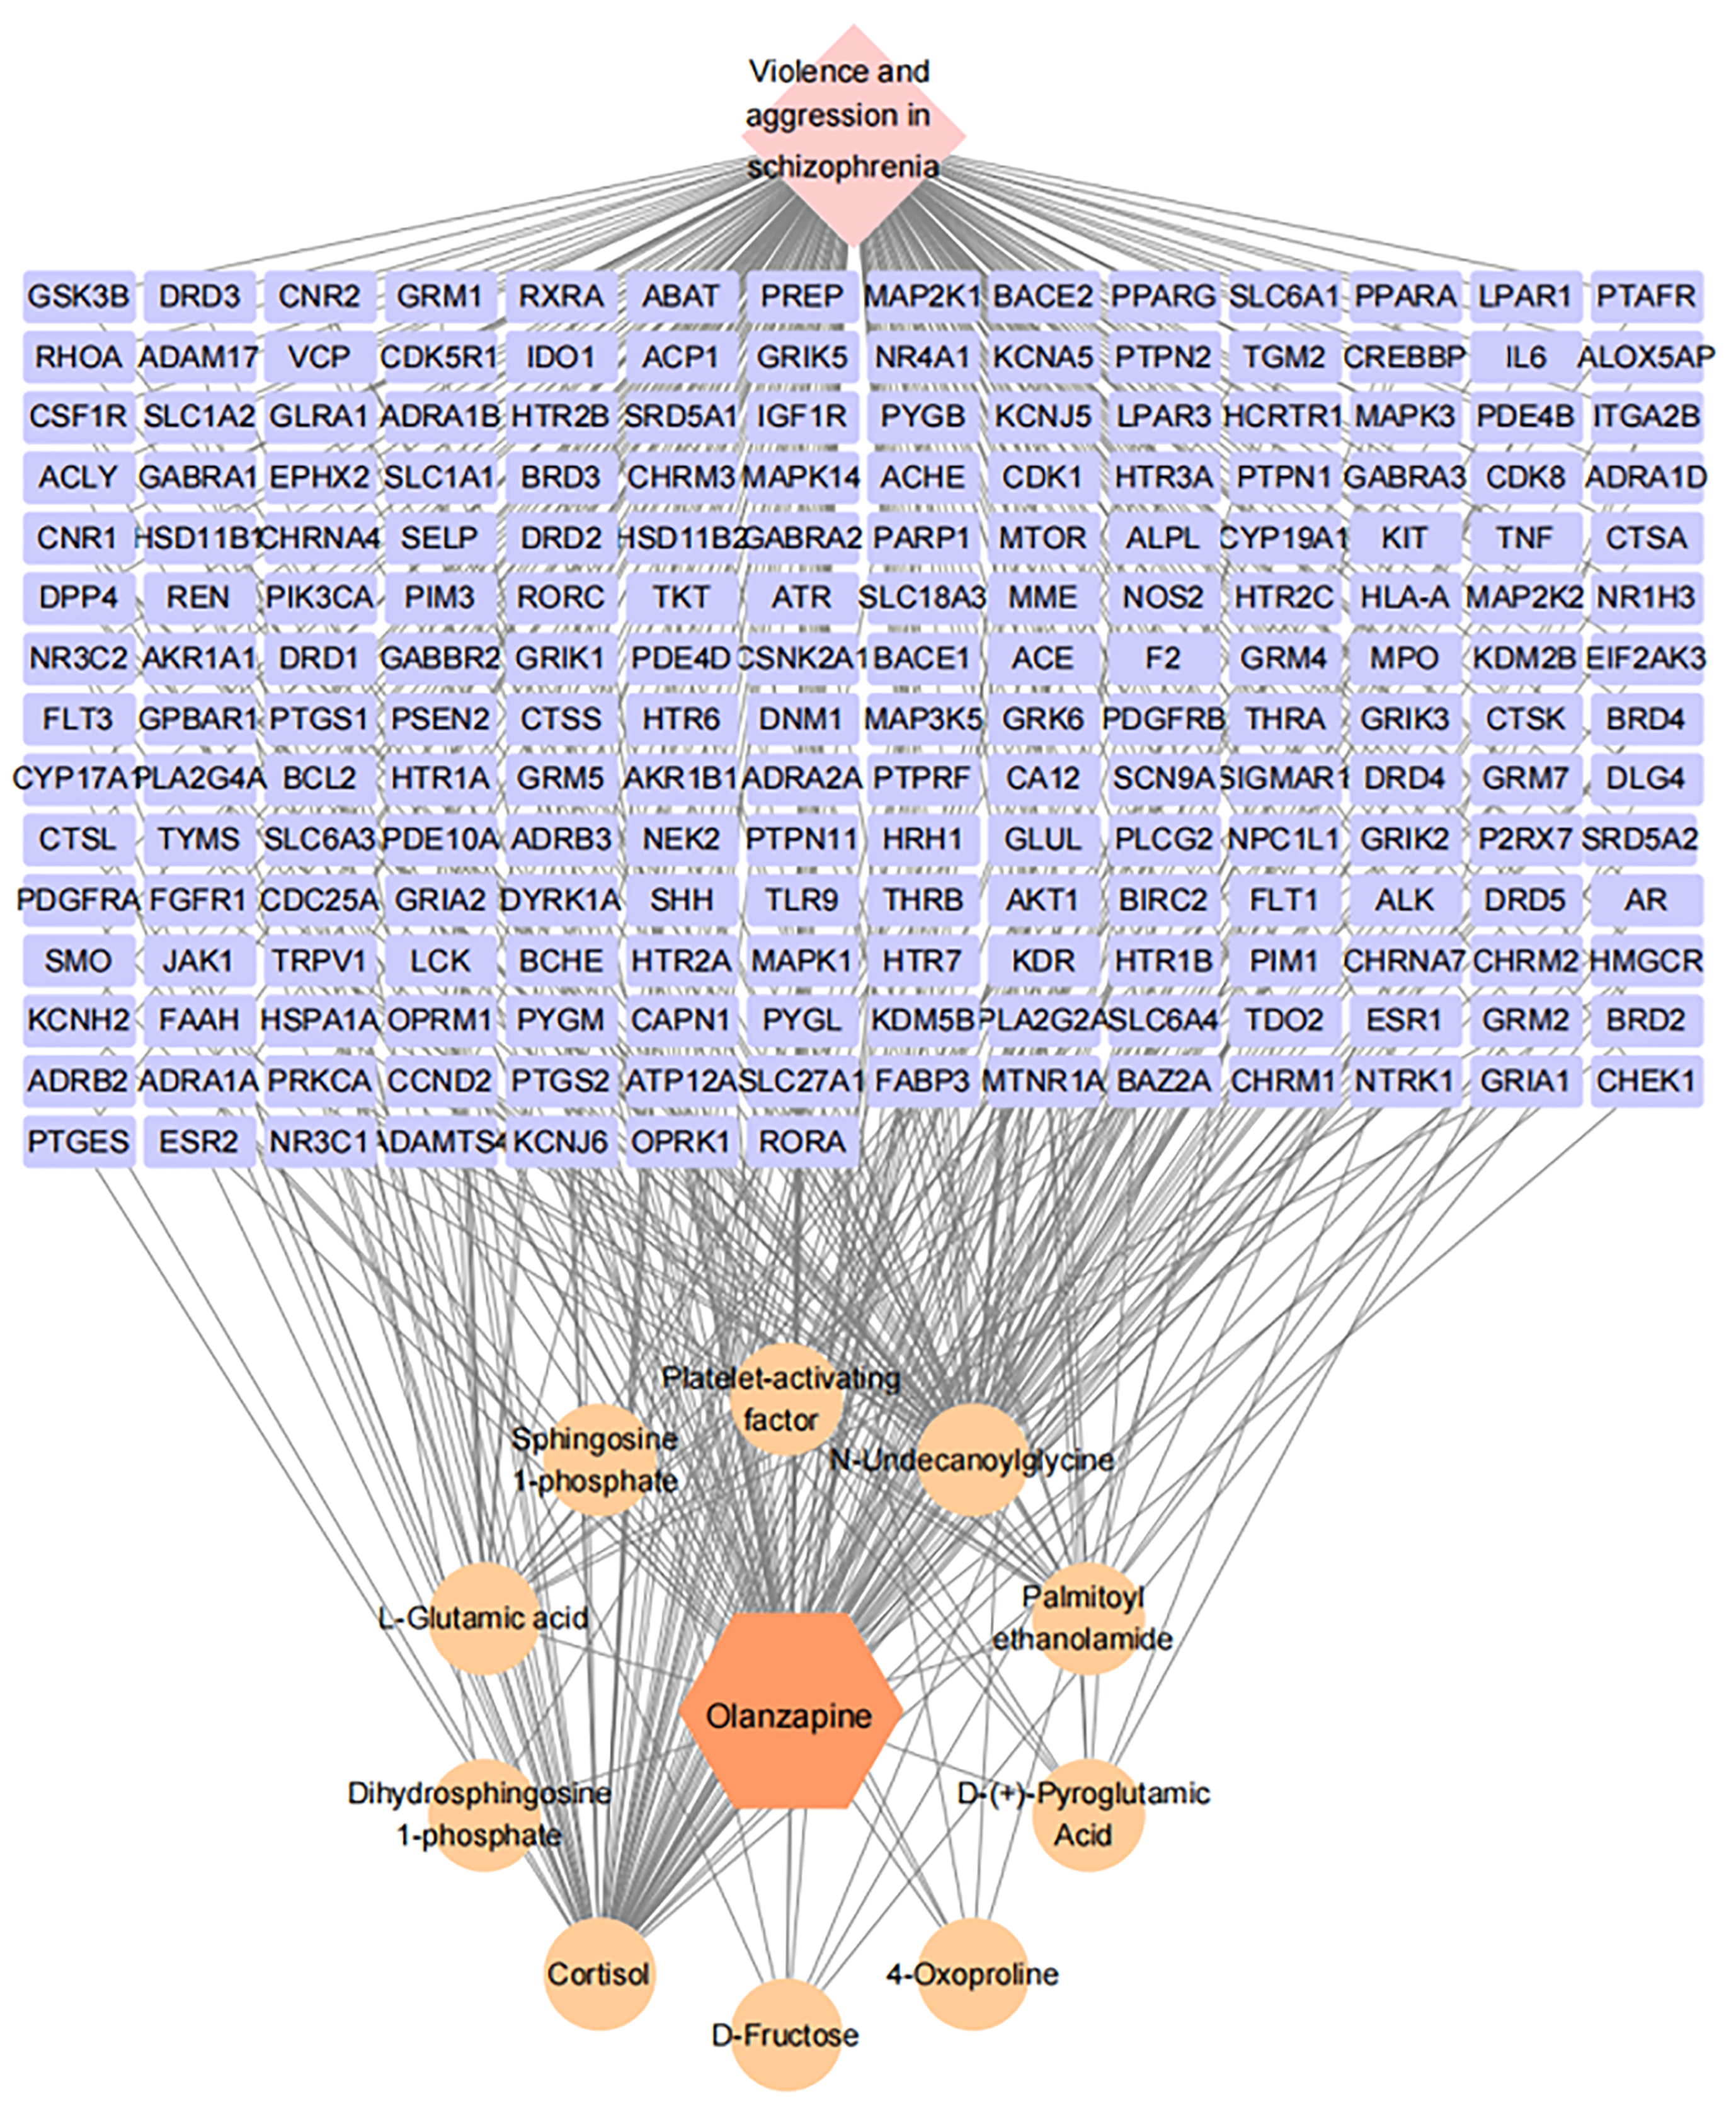
Figure 7 Metabolite-target-disease network diagram.
- Citation: Song YN, Xia S, Sun Z, Chen YC, Jiao L, Wan WH, Zhang HW, Guo X, Guo H, Jia SF, Li XX, Cao SX, Fu LB, Liu MM, Zhou T, Zhang LF, Jia QQ. Metabolic pathway modulation by olanzapine: Multitarget approach for treating violent aggression in patients with schizophrenia. World J Psychiatry 2025; 15(1): 101186
- URL: https://www.wjgnet.com/2220-3206/full/v15/i1/101186.htm
- DOI: https://dx.doi.org/10.5498/wjp.v15.i1.101186


