Copyright
©The Author(s) 2024.
World J Psychiatry. Jun 19, 2024; 14(6): 985-998
Published online Jun 19, 2024. doi: 10.5498/wjp.v14.i6.985
Published online Jun 19, 2024. doi: 10.5498/wjp.v14.i6.985
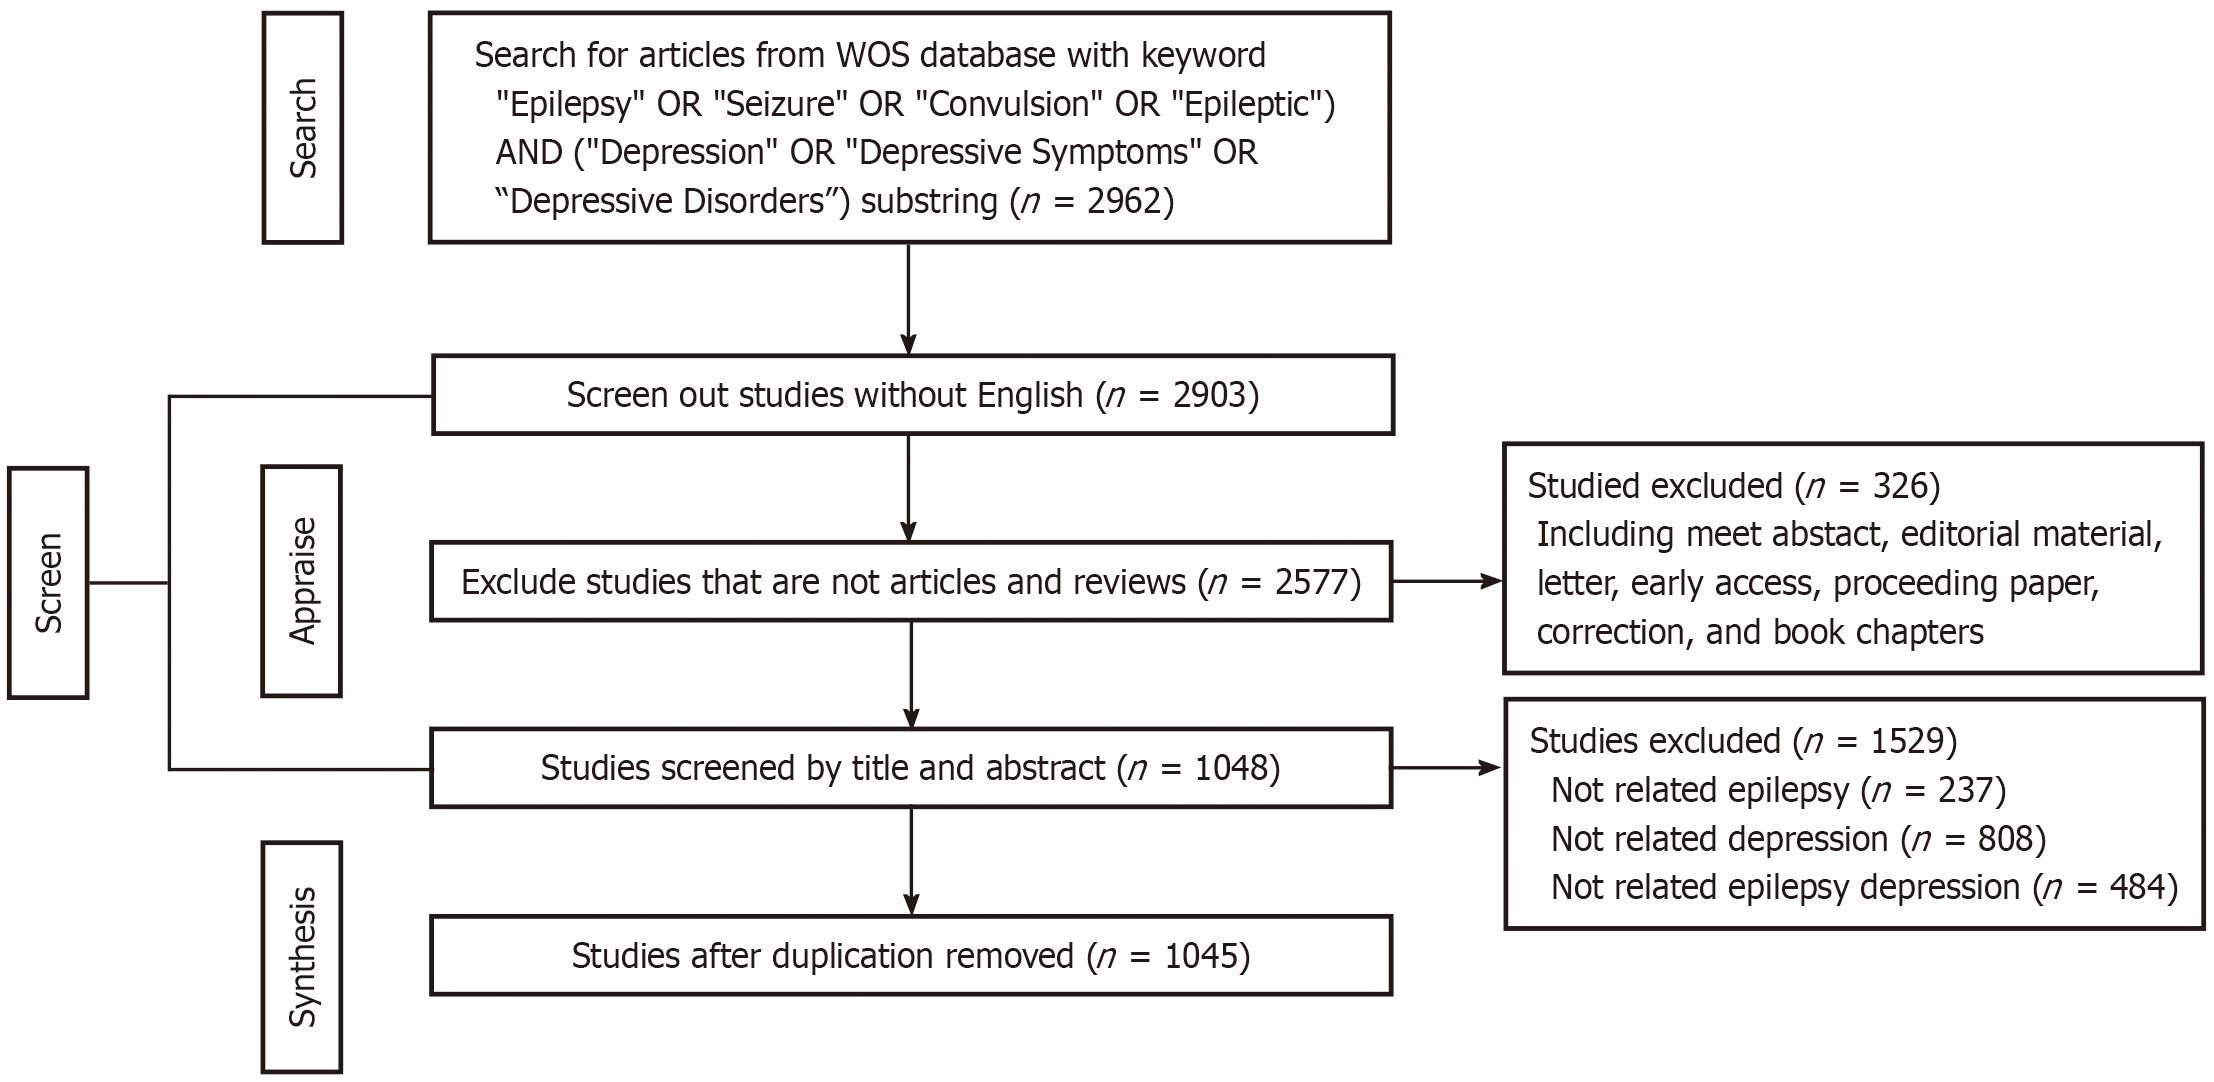
Figure 1 The selection of documents.
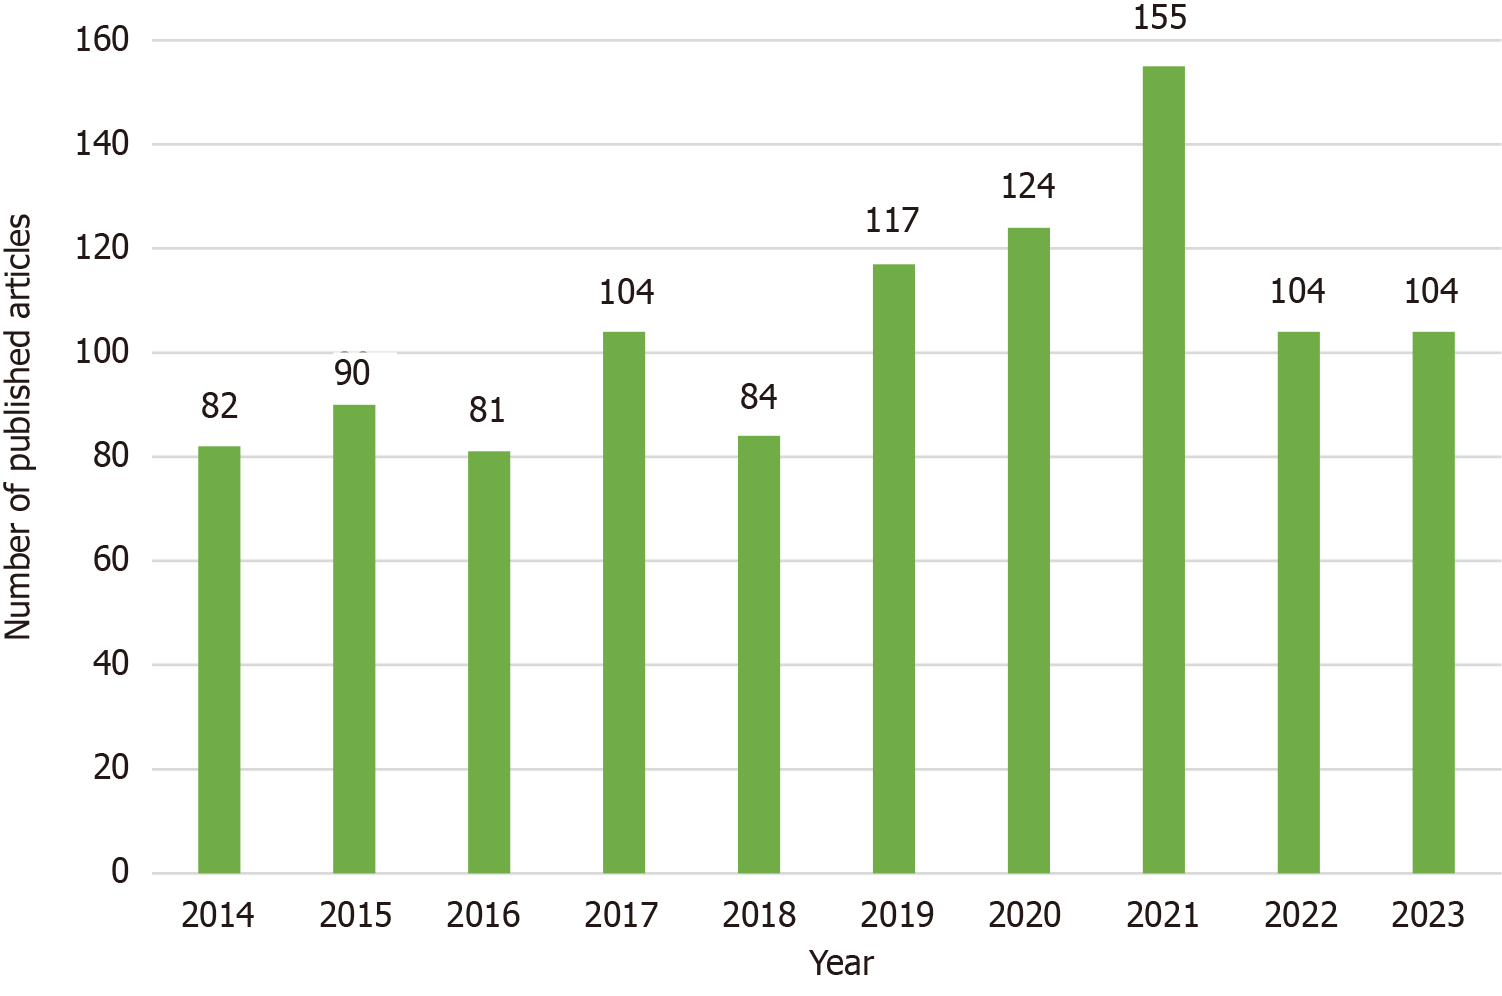
Figure 2 Distribution of publications from 2014 to 2023.
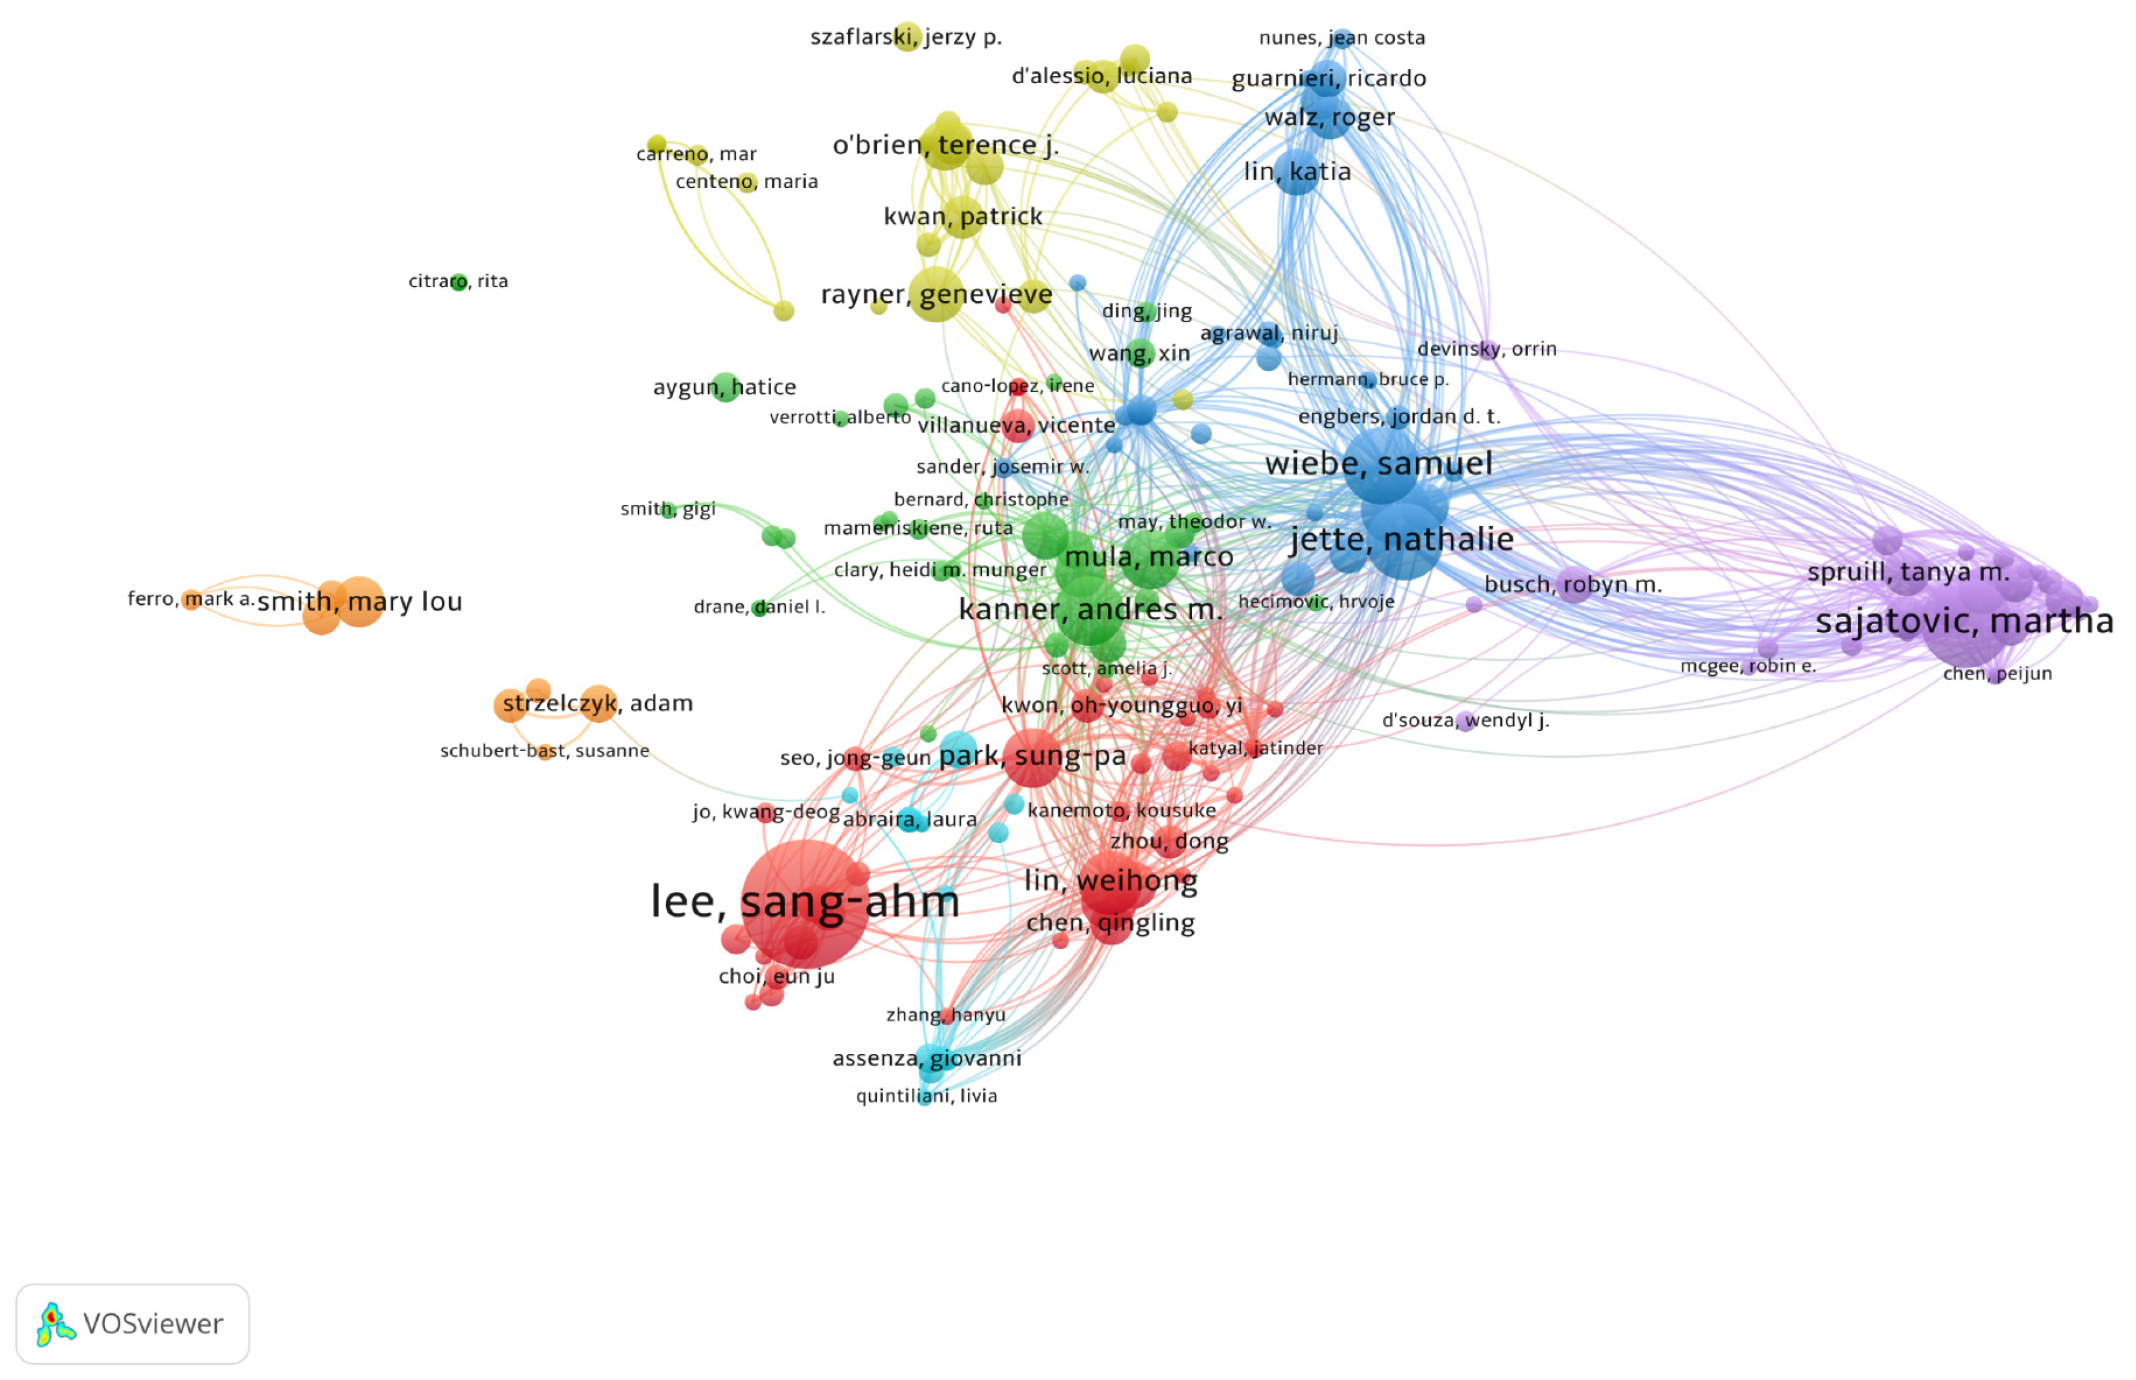
Figure 3 Network visualization of core authors.
The larger the node is, the greater the number of published articles. The node connection lines represent the strength of the relationship between authors.
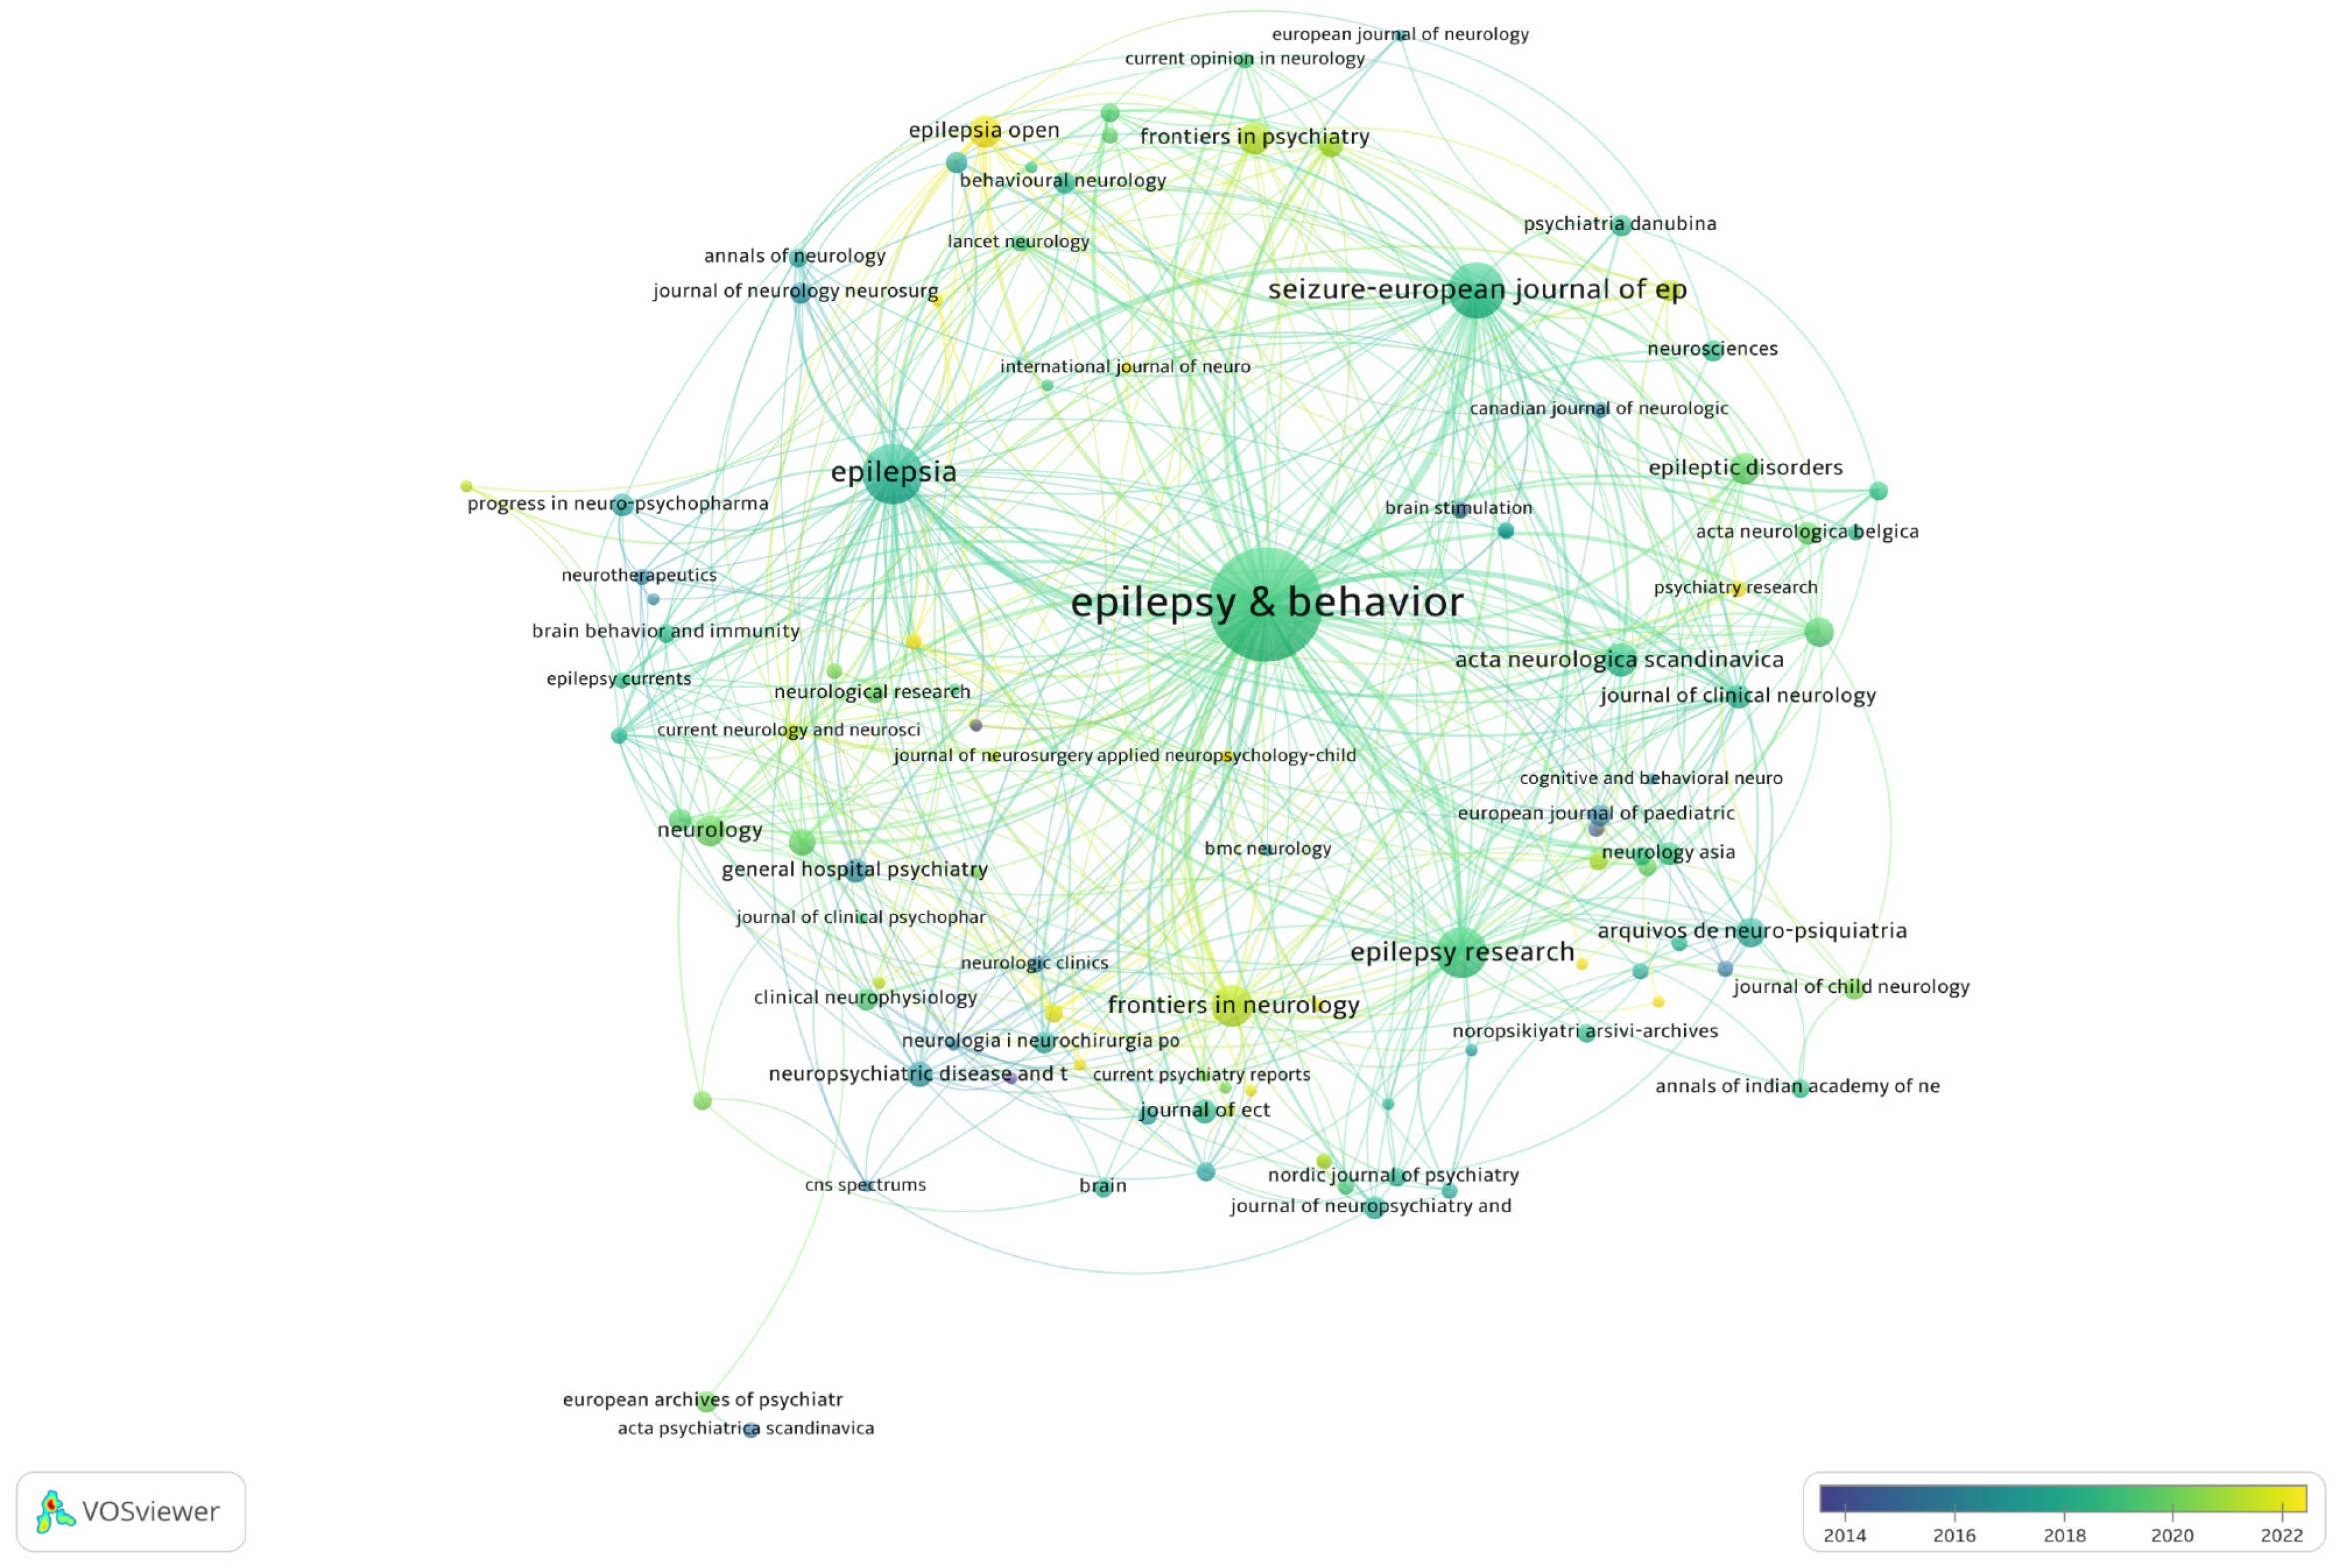
Figure 4 Visualization of the published journal network.
The larger the node is, the greater the volume of published articles and the node connection lines represent the strength of the relationship between journals.
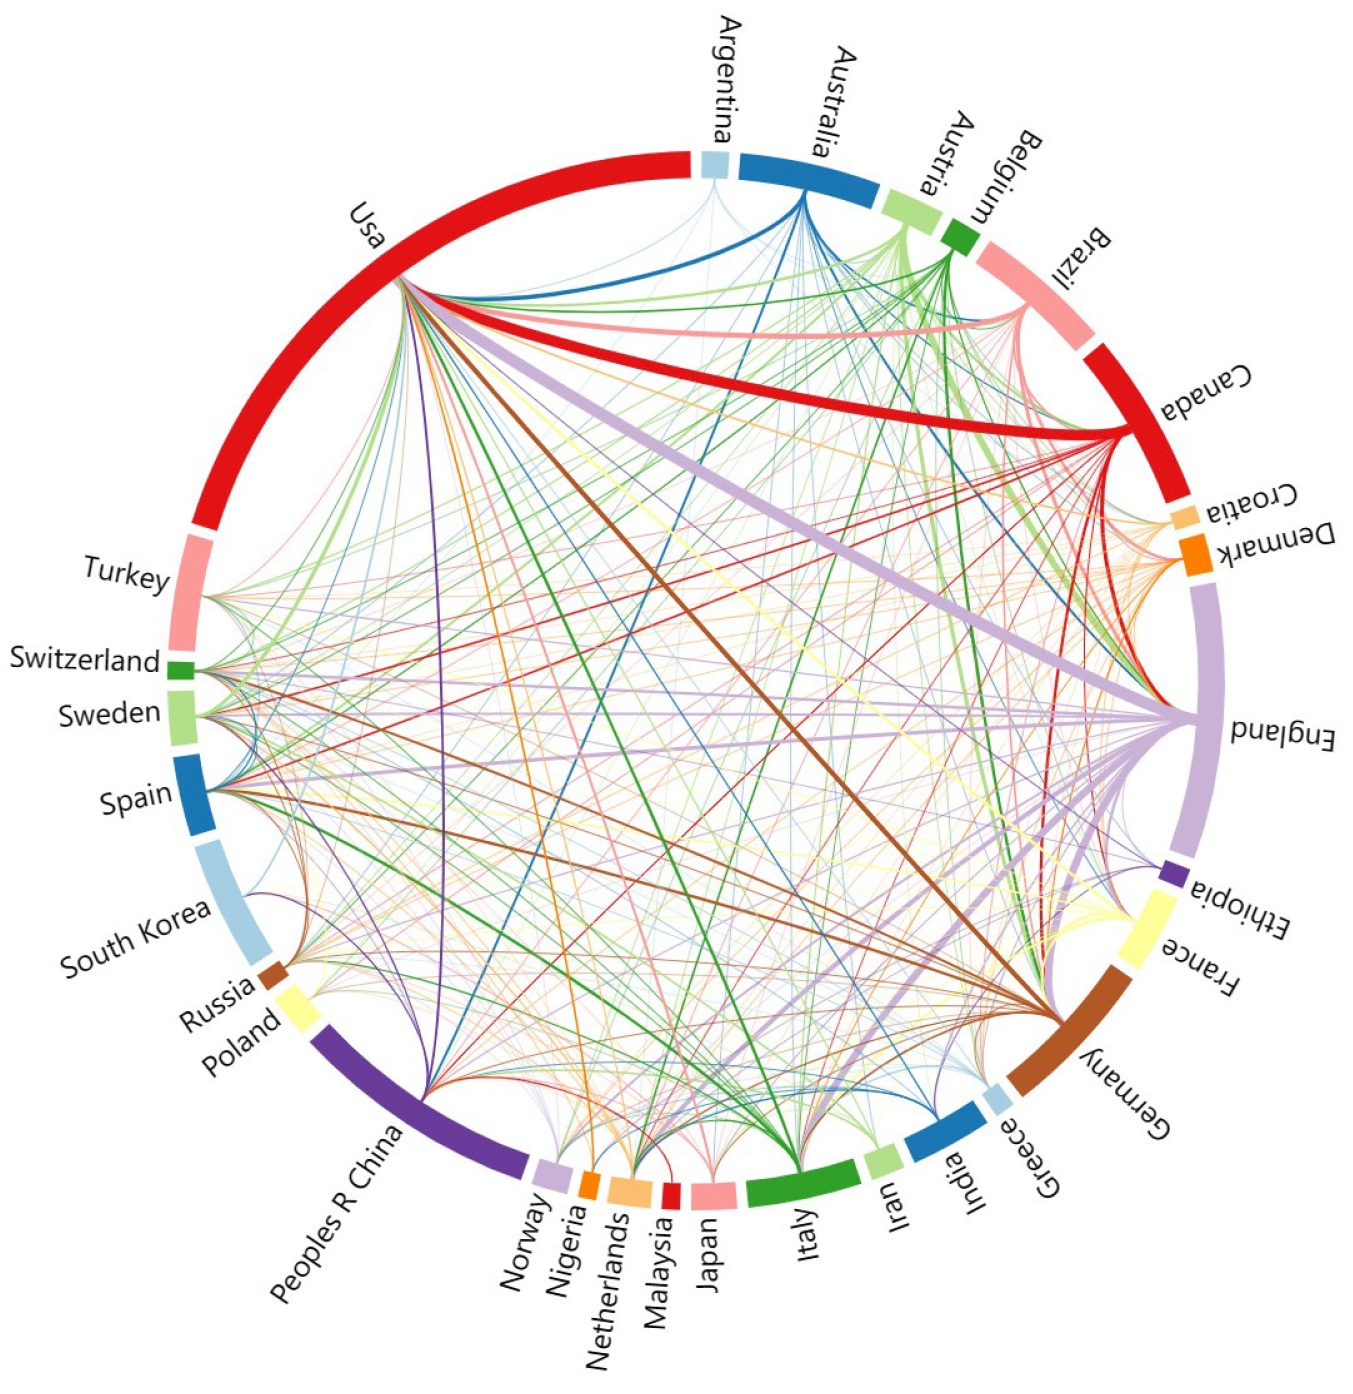
Figure 5 Cooperative relationships between countries.
The thickness of the line represents the strength of the collaboration between countries.
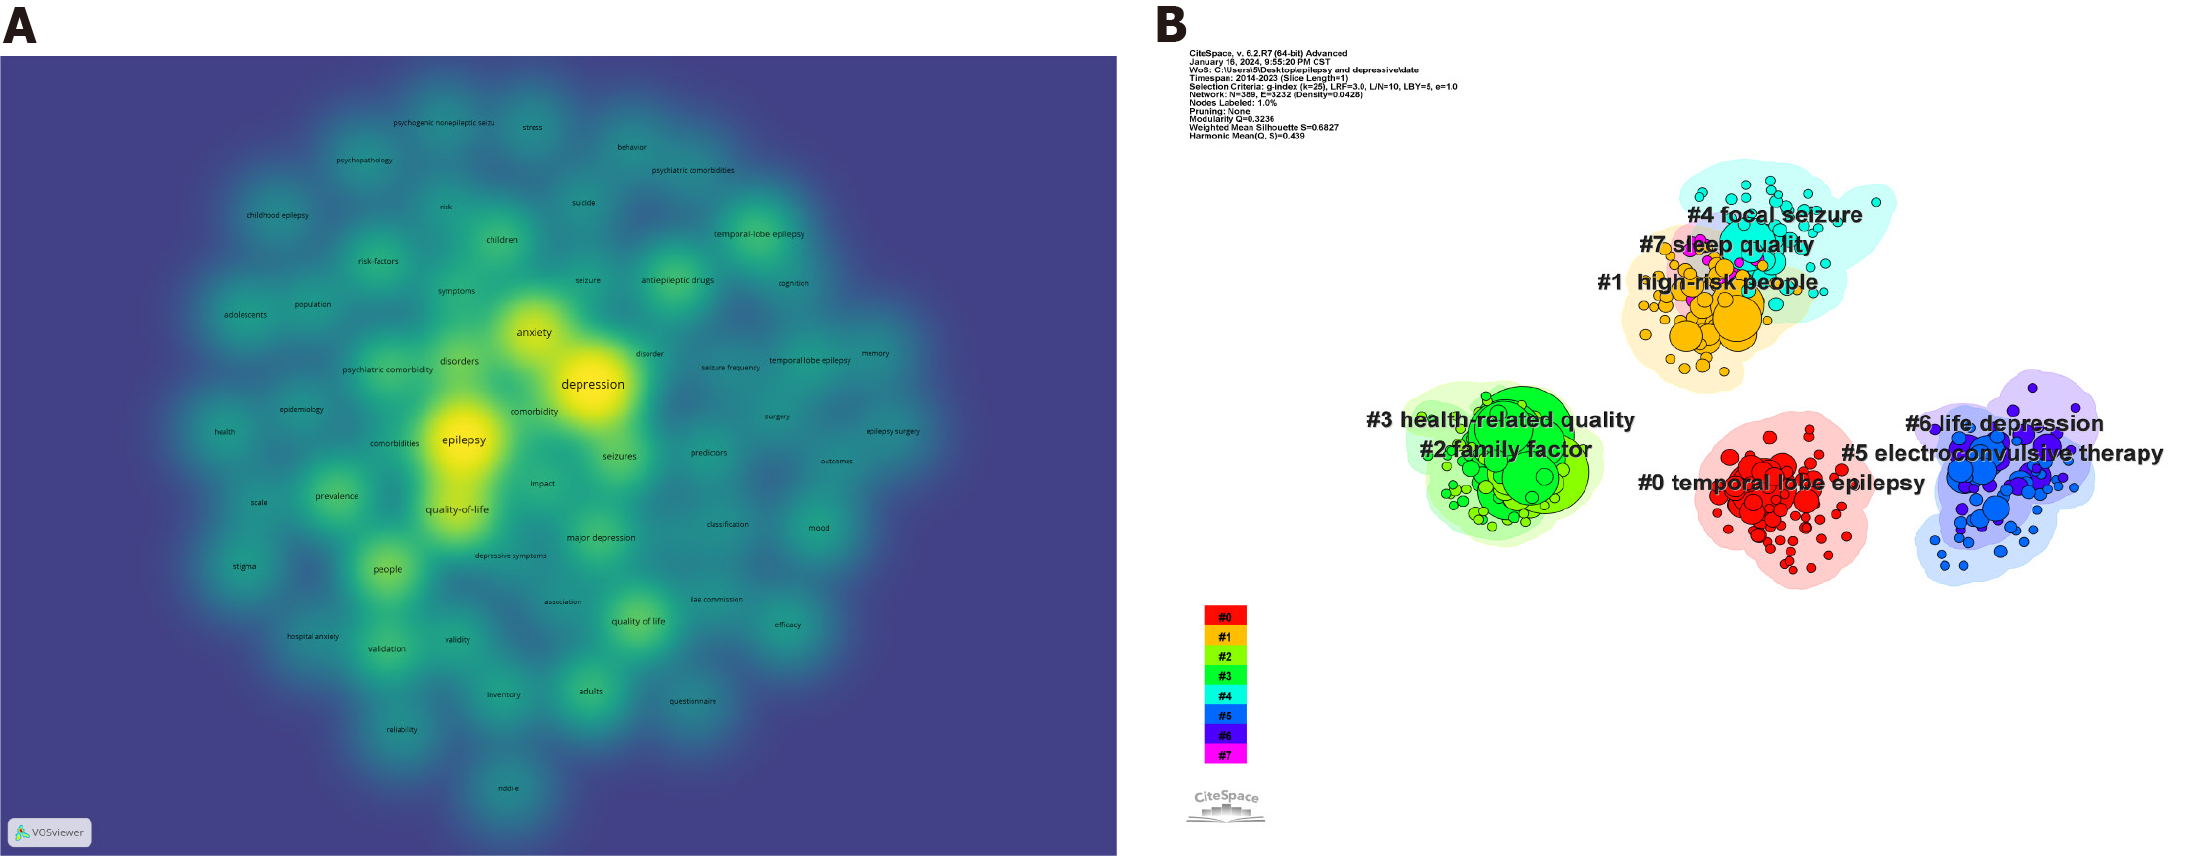
Figure 6 Analysis of the Keywords.
A: The keyword co-occurrence map. The greater the density is, the greater the frequency of keywords that appear; B: Visualization of the keyword cluster analysis. Each cluster is depicted with a unique color.
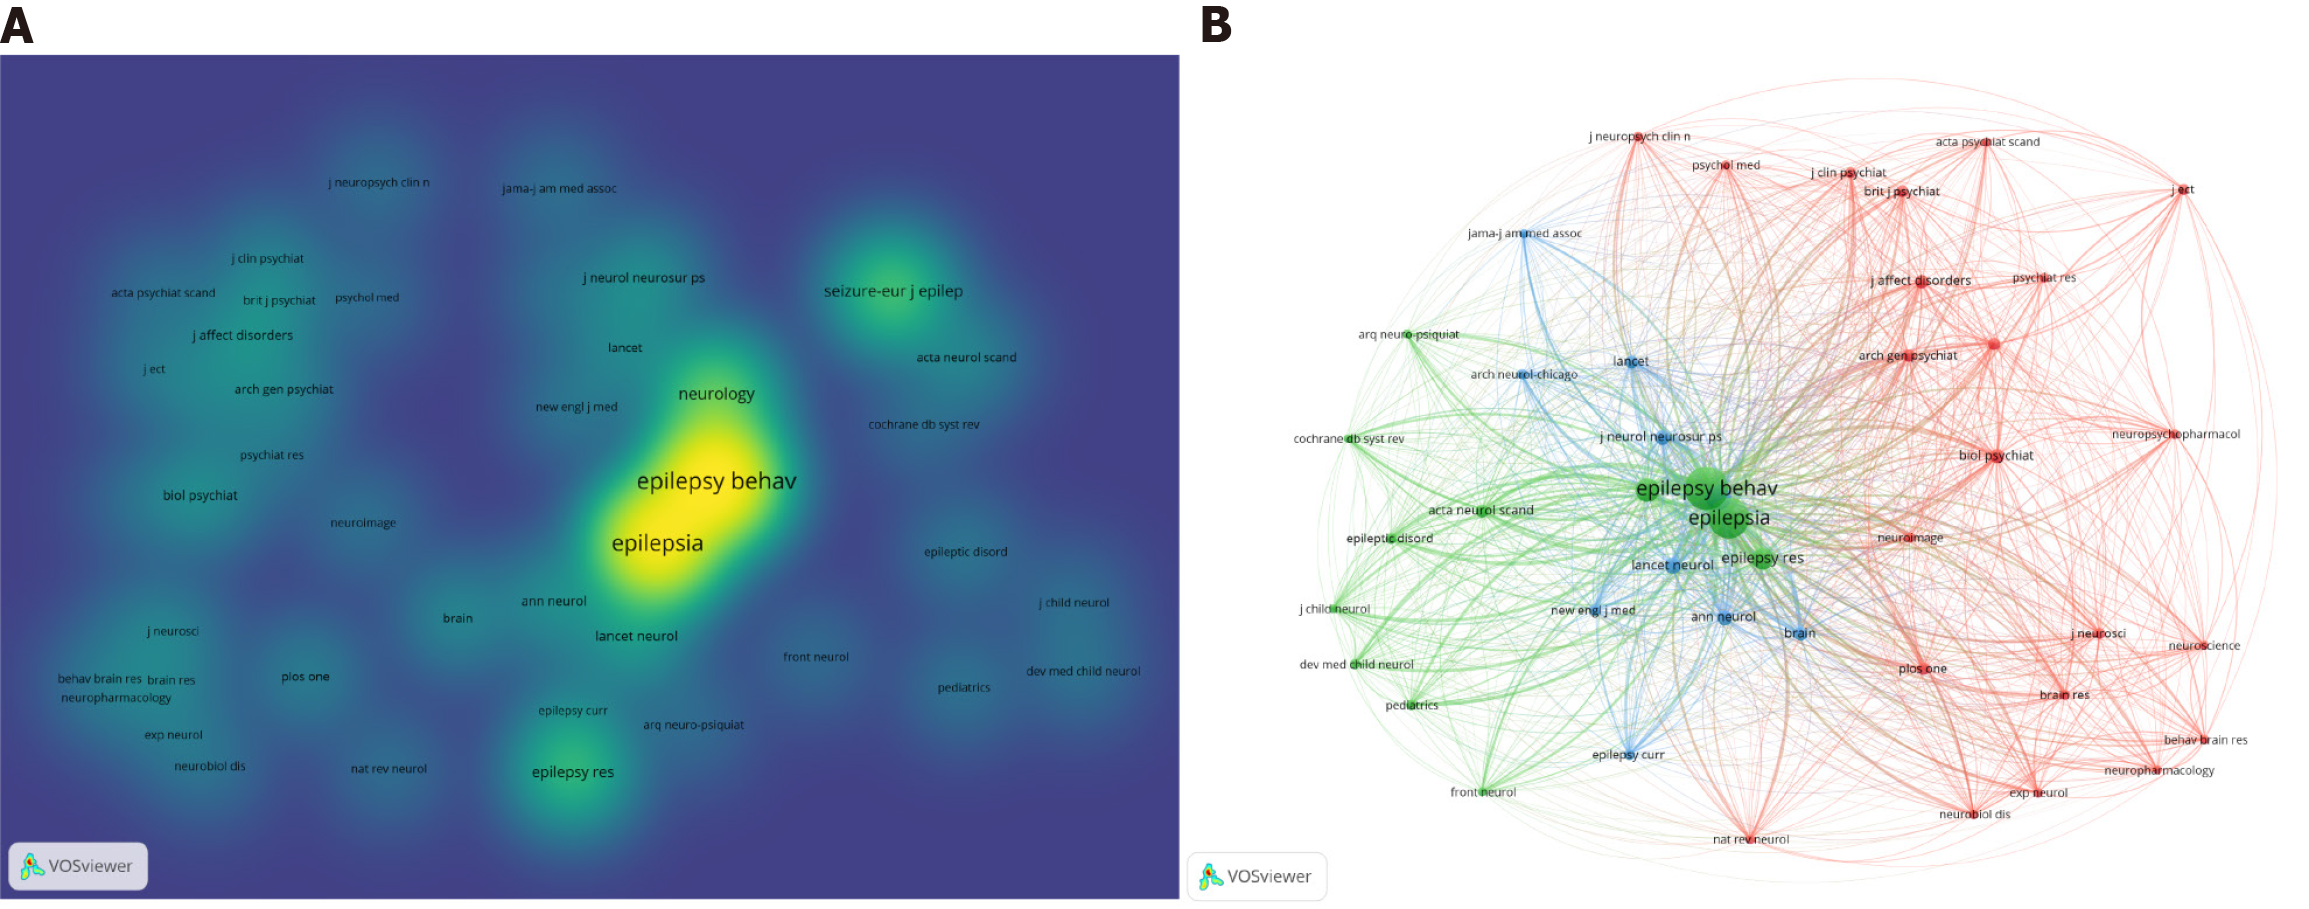
Figure 7 Co-citations of cited journals.
A: The greater the density is, the greater the frequency of cited journals; B: The larger the node is, the greater the number of frequently cited journals. The node connection lines represent the strength of the relationships between keywords.
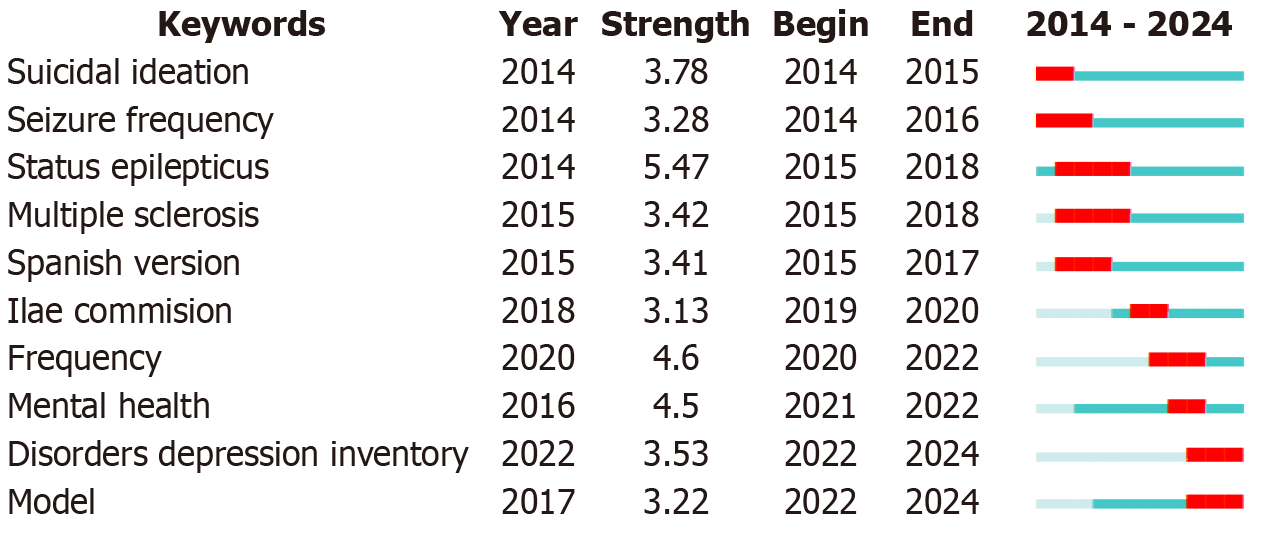
Figure 8 The top 10 keywords with the strongest citation bursts.
- Citation: Chen L, He XH, Li XL, Yang J, Huang H. Bibliometric analysis of research in epilepsy and comorbid depression from 2014 to 2023. World J Psychiatry 2024; 14(6): 985-998
- URL: https://www.wjgnet.com/2220-3206/full/v14/i6/985.htm
- DOI: https://dx.doi.org/10.5498/wjp.v14.i6.985


